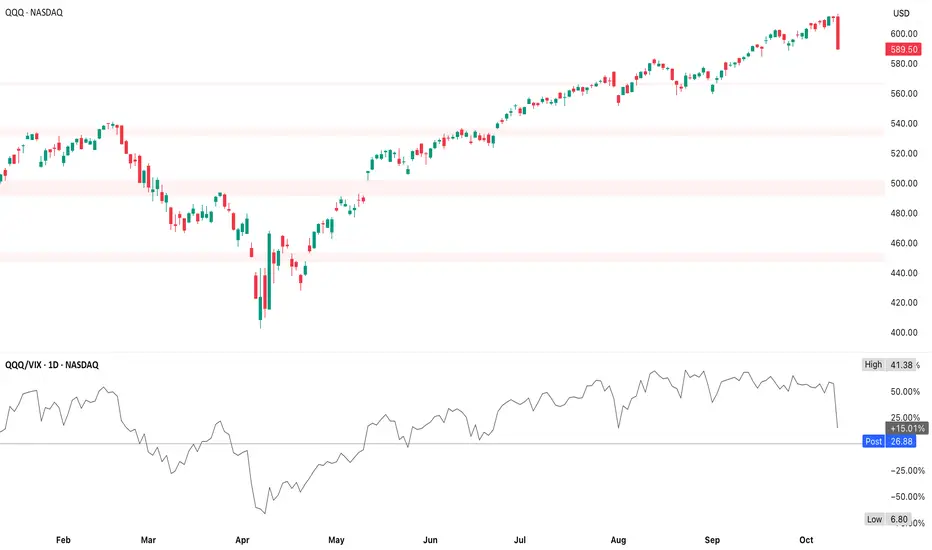
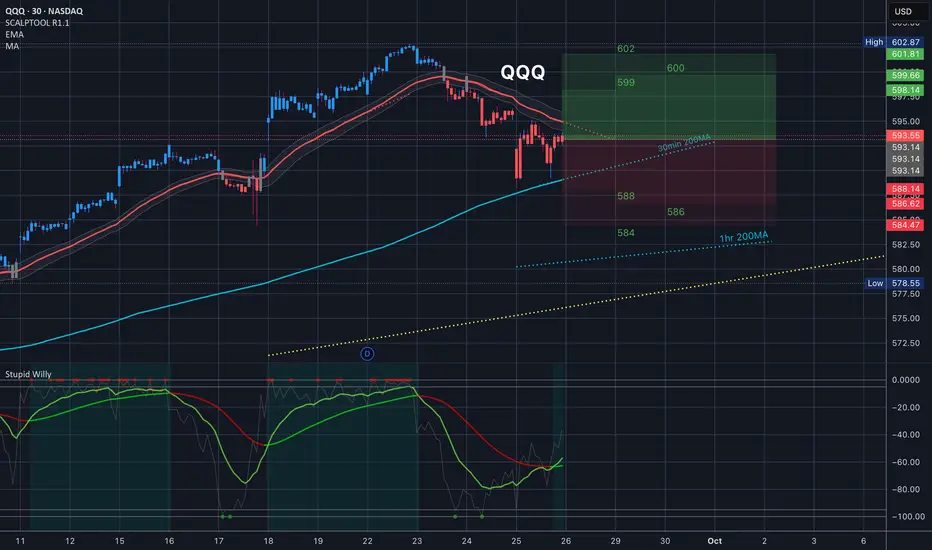
QQQ Short-Term Sentiment WashoutSteep one-day drawdown + fear spike often precedes short-term rebounds & so long as $585 holds, the setup favors a reflexive rally back toward $605–$610
585–$600 is the active panic zone; heavy selling & volatility expansion
Next major support is $560–$570 which is the base from spring, if this breaks, larger correction risk
Resistance 1 at $605–$610 is the first bounce target/prior floor
Resistance 2 at $620–$625 is the intermediate target if rally extends multiple days
This looks more like a sentiment flush than the start of a prolonged bear move (at least for now) so confirmation signals to watch Monday
QQQ futures (NQ) green premarket +0.5% or more
VIX down 5–8%
Mega-caps (NVDA, MSFT, AAPL) showing strong premarket bids
RSI divergence or a hammer candle near $585–$590 intraday
QQQ trade ideas
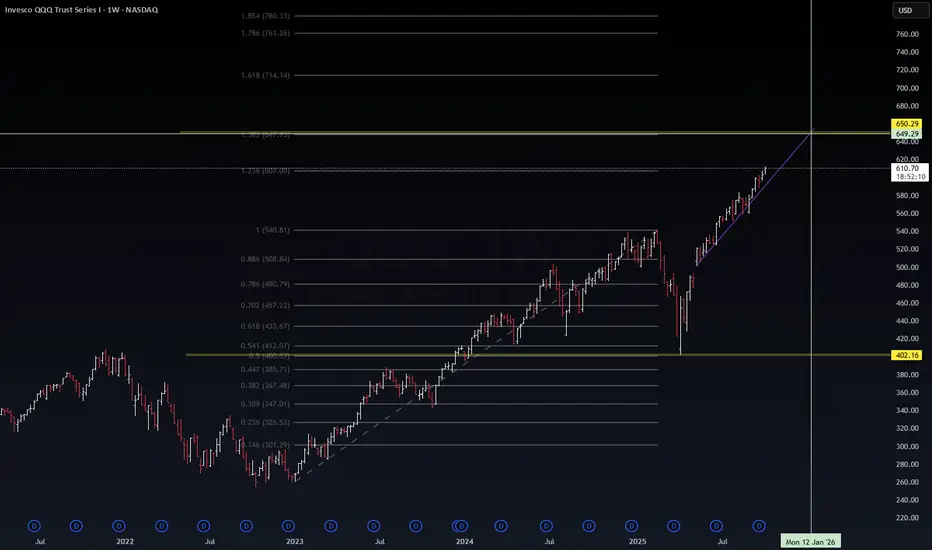
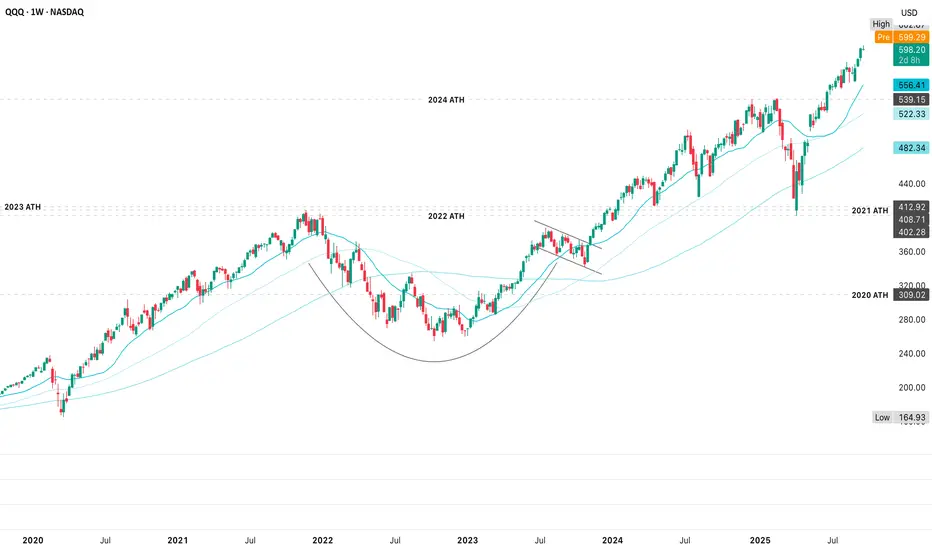
$QQQ | VolanX Macro Wave Projection – 2025/26 Outlook⚡ NASDAQ:QQQ | VolanX Macro Wave Projection – 2025/26 Outlook
Price currently accelerating along a sharp trendline toward the Fib 1.236 extension near 650.
Momentum remains strong, but structure now mirrors the late-stage expansion phase — high probability of equilibrium retest before continuation.
Key Zones:
Support: 540 → 508 (prior breakout base)
Equilibrium: 480–500 zone
Premium Target: 650–660 (1.236 confluence)
Next Macro Resistance: 714–760 (1.618–1.786 extension)
📊 VolanX DSS Bias:
Bullish momentum intact ✅
Macro trend exhaustion probability: ~35%
Long-term trajectory remains upward unless 540 fails
A controlled pullback would strengthen the long-term structure — healthy, not bearish.
Keep an eye on liquidity behavior near 650; that’s where big money will rotate.
#QQQ #VolanX #MacroWave #LiquidityZones #SmartMoney #AITrading #WaverVanir
Not Investment Advice ⚡
QQQ Short-Term RhythmThe expected-move range (using current IV ≈ 17%-18%) to see where QQQ statistically “should” trade by mid-October, which may be helpful for picking your next strike
1. Bounce from 20d MA $596–$600 with a retest of $610–$615 (60%)
2. Sideways continuation between $600–$610 (25%)
3. Close <$595 with a pullback to $580 (15 %)
A dip into $598-$600 with a stabilizing candle is statistically the highest-reward entry for short-term calls
No reason to short unless price closes below both the trendline and 20d MA on elevated volume (>60M)
If anything, the next real move could be a bounce attempt, not a flush
Based on current implied volatility (IV ≈ 17.8 %) & QQQ ≈ 605, the expected move (1σ range) for the coming week & into 24 October, where Expected Move = Price × IV × √( t /365)
17 October (10 days) ≈ 1σ 15 pts (68% probability) ≈ 2σ 30 pts (95% probability) $590-$620
24 October (17 days) ≈ 1σ 20 pts (68% probability) ≈ 2σ 40 pts (95% probability) $585-$625
31 October (24 days) ≈ 1σ 24 pts (68% probability) ≈ 2σ 48 pts (95% probability) $580-$630
So statistically, QQQ has about a 68% chance to stay between ≈ $585 & $625 by 24 October
If you’re bullish,
Favor calls slightly OTM ($610-$615) expiry 24 October
Target breakout confirmation above $608 with volume
If you’re cautious/swing-trading,
Use short-dated, low-cost put lottos near $600 only on breakdown <$600 (ideally Friday/Monday flush)
If you prefer defined risk,
Debit spreads ($605/$615 call spread) give good exposure without over-paying IV
20d MA ≈ $597 lines up with the lower 1σ bound (~$590-$595)
Resistance near $612 is mid-upper 1σ band (~$620)
So the option market’s “expected move” fits almost perfectly with your technical structure
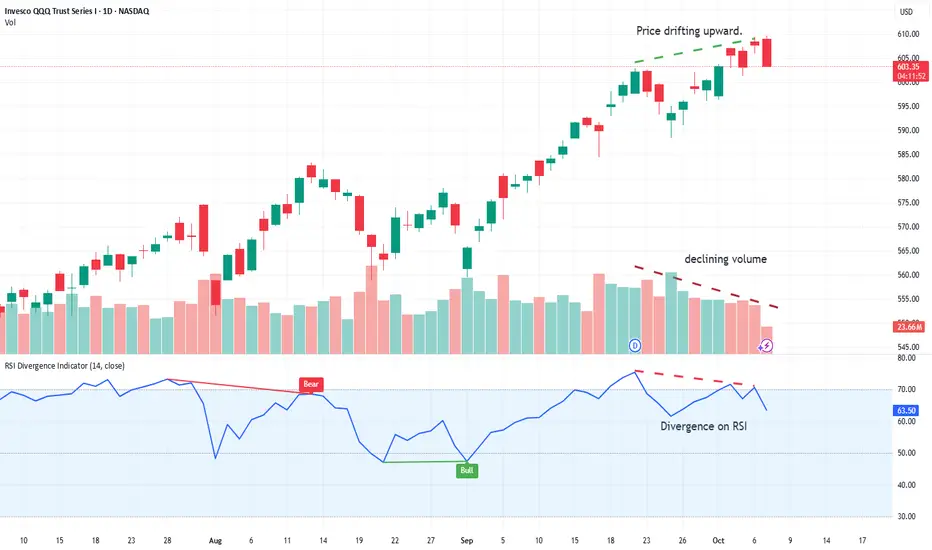
QQQ weakness about to break to the downsideDeclining volume, diverging RSI, sell-offs throughout the day.
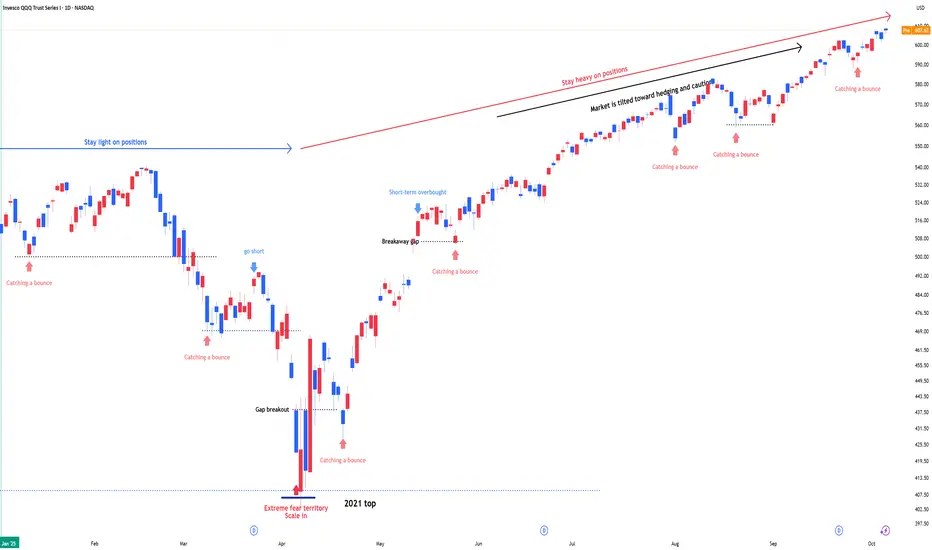
QQQ : Stay heavy on positionsQQQ : Stay heavy on positions (QLD, TQQQ)
Entering a risk-on, high-volatility zone.
In stay light on positions zones, I hold QQQ and reduce exposure.
In stay heavy on positions zones, I increase allocation using a mix of QLD and TQQQ.
** This analysis is based solely on the quantification of crowd psychology.
It does not incorporate price action, trading volume, or macroeconomic indicators.
QQQ Measured Moves & PivotsDo you chase the breakout, or wait for confirmation?
1. Buy calls now (since $605 cleared premarket)
PROS
You’re aligned with momentum
If price rips to $610+ off the open, you’re already in
Confirms the bullish measured move extension scenario
CONS
Premarket breaks often fake out at cash open
Chasing is a weaker risk/reward if it pulls back
You’re buying higher IV at the open, which inflates call premiums
2. Wait for retest of $600–$602 support
PROS
Cleaner entry with defined risk (stop under $598)
Better pricing on calls if IV cools during the dip
Confirms bulls are defending $600 as new floor
CONS
You might miss if there’s no retest and it rockets straight to $610+
Discipline can feel like “missed trade” even though it’s good risk management
3. Balanced Play (what many pros do)
Scale in with a starter call position on the breakout (>$605)
If $600–$602 is tested & defended with volume, add size
That way you’re not empty-handed if it runs, but you still get confirmation if it pulls back

QQQ Bullish Continuation BiasThat long lower wick + strong volume at the end of the day shows the dip was bought aggressively (buyers stepped in quickly when price pulled back)
Confirmed with volume so not just a “wick,” but actual conviction (institutions/algos defending the level)
That turns what could have been a “top signal” into more of a healthy consolidation candle inside an uptrend
When you see long wicks + heavy volume near support or resistance, it’s usually a sign of absorption with big money is willing to take the other side
At $600–$603, that’s especially important because it’s both a breakout retest & psychological level
As long as price holds above $600, that wick + volume combo suggests bulls still in control
A move through $605 on volume now has higher odds of continuation toward $610
Only if we see heavy sell volume without the wick (closing weak under $600) would it flip to bearish

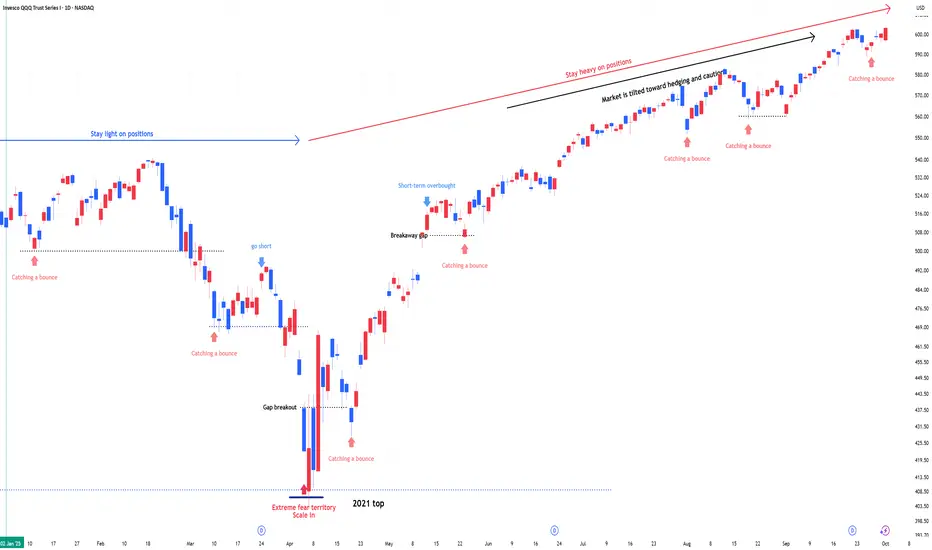
QQQ : Stay heavy on positionsQQQ : Stay heavy on positions (QLD, TQQQ)
Entering a risk-on, high-volatility zone.
In stay light on positions zones, I hold QQQ and reduce exposure.
In stay heavy on positions zones, I increase allocation using a mix of QLD and TQQQ.
** This analysis is based solely on the quantification of crowd psychology.
It does not incorporate price action, trading volume, or macroeconomic indicators.
QQQ Sitting Near HighsQQQ is in a long-term uptrend, but near-term is at decision resistance ($603)
Short-term momentum looks stretched, while the 1h/4h charts suggest buyers still have control unless $588 breaks down
15m chart suggests overbought, signaling short-term caution
1h chart shows QQQ is building momentum, leaning bullish if $603 breaks
4h chart shows the larger uptrend intact, sitting near highs, but momentum slowing
1. Bullish
Breakout above $602–$603 (double-top resistance)
Short-term signals QQQ is overbought, so some chop/pullback may happen before a clean breakout
Medium-term shows RSI trending up, Stoch rebounding, which suggests fuel for another leg higher
Bigger picture is still in a strong uptrend, consolidation near highs, no major breakdown
$610–$615 (measured breakout & round number magnet)
$622–$625 (extension if momentum holds)
Stop-loss (risk control) at $596–$598 (to avoid false breakout traps)
~55% (slight edge to bulls)
Trend favors upside, momentum still constructive on 1h/4h, but 15m overbought tempers confidence
2. Bearish
Failure to hold $600 could test $588 neckline
Short-term is overbought, ripe for a pullback
Medium-term double-top structure is still in play if rejection holds
Bigger picture retracement levels ($560–$567) if neckline fails
Pattern risk (double top) is real, but bulls still control trend unless neckline gives way
$588 (neckline)
$572–$573 (measured move from double top)
$560–$567 (Fib support, must hold for bull trend survival)
Stop-loss (risk control) above $603–$605 (don’t fight a breakout)
~45%

QQQ SEP-OCT 2025QQQ is consolidating near the upper resistance zone after hitting 5.5B volume. Strong supports are at 570 and 530, with a critical open gap around 490 that could act as a magnet if momentum fades. Institutional flows show distribution near highs, but trend support remains intact.
Upside target: 605 if resistance breaks with strength
Downside target: 530, with risk of 490 gap fill if weakness persists
#QQQ #globaltrade #investment #investing #stockmarket #wealth #realestate #markets #economy #finance #money #forex #trading #price #business #currency #blockchain #crypto #cryptocurrency #airdrop #btc #ethereum #ico #altcoin #cryptonews #Bitcoin #ipo

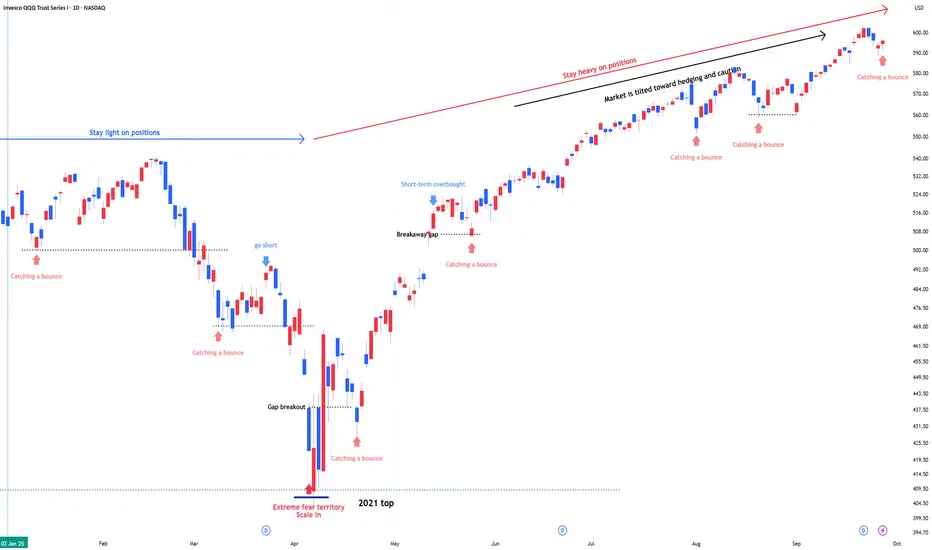
QQQ : Stay heavy on positionsQQQ : Stay heavy on positions (QLD, TQQQ)
Entering a risk-on, high-volatility zone.
A signal for catching a bounce has emerged.
In stay light on positions zones, I hold QQQ and reduce exposure.
In stay heavy on positions zones, I increase allocation using a mix of QLD and TQQQ.
** This analysis is based solely on the quantification of crowd psychology.
It does not incorporate price action, trading volume, or macroeconomic indicators.
QQQ Daily AnalasysQQQ is in a short-term pullback inside a long-term uptrend. Watch 582–578 support for signs of a bounce. A breakdown could target 559–560. Upside resistance is 594–602.
$QQQ Tomorrow’s Trading Range 9.26.25
This is tomorrow’s trading range for SPX - Look at that Island gap in the upper part. What do you think? End of the rally?
Rates were cut, equities are overvalued and it’s time to reverse this beast. Just my opinion - trade the chart not my opinion.
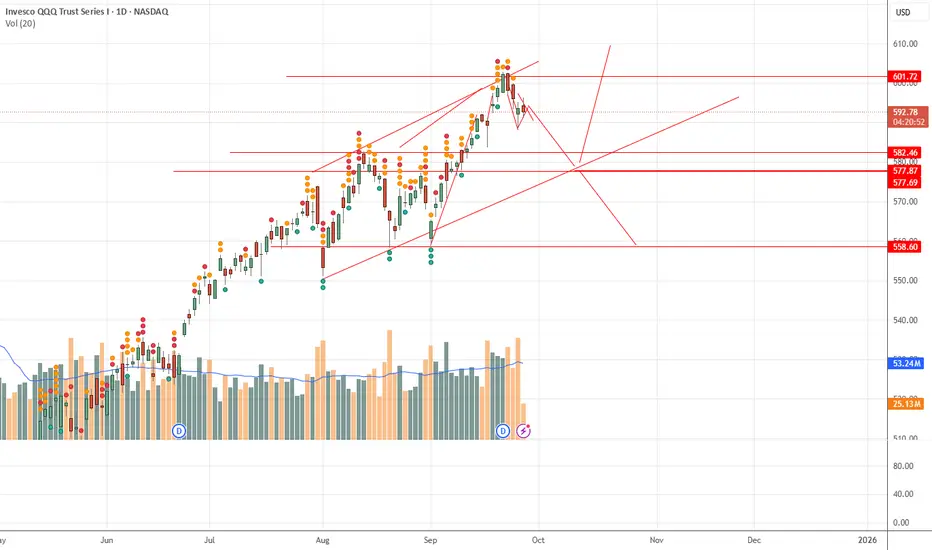
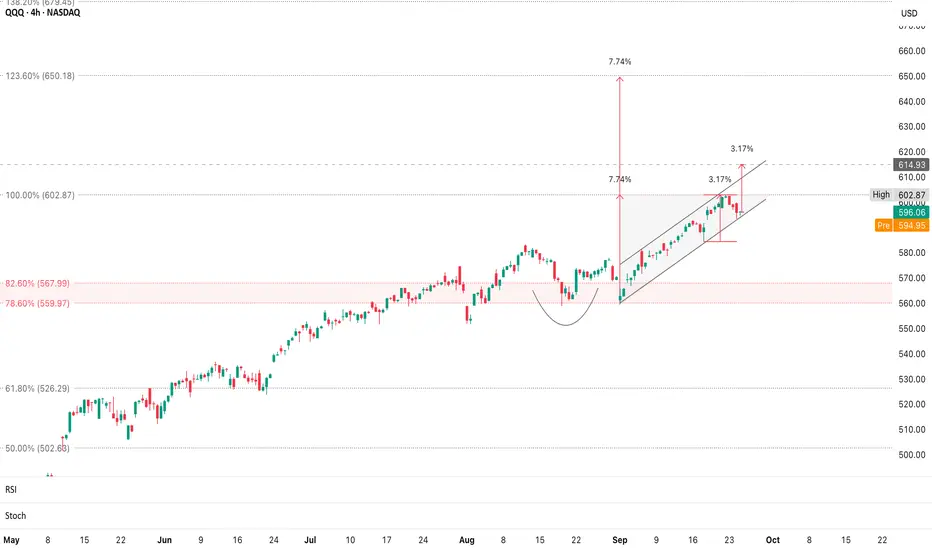
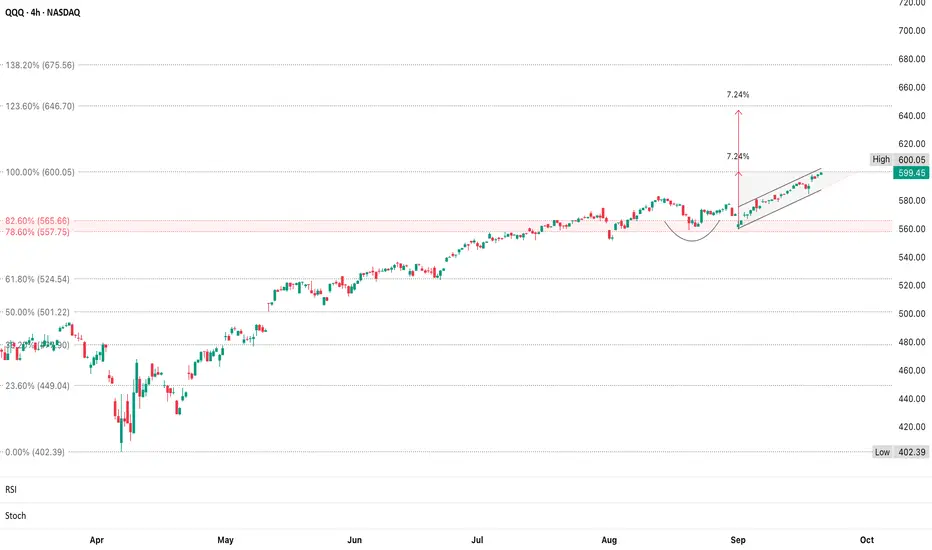
QQQ Channel SupportQQQ is consolidating after a strong rally & holding the rising channel keeps upside targets alive, but a breakdown risks a retrace to mid-$560s
If QQQ holds the channel and clears $602.87, the extension target is $650+ (123.6% Fib)
A break below the channel and $595 could pull back to $560–$567 (Fib support)
Long setup near $595 offers ~3:1 reward if aiming for $615–$650
Short setup below $595 has a cleaner move to $560–$567 (~5% downside)
Right after QQQ’s breakout above $580, price consolidated in a tight rising channel, that’s the small bull flag
If the bull flag breaks upward, it confirms momentum & could push QQQ toward $630 before testing the larger Fib extension at $650
If it fails, the channel support ($595ish) becomes key & a breakdown would negate the flag & risk a dip toward $560–567
The measured move (3.17%) from the flag points to $614.93 (short-term target)
The larger 123.6% extension at $650 remains the next big level
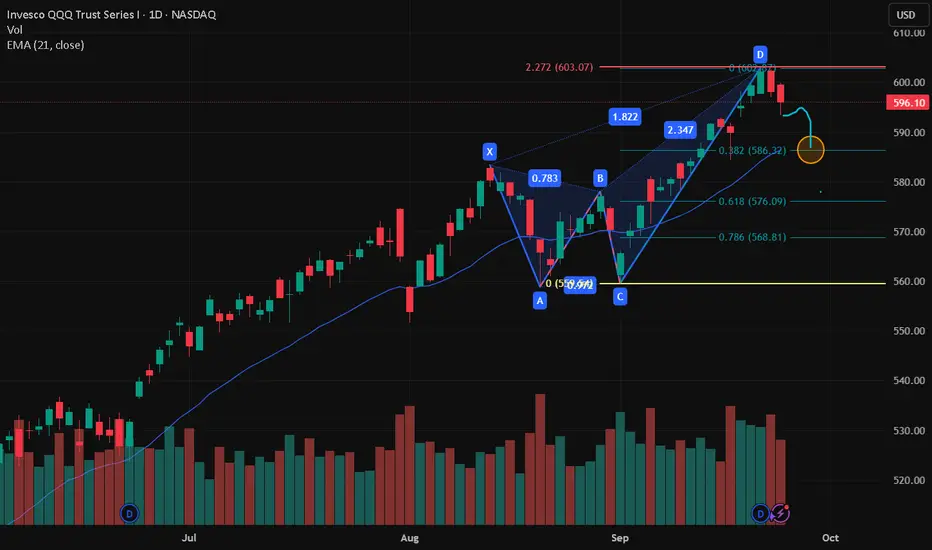
$QQQ completed 2.272% extensionNASDAQ:QQQ completed a 2.272% extension and reached the max of the Harmonic Pattern. I'm a Long only investor. I have sold some NASDAQ:QQQ every day since $593 to raise cash.
QQQ Blow-Off TopsA blow-off top is a rapid, almost vertical rally fueled by FOMO, followed by a sharp reversal; basically, when buyers exhaust themselves all at once at the highs
Steep, accelerating candles
Price goes near vertical with increasingly larger green candles
Little to no pullback along the way
Climactic volume
Volume spikes dramatically; often, the highest in weeks
Sign that everyone rushed in at once
Psychological level tag
Often happens at a round number (QQQ $600)
Big funds sell into retail chasing that breakout
Immediate reversal
After tagging the high, price reverses sharply
Often leaves a long upper wick or a big red candle the next day
In a normal pullback, price runs up, consolidates, dips a little, then continues trend
That parabolic sprint to $602 had some blow-off energy, but volume confirmation & follow-through matter
If QQQ holds $596–$598, then just a pullback
If it slices through $596 to $592 quickly, then the $602 peak was likely a blow-off top
1. November 2021 (~$400)
QQQ ran up nearly vertical into the end of November
Volume surged, RSI > 80 (extreme overbought)
Next sessions was a sharp reversal & that marked the all-time high for over a year
2. July 2023 (~$388)
A straight-line rally into mid-July
RSI & stochastics pinned high
Daily candle with a long upper wick, then a red engulfing candle the next day
QQQ retraced ~5% quickly
3. March 2024 (~$448)
Blow-off type move in tech earnings season
Price overshot resistance, then reversed hard within 2–3 days
QQQ currently reached ~$602 & setup looks similar
Strong parabolic run from ~$584 to $602 (+3%)
RSI was pushing toward overbought
Yesterday's red reversal candle below $600
If QQQ closes below 596, we’d have a failed breakout
Breakdown candle after a parabolic leg
High probability that $602 = short-term blow-off top
If it holds $596–$598 & bounces, then it’s just a consolidation, not a true blow-off
QQQ below $596 confirms the blow-off, while above $598 it’s still possible to rebuild
Blow-off top = acceleration up + exhaustion candle + fast reversal
If $596 breaks with volume, signals sellers are in control
1. $592–$593 (prior breakout shelf)
Textbook first downside target after a blow-off peak; often, where dip-buyers step in
2. $587–$588 (last pivot low before the parabolic run)
If blow-off confirms, this is a high-probability magnet
Stretch Downside (full retracement of blow-off leg)
3. $584 (base of the September run)
Would imply the parabolic move unwinds fully
Only in case of heavy selling/broad market risk-off
Daily close below $596 confirms a blow-off top
RSI roll-over from overbought with price under $596 = momentum shift
Volume spike on red candle = strong confirmation that $602 was exhaustion
If $602 was a blow-off top, QQQ’s clean retracement ladder is $592-$596, $587 & $584 (short-term, medium-term & stretch)
QQQ Late-Stage Accumulation/Melt-UpQQQ looks like it’s in late-stage accumulation/melt-up mode, not exhaustion
Breadth indicators confirm strength
If breadth starts diverging (price makes new highs while TRIN flips bearish & TICK dives), that’s when you prep for reversal
1. TRIN
Hovering around 0.66, still bullish
No broad selling pressure (>1.2)
Historically, as soon as you get multiple daily closes >1.2–1.5, that marks real distribution
2. TICK
Recently hugging slightly negative territory, but not collapsing
This means intraday downticks are outweighing upticks, but only modestly
At market tops, you often see TICK roll negative while TRIN stays suppressed, a divergence - worth monitoring
Price at highs + TRIN bullish + TICK mildly negative looks like rotation & digestion, not distribution
The early warning combo would be if TRIN spikes >1.2 & TICK deeply negative (TICK printing –400 to –600), that would show institutions unloading
In strong distribution phases, expect repeated deep negative sweeps (-400 to -600)
Right now, breadth is still net supportive

Powell: Stock Prices appear "Fairly Highly Valued"“We do look at overall financial conditions, and we ask ourselves whether our policies are affecting financial conditions in a way that is what we’re trying to achieve,” Powell said. “But you’re right, by many measures, for example, equity prices are fairly highly valued.”
“Markets listen to us and follow and they make an estimation of where they think rates are going. And so they’ll price things in,” Powell said in part of the conversation dealing with mortgage rates.
Though Powell noted the lofty equity values, he said this is “not a time of elevated financial stability risks.”
Not really something you want your central banker saying to keep positive momentum in the stock market. Particularly when the Nasdaq is fairly stretched. A downside scenario could see us pulling back into the EMA bands to 575s for the $QQQ.
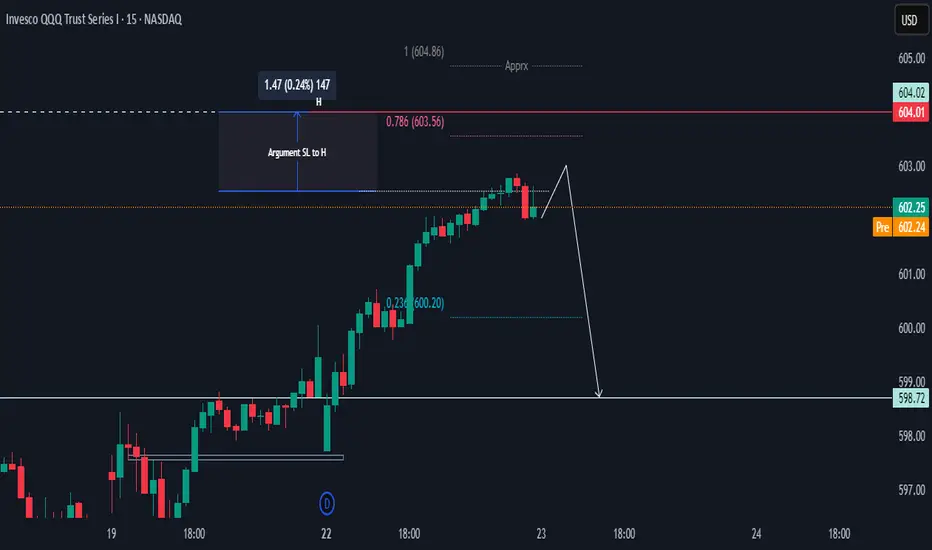
QQQ Potential DropHi there,
QQQ has the potential to drop to 598.72, with a price target of 600.20. The setup will be invalid at 604.02 if there is no sign of improvement. However, if there is momentum improvement, 604.86 will be the approximate invalidation level.
Happy Trading,
K.
Not trading advice
Forex Market Risk Management & Performance Analysis1. Introduction to Forex Market Risk Management
Forex trading (foreign exchange trading) involves buying and selling currencies in a highly liquid, 24/5 global market. While it offers profit opportunities, it also carries significant risks due to leverage, volatility, and global economic factors.
Risk management is the process of identifying, analyzing, and mitigating these risks to protect trading capital and ensure long-term profitability.
2. Types of Risks in Forex Trading
Market Risk (Price Risk)
Risk of losses due to currency price movements.
Example: A long position in EUR/USD suffers if the euro weakens against the USD.
Leverage Risk
Forex brokers often allow high leverage (e.g., 50:1, 100:1).
Leverage magnifies both gains and losses.
A small unfavorable move can wipe out your account if not managed.
Liquidity Risk
Risk of not being able to enter/exit trades at desired prices.
Occurs during off-market hours, holidays, or market shocks.
Interest Rate Risk
Changes in central bank policies affect currency values.
E.g., higher US interest rates can strengthen USD, impacting forex positions.
Counterparty Risk
Risk that your broker fails to honor transactions.
Mitigated by choosing regulated, reputable brokers.
Operational & Systemic Risk
Risks arising from technical failures, internet outages, or geopolitical events.
3. Core Principles of Forex Risk Management
Position Sizing
Determine trade size based on account size and risk tolerance.
Rule of thumb: Risk 1–2% of capital per trade.
Stop-Loss & Take-Profit Orders
Stop-loss: Automatically closes a losing trade to limit losses.
Take-profit: Secures gains at a predetermined level.
Risk-to-Reward Ratio (RRR)
Ensures potential reward exceeds risk.
Ideal: RRR ≥ 2:1 (risking $1 to make $2).
Diversification
Avoid over-concentration in a single currency pair.
Spread risk across major and minor pairs.
Leverage Control
High leverage can be tempting but increases drawdown risk.
Use only the leverage you can safely manage.
Hedging
Opening offsetting positions to minimize potential losses.
Example: Long EUR/USD and short GBP/USD if highly correlated.
Continuous Monitoring & Adaptation
Stay updated with economic news, central bank decisions, and geopolitical events.
Adjust risk management strategies according to market conditions.
4. Performance Analysis in Forex Trading
Performance analysis is essential to understand what works, what doesn’t, and why. Key metrics include:
4.1 Profitability Metrics
Net Profit: Total gains minus losses over a period.
Return on Investment (ROI): (Net Profit / Initial Capital) × 100.
Average Gain / Average Loss: Helps evaluate the effectiveness of winning vs. losing trades.
4.2 Risk Metrics
Maximum Drawdown (MDD): Largest peak-to-trough loss.
Volatility of Returns: Measures stability of profits. High volatility may indicate high risk.
Win Rate: Percentage of profitable trades. High win rate alone doesn’t guarantee profitability if risk-reward ratio is poor.
4.3 Efficiency Metrics
Profit Factor: Total gains / total losses. Profit factor > 1.5 indicates a robust strategy.
Sharpe Ratio: Risk-adjusted return; higher is better.
Expectancy: (Avg Win × Win Rate) – (Avg Loss × Loss Rate). Measures average expected profit per trade.
5. Tools & Techniques for Risk Management & Analysis
Trading Journals
Track every trade, including entry, exit, reason, outcome, and emotions.
Helps identify patterns and improve strategy.
Risk Management Software / Platforms
MetaTrader 4/5, TradingView, NinjaTrader offer risk calculators and performance dashboards.
Backtesting & Forward Testing
Simulate strategies using historical data to assess potential risks and returns.
Correlation Analysis
Analyze how currency pairs move relative to each other to avoid concentrated risk.
Volatility Indicators
ATR (Average True Range), Bollinger Bands, and VIX (for global risk sentiment) help gauge risk levels.
6. Practical Example of Risk Management
Assume:
Account size = $10,000
Risk per trade = 2% ($200)
EUR/USD trade: entry = 1.1000, stop-loss = 1.0950 (50 pips)
Position size calculation:
Risk per pip = $200 ÷ 50 pips = $4 per pip
This ensures the maximum loss on this trade is $200.
Performance tracking:
Track trade outcome: win or loss, pips gained/lost, and account impact.
Use cumulative metrics to assess overall strategy effectiveness.
Psychological Risk Management
Trader Psychology impacts risk management. Common pitfalls:
Overtrading due to greed or fear
Ignoring stop-loss orders
Revenge trading after losses
Mitigation Strategies:
Predefined trading plan
Journaling emotions along with trades
Stick to fixed risk % per trade
Conclusion
Effective risk management and performance analysis in forex trading are inseparable:
Risk management protects your capital and ensures survivability in volatile markets.
Performance analysis provides insights to optimize strategies, reduce unnecessary losses, and improve profitability.
A disciplined trader always combines position sizing, stop-losses, leverage control, and data-driven performance tracking. Without these, even the best strategies can fail due to poor risk management.

QQQ Sep 23 – Bulls in Control, Eyeing 605–608 Zone Price Action & Setup (1-Hour Chart)
QQQ has been in a clean uptrend since mid-last week, now consolidating near 602 after a strong run. The chart shows a rising channel with immediate support at 600 and stronger demand near 596. As long as QQQ holds above 600 on hourly closes, the structure favors a grind higher toward 605 and 608.
Momentum Read
MACD remains positive though histogram bars are starting to flatten, hinting at short-term cooling. Stoch RSI is still elevated near 80+, suggesting a brief pause or sideways action before the next push.
GEX (Options Flow) Confluence
Options positioning is bullish and supportive:
* Highest positive GEX / Call resistance: around 604–605
* 2nd Call Wall: around 602 with 92% call concentration (now acting as support)
* Next Call Wall: near 608
* Key Put Support: around 596
A steady bid above 602 forces market makers to hedge higher, which can drive QQQ into the 605–608 range.
Trading Plan
* Upside continuation: Go long on a confirmed close above 602.8 with target 605–608. Stop under 600.
* Dip buy: If QQQ retests 600 or 596 and holds with volume, that’s a favorable reload zone.
* Bearish scalp: Only if 596 breaks hard, with potential quick drop toward 590.
Option Angle
Short-dated calls in the 605–608 strike range look solid if 602 support keeps holding. For hedges, puts around 596 are worth watching if breakdown confirms.
Bottom Line
Trend stays bullish above 600. A breakout through 602.8–605 can accelerate momentum to 608. Failure to hold 596 would be the first caution signal for bulls.
Disclaimer: This is for educational discussion only and not financial advice. Always do your own research and manage risk.

QQQ "Catch-up" Potential for Bullish ContinuationThis chart is a strong cup & handle breakout, pending confirmation above $600
If confirmed then target $633-$646
1. The double top (bearish) is only valid if price fails $600 & reverses sharply
2. Healthy bull trend with consolidation at resistance
Ascending triangle is tightening under $600, ready for breakout
Cup & handle is a longer-term bullish continuation pattern
The chart is shifting from a topping risk into a potential breakout setup, but $600 must prove itself; either, as a ceiling (rejection) or a launchpad (breakout)
The cup & handle is the more dominant pattern because the handle was shallow & orderly & price is retesting the neckline directly instead of rolling over, but the double top risk only disappears if QQQ decisively clears $600 with volume
Above $600 with strength = breakout
Rejection under $600 with bearish candles = double top still alive
Neutral small candles = consolidation, wait for direction
The candles suggest bullish consolidation under resistance
If NVDA joins, it could be the catalyst to print the breakout candle above $600
Why NVDA isn’t leading today?
Regulatory uncertainty/negative news spillover (from China restrictions) is creating hesitation among investors (future headwinds weigh on sentiment)
NVDA has had a very strong run recently so some traders are likely booking profits or rotating into other names perceived to have higher recent upside or less regulatory risk
Lower volume suggests weaker conviction among buyers
NVDA seems to be bumping up against resistance or nearing levels where sellers are more active so without a catalyst (positive news or breakout), it may just drift until something shifts
Also, since other tech/AI/semiconductor names may have more “catch-up” potential, capital might be rotating out of NVDA into them
Huge Dark Pools and Prints... Will this time be Different?Stock Market Forecast | Mag 7 TSLA NVDA AAPL AMZN
QQQ CME_MINI:NQ1! CME_MINI:ES1! SP:SPX NASDAQ:NDX stock market Forecast
