QQQ : Stay heavy on positions (QLD, TQQQ)- System metrics show the market transitioning into the initial phase of overheating.
In stay light on positions zones, I hold QQQ and reduce exposure.
In stay heavy on positions zones, I increase allocation using a mix of QLD and TQQQ.
** This analysis is based solely on the quantification of crowd psychology.
It does not incorporate price action, trading volume, or macroeconomic indicators.
QQQ trade ideas
QQQ Short – Targeting 2%The Nasdaq-100 (QQQ) has shown strong upside momentum recently, but appears technically overextended on the daily chart. After multiple consecutive green sessions and stretched RSI levels, there is a rising probability of a short-term pullback.
With limited economic data this Friday and potential profit-taking ahead of the weekend, we could see a “Red Friday” scenario. A 2% retracement would bring QQQ closer to near-term support levels, offering a favorable risk-reward for a short setup.
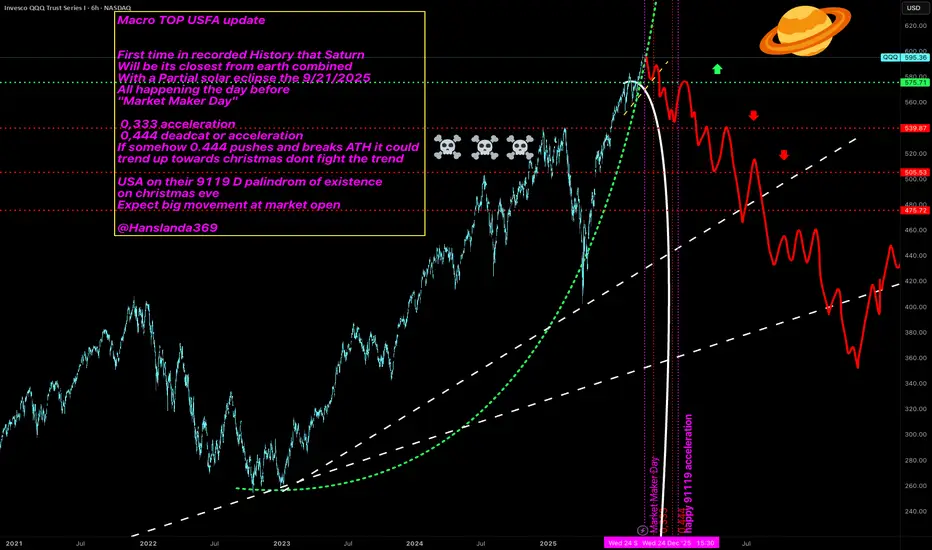
Macro TOP USFA Update
First time in recorded History that Saturn
Will be its closest from earth combined
With a Partial solar eclipse the 9/21/2025
All happening the day before
"Market Maker Day"
0,333 acceleration
0,444 deadcat or acceleration
If somehow 0.444 pushes and breaks ATH it could
trend up towards christmas dont fight the trend
USA on their 9119 D palindrom of existence
on christmas eve
Expect big movement at market open
@Hanslanda369
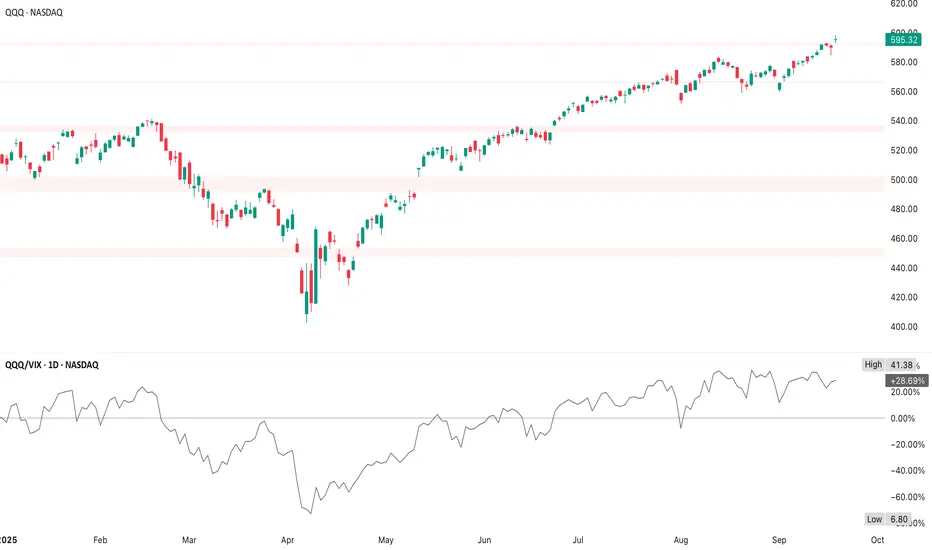
QQQ QQQ/VIX Peaks vs QQQ TopsThis ratio rises when QQQ strengthens & volatility (VIX) declines, a classic risk-on signal
The higher the ratio, the more “complacency” builds - extremes here often precede corrections
Both QQQ & QQQ/VIX are at/near highs, which confirms bullish sentiment, but also shows that positioning is crowded
If QQQ keeps pushing higher, but QQQ/VIX fails to confirm (flat or declining), that’s often an early warning of exhaustion
Any sudden VIX spike (geo, macro, Fed) would drag this ratio down fast & pressure QQQ
QQQ/VIX this elevated often means traders are too comfortable
Pullbacks tend to emerge from such levels
If VIX jumps, ratio collapses
Historically, that coincides with sharp QQQ corrections
With QQQ at ~$600 & QQQ/VIX stretched, market may need a consolidation or correction before higher
1. Late January / Early February 2025
QQQ/VIX peaked near 41
QQQ topped just above $580 before rolling into a multi-week correction
2. Mid-April 2025
QQQ/VIX sharp rebound high (mid-30s)
QQQ short-lived bounce before a deeper dip into May
3. Now (Mid-September 2025)
QQQ/VIX at ~38, near prior extremes
QQQ at $595, pressing resistance around $600
Every major QQQ pullback since late 2024 coincided with QQQ/VIX spiking near 35–40
Peaks in the ratio tend to lead or align with local QQQ tops
Once the ratio rolls over, QQQ usually corrects or at least consolidates
QQQ/VIX is once again in the upper 30s
Unless the ratio makes a decisive breakout beyond prior extremes (sustaining >40), history suggests odds of a near-term pullback are elevated
Watch closely for a stall or rollover in QQQ/VIX (early warning), a VIX spike (usually the trigger), or QQQ struggling with $600 resistance
QQQ Topping SetupBuyers are facing strong resistance & today's trading is a warning sign of exhaustion, not yet a decisive reversal, but the setup leans bearish unless bulls break out cleanly above $598 - risk leans toward a pullback
RSI/Stoch show overbought, flashing risk of pullback
MACD is still bullish, but losing strength
Today's gap up rejection confirms sellers are active at resistance
This paints a picture of a topping setup unless neckline holds strong
The gap up was a bull trap where buyers pushed early, but sellers overwhelmed
Today’s candle acts as the confirmation signal of a double top (shooting star/bearish engulfing), is a textbook bearish signal at Top 2, which suggests bulls are losing steam & bears are pressing harder
This creates a bearish gap + reversal setup
1. Bearish Signals
Shooting star (small body, long upper wick), rejection of higher prices
Bearish engulfing (large red candle fully covers prior green), sellers taking control
Doji at highs (indecision), often precedes reversal when overbought
Evening star (3 candles & strong green, then doji, then strong red), top formation
These confirm the double top pattern if paired with rejection volume
2. Bullish Continuation
Hammer (small body, long lower wick), buyers defending support
Bullish engulfing (large green candle covers prior red), buyers back in control
Morning star (3 candles, strong red, then doji, then strong green), bullish reversal at support
Marubozu green (full-bodied bullish candle, no upper/lower wick), conviction from buyers
These suggest the neckline is holding & an ascending triangle breakout is possible
At Top ($598), watch for rejection candles & at neckline ($556-$564), watch for defense candles (hammer, engulfing, morning star)
Confirmation comes not from just one candle, but the follow-through
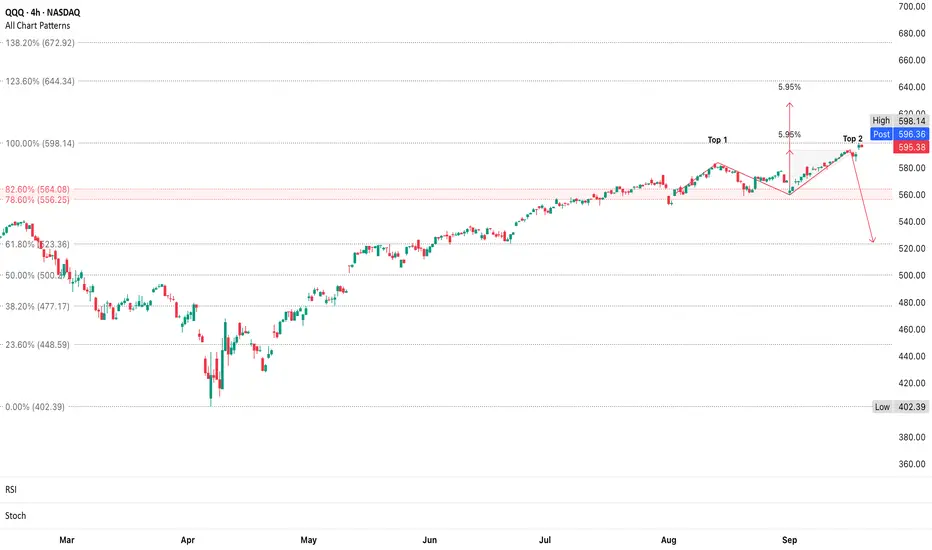
QQQ Battle at the TopStrong uptrend from April to September (higher highs & higher lows), but market is hesitating with indecision candles at resistance
1. Bullish
Clean breakout & close above ~$593 with follow-through
$637.81 (123.6% Fib) to $665.62 (138.2% Fib)
Needs strong green candles or a bullish gap above resistance
Support at $552–$559 (78.6%-82.6% Fib)
2. Bearish
Rejection at current highs (~$593), followed by consecutive red candles
$552–$559 (major support cluster, 78.6%-82.6% Fib)
$520.10 (61.8% Fib, critical trend support)
Risk of deeper correction to $497.63 (50% Fib)
Confirmation seen in long upper wicks, bearish engulfing, or heavy selling volume near ~$593
Watch candlestick formations here - next few candles will decide direction
Recent candles near $592 are small-bodied candles with upper wicks which suggests indecision/possible exhaustion at resistance
If QQQ stalls at this level & pulls back, it could form a double top around $593 (bearish if neckline at $559 breaks)
If it consolidates sideways above $552–$559 & then breaks out, it could form a bullish continuation pattern (ascending triangle)
No major reversal pattern yet, but watch closely for confirmation
Bearish engulfing or shooting star near $593 is bearish signal
Breakaway gap above $593 is bullish confirmation
Double top ($588–$593) shows multiple doji & shooting star candles which signals indecision + rejection pressure
If bearish patterns (doji/shooting star/bearish engulfing) dominate near $593, it indicates a likely reversal or pullback
If price pulls back to $552–$559 & prints bullish engulfing/long lower wick, this is a strong buy-the-dip signal
Bullish engulfing candles showed up earlier in August, helping the rally continue
Support at $552–$559 is a key level where buyers may defend (base of possible ascending triangle)
If neckline holds, it could be an Ascending Triangle & breakout above $593 points to $637+

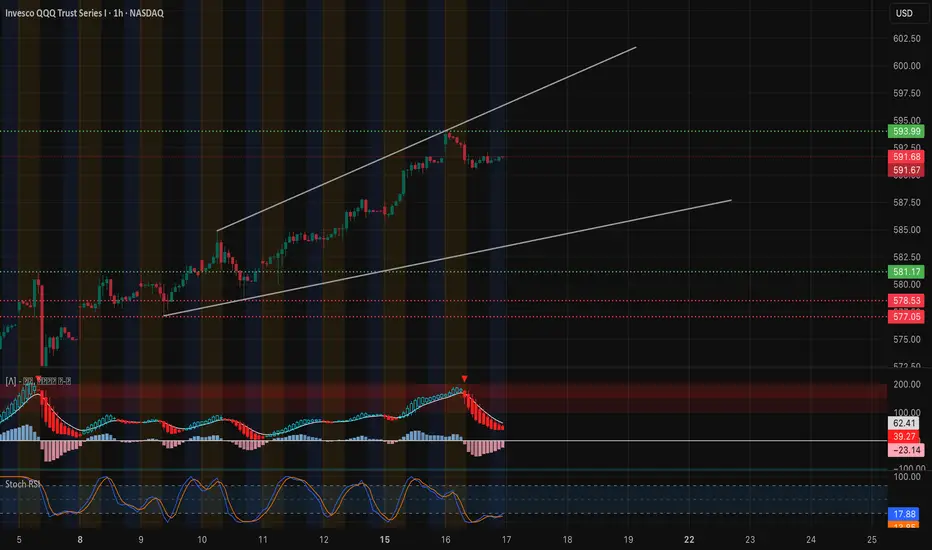
QQQ: Holding 590 Channel Support–Swing & Scalp Setups for Sep 171-Hour Chart Technical View
QQQ’s 1-hour chart shows a steady uptrend within a rising channel. After a strong run from mid-week lows, price is consolidating near $591. MACD has cooled from earlier highs and Stoch RSI is in oversold territory, suggesting a pause rather than a reversal.
* Immediate Support: $590 (short-term breakout level)
* Major Support: $583 and $577 (key demand zones)
* Upside Zone: $594–$598 is the next resistance cluster; a breakout could carry to $600
The 9 EMA remains above the 21 EMA, supporting the current bullish bias as long as $590 holds.
GEX & Options Flow
Options positioning offers balanced but supportive cues:
* Call Walls: $594 (highest positive NET GEX / gamma resistance), $596, and $598.
* Put Walls: $583 and $575 (biggest downside defenses).
* GEX Bias: About 49.5% call exposure with IVR at 16.2 (IVx ~19.8). This shows healthy, moderate option interest with no sign of panic pricing.
Dealers remain positioned to hedge dips, favoring a controlled upward drift.
Trade Thoughts & Suggestions
* Swing Idea: Accumulate near $590 with a stop below $586, aiming for $594–$598 and a stretch to $600.
* Scalp Idea: Quick bounce plays off $590 or a breakout scalp if $594 is taken out with strong volume.
* Bearish Scenario: A decisive break under $586 could open $583 and $577 as targets.
Quick Take
QQQ is in a healthy consolidation inside a rising channel. For Sept 17, holding $590 keeps the door open for a move toward $594–$600.
Disclaimer: This analysis is for educational purposes only and does not constitute financial advice. Always do your own research and manage risk before trading.
QQQ - Todays Support and Resistance LinesHey Followers,
Here are the support and resistance lines for Sep 16th, 2025, only valid till the end of the day.
If the price comes from the bottom towards a line, then the line becomes a resistance line.
If the price comes from the top towards a line, then it becomes the support line.
I use 2min and 5min to trade these lines on 0dte options.

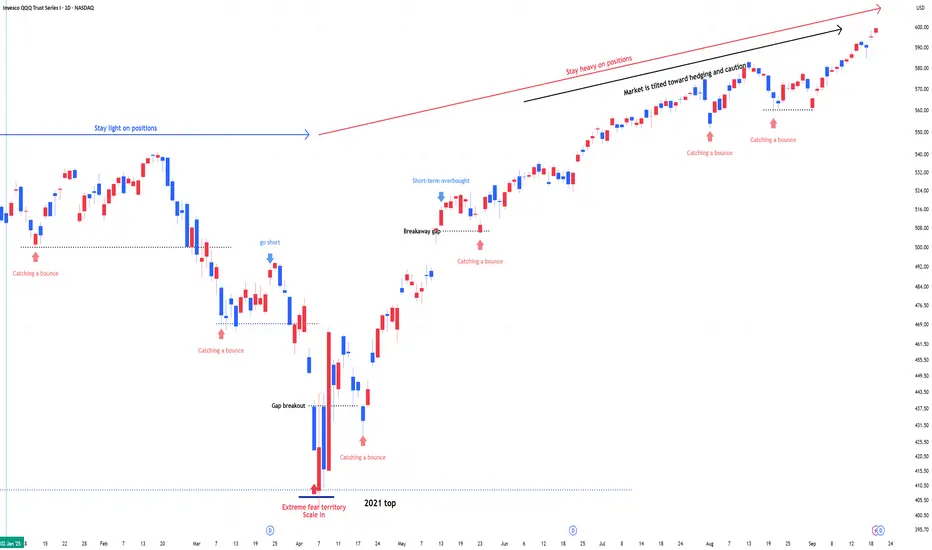
QQQ : Stay heavy on positionsQQQ : Stay heavy on positions (QLD, TQQQ)
- Market slowly shifting from sidelines to risk-on.
In stay light on positions zones, I hold QQQ and reduce exposure.
In stay heavy on positions zones, I increase allocation using a mix of QLD and TQQQ.
** This analysis is based solely on the quantification of crowd psychology.
It does not incorporate price action, trading volume, or macroeconomic indicators.

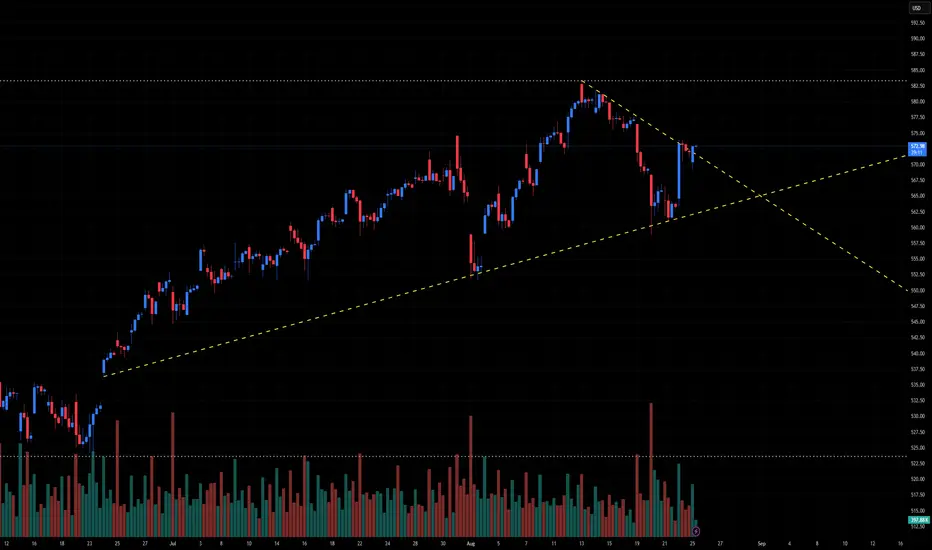
QQQ Technical Outlook – Symmetrical Triangle After Pullback📊 QQQ Technical Outlook – Symmetrical Triangle After Pullback
Ticker: QQQ (Invesco Nasdaq-100 ETF)
Timeframe: 30-minute candles
🔍 Current Setup
QQQ has been in a strong uptrend since June, peaking around ~582 before pulling back. Price is now consolidating into a symmetrical triangle, with:
Descending resistance: from ~582 down toward current ~572.
Ascending support: from June lows, now near 563–565.
Current price: ~572, sitting right near the apex.
This structure suggests compression ahead of a breakout move.
📊 Breakout Levels
🚀 Upside (Bullish Scenario)
Trigger: Break and close above 575–577.
Intermediate Targets:
582–585 → Prior highs.
590 → Extension zone.
Measured Move Target: ~600 (triangle height projection).
🔻 Downside (Bearish Scenario)
Trigger: Break below 565, with confirmation under 563.
Intermediate Supports:
555–552 → First demand zone.
540–542 → Stronger support.
Measured Move Target: ~545 (triangle height projection downward).
📈 Volume Analysis
Volume has contracted during this triangle — classic consolidation behavior.
Expect a volume expansion to confirm the breakout direction.
⚖️ Probability Bias
The trend into the pattern was bullish, favoring continuation higher.
Still, failure to defend 565 could quickly open downside risk toward 552–545.
✅ Takeaway
QQQ is at a major decision point inside a symmetrical triangle:
Bullish Break > 577: Targets 582 → 590 → 600
Bearish Break < 565: Targets 555 → 545
QQQ BUY OPPORTUNITYQQQ breaks out of weekly ascending triangle with strong bullish momentum. Eyes on 700 as AI and cloud adoption accelerate.

QQQ Will Collapse! SELL!
My dear friends,
My technical analysis for QQQ is below:
The market is trading on 586.66 pivot level.
Bias - Bearish
Technical Indicators: Both Super Trend & Pivot HL indicate a highly probable Bearish continuation.
Target - 578.49
About Used Indicators:
A pivot point is a technical analysis indicator, or calculations, used to determine the overall trend of the market over different time frames.
Disclosure: I am part of Trade Nation's Influencer program and receive a monthly fee for using their TradingView charts in my analysis.
———————————
WISH YOU ALL LUCK

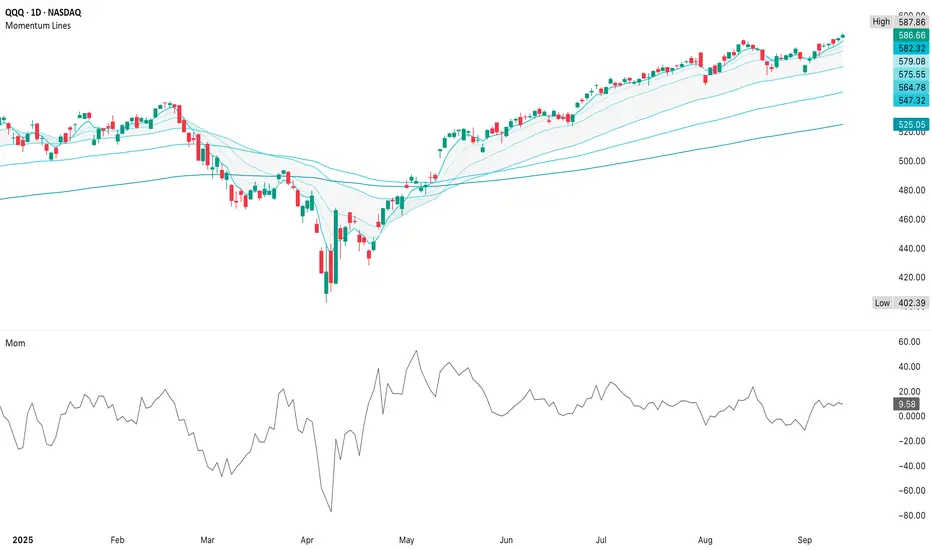
QQQ Bullish ContinuationThe chart favors continuation higher with risk of a small dip, not a breakdown
QQQ is pressing into $587–$588, right near highs
Price is holding above all key momentum averages (stacked bullishly)
Momentum Indicator at +9.6, which is positive, but not strongly accelerating
Momentum peaked in early summer, but instead of breaking down, it’s grinding sideways & consistent with a “slow grind higher” market
No bearish divergence since price makes higher highs, momentum holding steady
Since QQQ is grinding up at highs with supportive momentum
Buy $590C/Sell $600C (Sept 27 expiry) - cheap defined-risk spread, profit if QQQ pushes another 2% higher
Cost basis should be reasonable since implied volatility isn’t spiking
Call spreads near $590–$600 with a small put spread hedge is the cleanest way to play
This combo is essentially a directional strangle using defined-risk spreads
QQQ (12 September)QQQ ($586.66) is pressing against the upper +/-3% envelope band (~$591)
Overbought relative to the 20d SMA, often an area where price pauses or pulls back
The MA at $574.33 acts as mean reversion support
The lower envelope ($557) would be the deeper support if selling picks up
Fade moves at the outer bands (sell near +3%, buy near -3%) or trade trend continuation if price closes & holds above the +3% envelope
Since early September, each pullback bottomed higher, confirming an uptrend continuation
Last few candles are mostly green with higher closes, showing buyers are in control
Current candle is a strong green pushing into the upper envelope band (+3%), which shows momentum & demand
Recent candles have short upper wicks, meaning buyers closed near the highs, which is bullish
QQQ broke out from a sideways consolidation (around $570–$580) & is now trending higher
No bearish reversal signals - no shooting stars, bearish engulfings, or dojis near the highs
If QQQ closes strong above the envelope, momentum breakout, bullish continuation
Price is extended into the +3% envelope, which historically acts as resistance or a mean reversion point
If next week’s candles print a long upper wick (rejection) or a red engulfing candle, that could signal short-term exhaustion
Watch for reversal signals at this extended level; otherwise, trend is intact to the upside
If QQQ prints a shooting star or bearish engulfing, likely short-term pullback toward the moving average ($574)
If these appear, it means the uptrend is likely to continue higher,
1. Bullish Marubozu (long green candle with no or tiny wicks
Shows buyers in full control, often signals strong follow-through
2. Bullish Engulfing
A green candle that completely engulfs the body of the previous red candle
Strong buying reversal signal after a dip
3. Three White Soldiers
Three consecutive green candles, each opening higher than the last
Very strong trend continuation signal
4. Gap up & hold
Next day opens above the prior high & holds
Momentum traders often chase this pattern
If these appear near the envelope top, caution is warranted,
1. Shooting Star
Small body, long upper wick, closes near the low
Shows buyers pushed up, but sellers took back control
2. Bearish Engulfing
A big red candle that fully engulfs the prior green candle
Signals shift from buyers to sellers
3. Evening Star
Three candles strong green - indecision (doji/small body) - strong red
Very reliable top-reversal signal
4. Gravestone Doji
Open, high & close all at the same level (long upper wick)
Clear rejection of higher prices
QQQ: Weak Market & Bearish Forecast
Balance of buyers and sellers on the QQQ pair, that is best felt when all the timeframes are analyzed properly is shifting in favor of the sellers, therefore is it only natural that we go short on the pair.
Disclosure: I am part of Trade Nation's Influencer program and receive a monthly fee for using their TradingView charts in my analysis.
❤️ Please, support our work with like & comment! ❤️
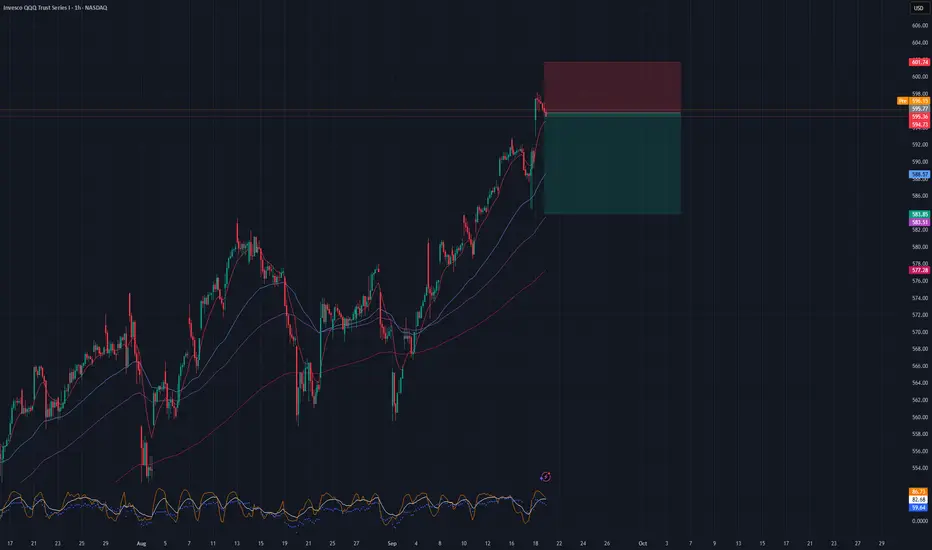
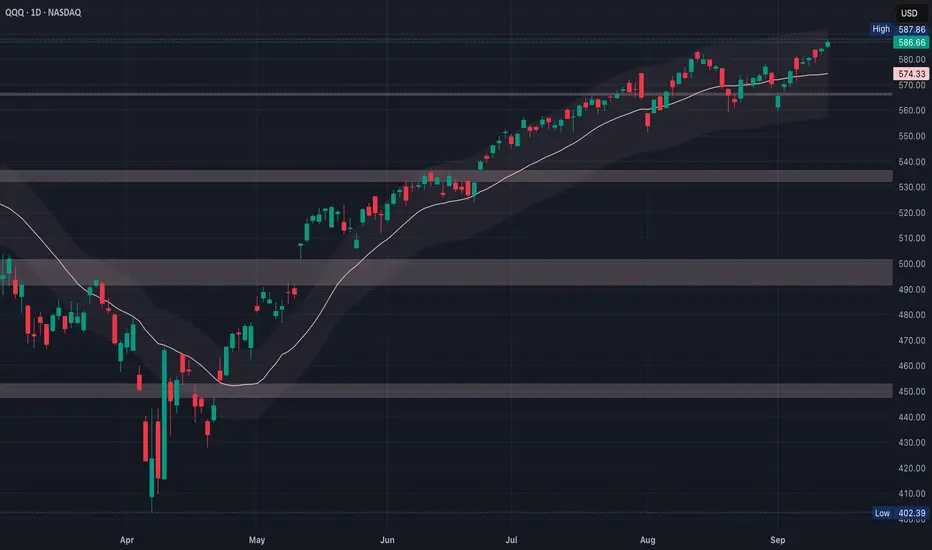
QQQ Market Context – Where We StandQQQ has been grinding higher and is now pressing into a major resistance cluster at $590–$595. This is not just a random line in the sand — it’s a confluence of long-term channel resistance (weekly chart red lines) and short-term supply zones (15m chart).
Whenever price tests a heavy resistance cluster like this, the risk/reward equation shifts: upside potential shrinks while downside risk expands. That doesn’t mean the uptrend is broken, but it does mean chasing longs up here is dangerous. Smart money tends to lighten up at resistance and reload lower. Weekly structure: QQQ is still in a broad uptrend channel. Pullbacks into green support lines have consistently been bought.
Trading Scenarios
🔴 Bearish Reversal (High-Probability Play)
Look for QQQ to stall between $590–$595. Watch for reversal patterns (double tops, bearish engulfing, lower highs on 15m).
Shorts here offer defined risk/reward: Stops just above $600, downside targets at $580 → $574.

Opening (IRA): QQQ Oct 17th -538P... for a 6.85 credit.
Comments: Selling the 25 delta strike here on weakness.
Metrics:
Buying Power Effect: 531.15
Max Profit: 6.85 ($685)
ROC at Max: 1.29%
50% Max: 3.43 ($343)
ROC at 50% Max: .65%

QQQ : Stay heavy on positions (QLD, TQQQ)QQQ : Stay heavy on positions
In stay light on positions zones, I hold QQQ and reduce exposure.
In stay heavy on positions zones, I increase allocation using a mix of QLD and TQQQ.
** This analysis is based solely on the quantification of crowd psychology.
It does not incorporate price action, trading volume, or macroeconomic indicators.
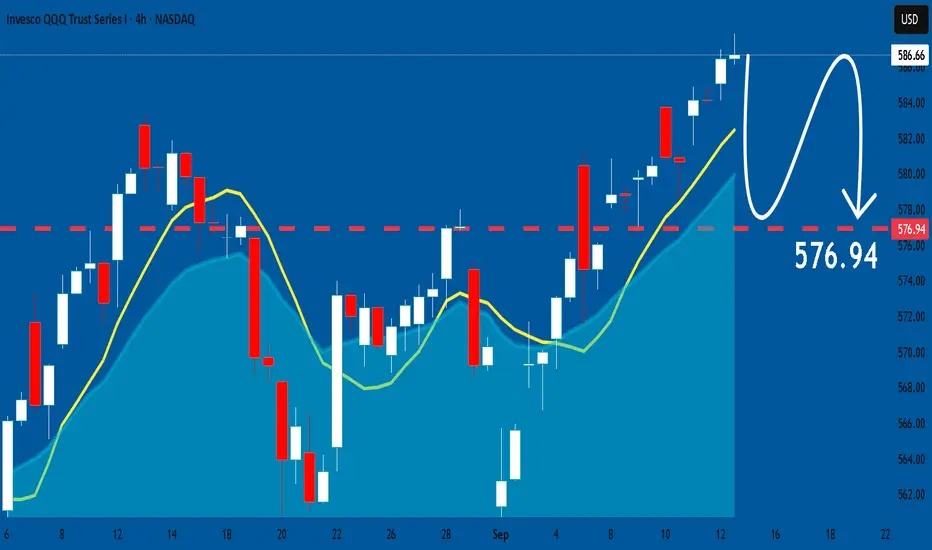
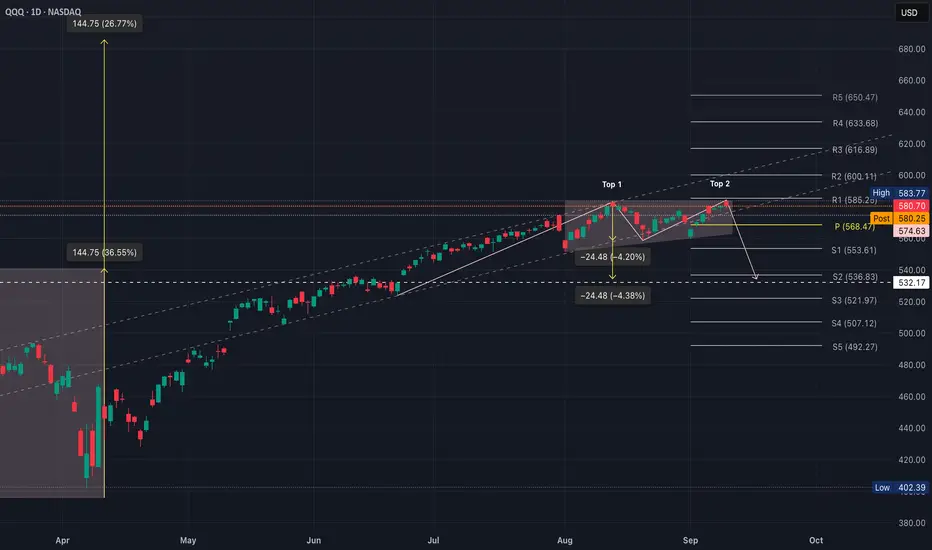
QQQ Breakout vs BreakdownQQQ is flashing both a potential double top & a rising wedge, which are closely related bearish setups
1. Double Top (Top 1 & Top 2 around $583)
Price hits the same high twice, fails to break through, then rolls over
Not confirmed until QQQ closes below the “neckline” ($574–$575)
If confirmed, projected drop is the height of the pattern (~24 pts) for a target of $560
2. Rising Wedge
Higher highs + higher lows, but slope is narrowing
QQQ’s recent grind into $583 fits this pattern since momentum is slowing as buyers lose control
Rising wedges tend to break down ~70% of the time, especially near major resistance
Break below the wedge lower bound ($574–$575) would align with the double top neckline break
Bull vs Bear Scenarios
If QQQ breaks above $586–$587 with volume, it invalidates both bearish patterns
That would trigger continuation to $600
Close below $574–$575 neckline confirms the double top & wedge breakdown
Right now QQQ is “coiled” in a rising wedge into resistance with a double top risk
Bulls must clear $586+ to avoid the trap
Bears gain control if $574 fails, unlocking gap-fill downside
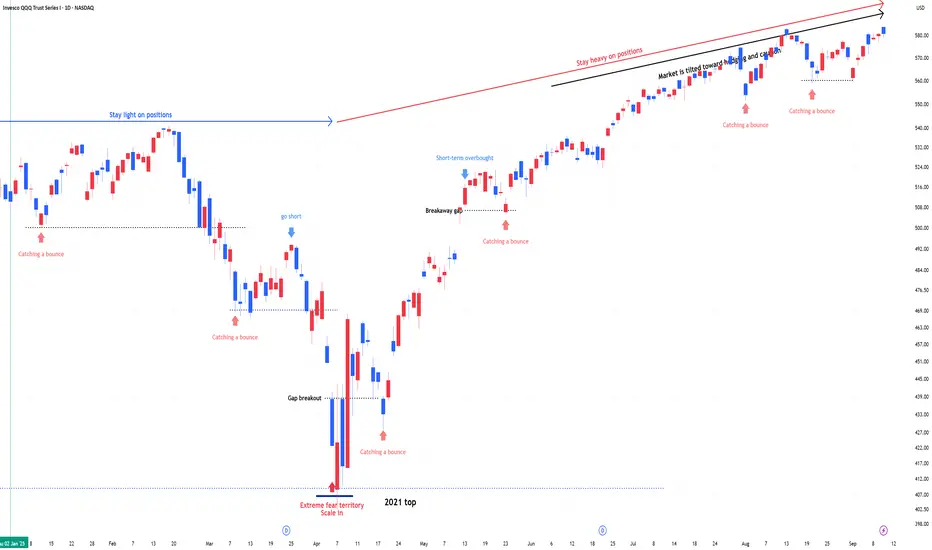
QQQ Grind-Up, Not Power-UpA gap occurs when the price opens significantly higher or lower than the prior close, leaving an empty space on the chart
1. Common Gap
Small, often within a range
Usually filled quickly (price comes back to close the gap)
2. Breakaway Gap
Happens at the start of a new trend (up or down)
Price usually does not fill quickly because it’s breaking out of a consolidation zone
3. Runaway / Continuation Gap
Occurs in the middle of a strong trend
Reinforces momentum, shows buyers/sellers rushing in
4. Exhaustion Gap
Appears near the end of a move
Often followed by reversal once the last buyers/sellers have entered
Many gaps get “filled” (price trades back through the open-close range)
Notice the jump candles where price leaps higher without overlapping prior highs
Those are mini-breakaway gaps on smaller timeframes
Larger daily gaps (from overnight futures) show up around major inflection points (~$540 or ~$500 in past months) often get retested
Gap up into resistance - fade (short-term sell bias)
Gap up out of consolidation - trend continuation
Gap down into support - bounce potential
Gap down breaking major support - momentum short
A big distance between prior close and next open (think 2%+ in QQQ, which is large for an index ETF) suggests a strong imbalance between buyers/sellers (news, macro shock, earnings, Fed, etc) & are often trend-driving (market re-prices & continues in that direction - breakaway or exhaustion)
Traders treat wide gaps as structural levels (price can revisit them weeks/months later)
The big shaded area in April/May around $450–$500 are wide gaps that anchor market structure
Small difference between close & next open (<1% in QQQ) are common gaps that occur more often & tend to get filled quickly (1–5 sessions)
Momentum traders don’t put much weight on them since they’re more noise than regime change
The small shaded areas around $560–$565 are narrow gaps which often act like magnets for price (easy “gap-fill” trades)
1. Wide Gaps are macro anchor levels
They define “areas of importance” where institutions re-priced risk
If price revisits then expect strong reaction (support or resistance)
The wider gaps ($540s, $500s) are less likely to fill immediately, but if momentum cracks, they’re where the market would re-price
2. Narrow Gaps are short-term magnets
They get filled often and quickly.
More useful for tactical swing or intraday trading
The narrow gap at $560–$565 suggests that if bulls fail at $580, this is the first “magnet” downside target
QQQ grinding against ATHs while narrow gaps remain unfilled shows momentum strength
Market is ignoring short-term inefficiencies because buyers are in control
If $580–$581 rejection holds, sellers will target the nearest narrow gaps first ($560–$565)
Only if weakness compounds do we start eyeing the wider gaps lower ($540s to the $500s)
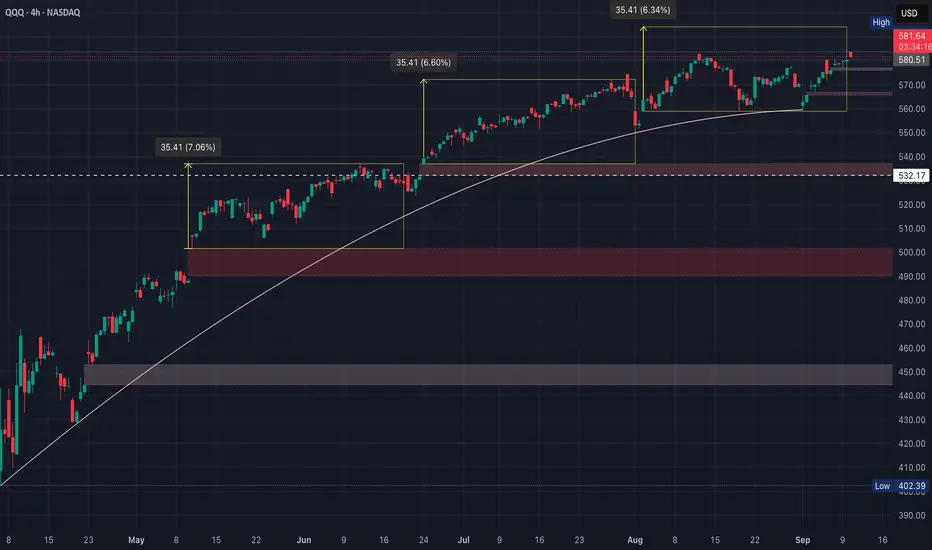
The curved trend line is the line in the sand
Above = momentum grind
Below = unwind toward gap fills
This symmetry is powerful since markets often move in measured waves
If history repeats, the next breakout could target another +35 pts from the last base ($560–$565)
That projects into $595–$600, aligning with psychological round-number resistance
Equal legs can also signal a completed measured move
If momentum fails at $580–$581, this may be a double top, meaning trend is stretched
In that case, downside would first target gap at $560–$565 & possibly the $532 wide gap if the trend breaks
QQQ has rallied in 2 near-perfect measured moves of ~35 pts
A third move could carry it to $595–$600, but failing here suggests exhaustion
The trend + gaps below tell us exactly where risk opens if $580 rejection plays out
1. March–May (early rally leg)
Strong expansion in volume on the breakout from the base
Classic sign of institutional accumulation
2. June–July (second impulse leg)
Price kept making higher highs, but volume gradually tapered off
That’s a hallmark of momentum continuation without fresh conviction
It doesn’t kill the trend, but it does mean rallies are carried more by buyers stepping in on dips; rather than, aggressive new buying
3. August–September (near ATHs)
Volume remains muted during the grind into $580–$581 resistance
Price has lifted, but not on strong participation
Suggests buyers are cautious & sellers haven’t pressed yet either ( a “low energy” standoff )
R ising price + rising volume = strong trend
Rising price + falling volume = weak trend (risk of stall)
Falling price + rising volume = strong distribution
Falling price + falling volume = normal pullback (trend intact)
The grind into $580 looks more like rising price + flat/weak volume
That tilts toward caution - bulls need a volume expansion to confirm breakout; otherwise, the market risks a “measured move exhaustion” & reverts to filling nearby gaps
The first leg (April–May) with big green volume spikes shows strong conviction, but the second leg (June–July) shows price rose on lighter, declining volume, continuation, but less conviction, while the current leg (August–September) shows muted volume while pressing ATHs
This is rising price + flat/weak volume, a classic “grind-up” pattern
It works until it doesn’t - meaning breakouts need fresh volume expansion to hold
QQQ’s last two impulse legs were ~35 pts - the current one is tracing the same path
Volume, however, is lighter than on the first rally (momentum continuation, but less conviction)
Breakout needs volume confirmation; otherwise, expect symmetry to mark exhaustion & pullback toward gaps
RSI pushed into overbought (70+) multiple times
RSI is trending upward again, but still below prior peaks (~65 vs 70+)
Shows positive momentum, but not full-strength
RSI holding above 50 is bullish, but failure to reach overbought on a breakout attempt would be a warning of exhaustion
Volume is muted & RSI is rising, but not overbought yet
It means the breakout is vulnerable without a volume surge & RSI follow-through
RSI confirms buyers are pushing, but momentum is weaker than in the first impulse
Breakout with RSI >70 is fuel to $595–$600; breakout with RSI divergence is likely a bull trap
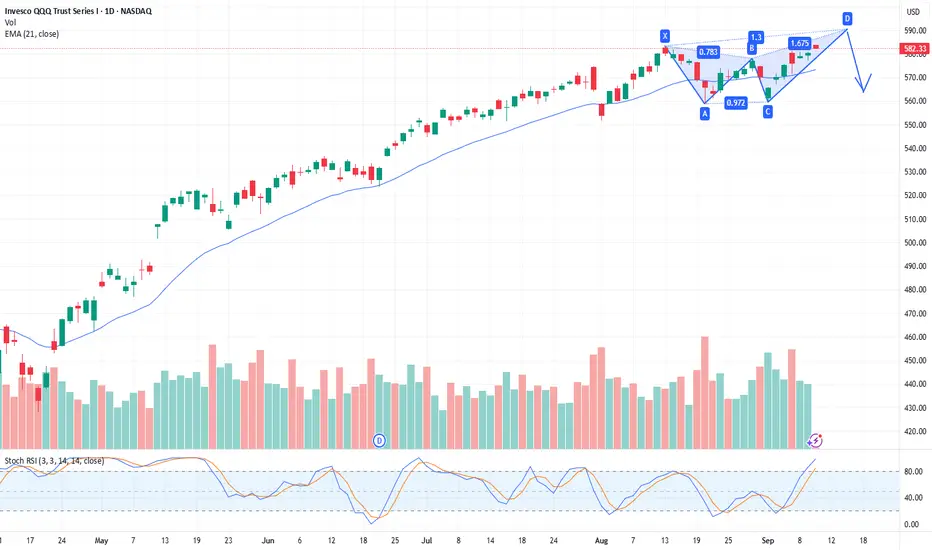
QQQ: Bearish Butterfly Harmonic pattern formingIf this bearish butterfly Harmonic pattern is going to play out, QQQ has 590-593 to complete the pattern, then down from there.
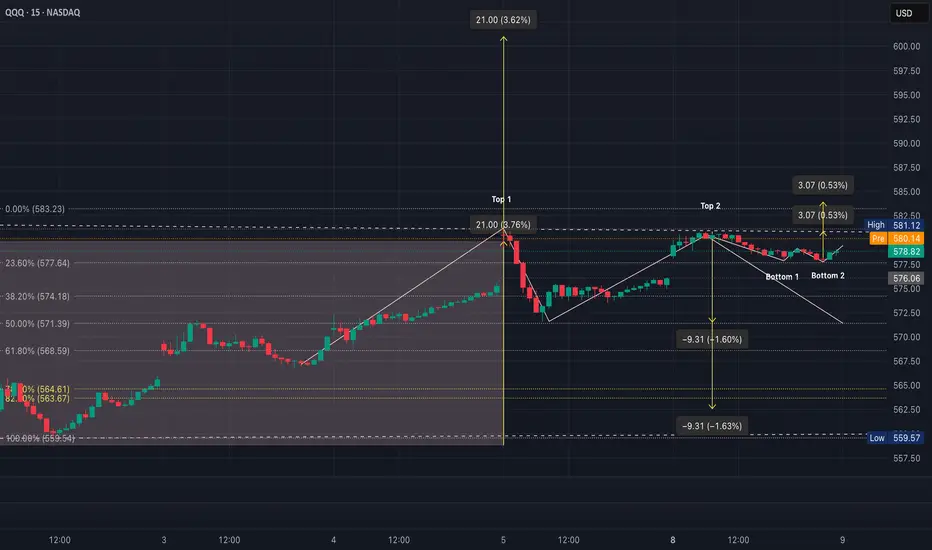
QQQ Levels in PlayQQQ is coiling between $577–$583
$583.2 (Top 1/Fib 0%) is major resistance
$581 (Top 1/recent high) is lower high rejection
$578–$579 (current) sits just above Fib 23.6% (~$577)
~$571 (Fib 50%) is mid-support
~$568 (Fib 61.8%) is a critical downside pivot
$564–$563 (Fib 78.6%–82.6%) is a possible deep retrace
In short,
Above $583 = breakout
Below $572 = breakdown
Between = chop trap
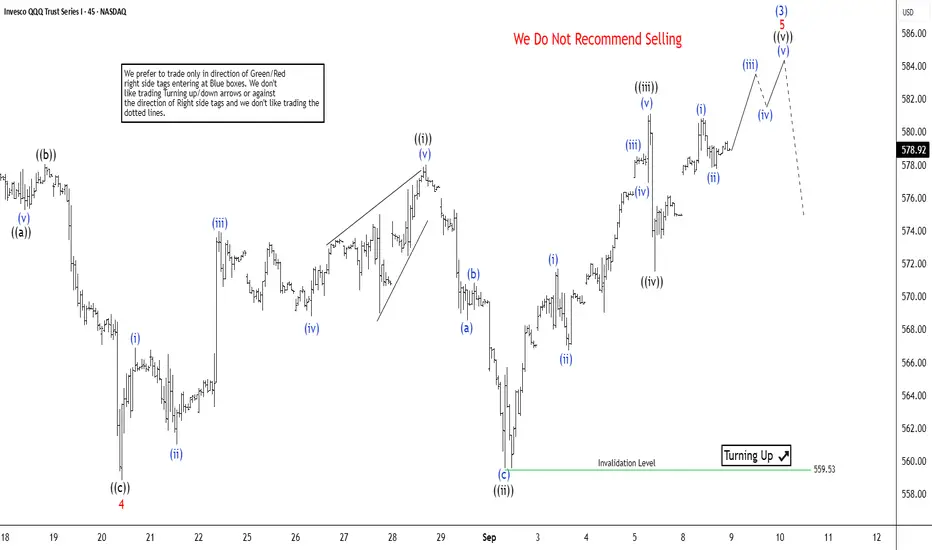
QQQ Nearing wave (3) Termination at 589The short-term Elliott Wave analysis for the Nasdaq 100 Index ETF (QQQ) indicates it is approaching the completion of wave (3) from its April 2025 low. This wave (3) unfolds as a five-wave impulse structure. Wave 1 concluded at 467.83, followed by a wave 2 pullback to 427.93. Subsequently, wave 3 surged to 583.32, and wave 4 retraced to 558.84, as illustrated in the 45-minute chart.
Currently, wave 5 is developing as a diagonal pattern. From the wave 4 low, wave ((i)) peaked at 578, with wave ((ii)) dipping to 559.53. Wave ((iii)) then climbed to 581.12, followed by a wave ((iv)) pullback to 571.53. As long as the ETF remains above 559.53, it is poised to extend higher in wave ((v)) of 5, which should also finalize wave (3) on a higher degree. The potential target for wave 5 lies between 589 and 598, calculated using the 123.6% to 161.8% inverse Fibonacci retracement of wave 4.
This analysis suggests a bullish near-term outlook for QQQ, with the ETF likely to reach the projected range before completing wave (3). Traders should monitor the 559.53 support level to confirm the continuation of this upward move. The structure remains intact, supporting further gains in the short term.