SMH ETF Power Move Incoming – ATR Confirms Bullish Momentum!🎯 SMH Semiconductor Heist: Bulls Loading Up! 💎🚀
📊 Asset Analysis
VanEck Semiconductor ETF (SMH) - The chip sector's flagship ETF is showing serious strength after bouncing off the ATR (Average True Range) support zone. Bulls are flexing their muscles, and momentum is building for an upside breakout
Key stats
About VanEck Semiconductor ETF
Home page
Inception date
May 5, 2000
Structure
Open-Ended Fund
Replication method
Physical
Dividend treatment
Distributes
Distribution tax treatment
Qualified dividends
Income tax type
Capital Gains
Max ST capital gains rate
39.60%
Max LT capital gains rate
20.00%
Primary advisor
Van Eck Associates Corp.
Distributor
Van Eck Securities Corp.
ISIN
US92189F6768
SMH is a highly concentrated fund that invests in common stocks and depositary receipts of US-listed semiconductor companies, similar to our benchmark. Midcap companies and foreign companies listed in the US can also be included. To be initially eligible, 50% of company revenues must be primarily in the production of semiconductors and semiconductor equipment. The top 50 eligible companies by market cap are then given two separate ranks based on free-float market capitalization in descending order and three-month average-daily-trading volume in descending order. Those two ranks are summed and the highest ranked 25 companies are selected. A capping scheme is applied to ensure diversification and more weight is given to the larger companies.
Related funds
Classification
What's in the fund
Exposure type
Electronic Technology
Producer Manufacturing
Stock breakdown by region
Top 10 holdings

SMH target 377/to 388 focus is 381 zone I when longcallsThe SMH decline was 1.618 the net distance wave 2 to equal wave 4 we saw in the over night . We have now entered the blowoff wave in wave 5 of 5 in the form of an expanding pattern .It should see at range as high as 388 to be equal to wave 1 on a pct basis at 372 it was equal to wave 1 on a

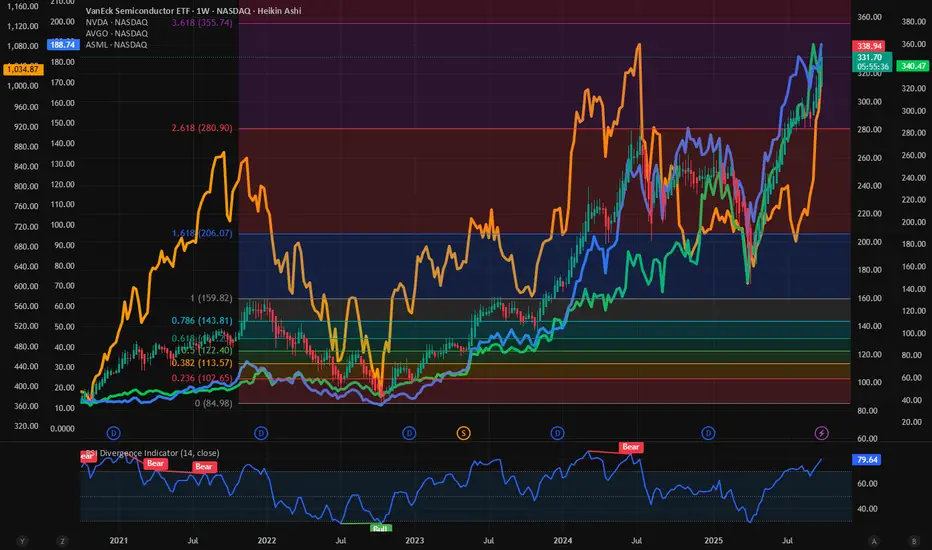
$SMH historic highs. $NVDA dominance stalled. Expect more upsideHi all, I am back after a quick 2 weeks of holiday to bring you the latest on the charts. Today we look at our favorite sector, the Semis. ETF NASDAQ:SMH is approaching the 3.618 Fib Retracement level which lies at 360 $ is within the reach. I predicted in my blog on 5th Oct that the year end targ

Bearish all semis (SMH) here on this retest with major RSI topNASDAQ:SMH retesting this trendline along with an all-time-high in the daily RSI

Silicon Ceiling: SMH:Short My HoldingsFundamental/Macro Rationale
Extreme Valuation & Momentum: SMH has delivered over 40% YTD returns, suggesting the sector is overheated and due for significant profit-taking and consolidation.
Cyclical Headwinds: The semiconductor industry is famously cyclical. A slowdown in demand for mature node eq

$NVDA & $AVGO powering higher. $ASML to 1000 $. $SMH has wings.A quick update on our favorite sector and the favorite stocks within the sector before we go to the weekend. Previously in this space multiple times we have provided price targets on the Semiconductor sector ETF NASDAQ:SMH and the individual stocks like $NVDA. NASDAQ:AVGO and $ASML. We have rei
SMH Bullish Setup – Breakout Plan for the Perfect Heist!🔥🚀 THIEF TRADER ALERT: SMH BULLISH HEIST PLAN! 🚀🔥
Asset: VANECK SEMICONDUCTOR ETF (SMH)
Plan: BULLISH BREAKOUT HEIST 🎯 (Resistance wall breakout candle close above 298.00)
🎯 THIEF ENTRY STRATEGY (LAYERING METHOD) 🎯
"Steal the dip like a PRO!" 💰🔪
Multiple Limit Orders (Layer Entry) 👇
1st Layer: 298

2 stocks and 1 ETF for semiconductor industryI published my views on SMH ETF sometime back and the search button seems missing. Am I the only one having this problem or it has been removed ?
Anyway, there are 2 other stocks in this space that I think still has room to grow. Of the 2 , I would prefer ACLS as the margin of safety is higher.
Ag

SMH Price Prediction Breakdown Key Levels (Visually from Chart):
| Level | Meaning |
| -------------- | --------------------------------------- |
| 🔴 308.00 | Resistance (tested before, price pulled back)
| 🟩 306.50–305.60 | Active range (possible balance

SMH BUY OPPORTUNITYSMH breakout from the ascending triangle signals renewed bullish momentum, supported by powerful long-term demand for key semiconductor drivers.

See all ideas
Summarizing what the indicators are suggesting.
Oscillators
Neutral
SellBuy
Strong sellStrong buy
Strong sellSellNeutralBuyStrong buy
Oscillators
Neutral
SellBuy
Strong sellStrong buy
Strong sellSellNeutralBuyStrong buy
Summary
Neutral
SellBuy
Strong sellStrong buy
Strong sellSellNeutralBuyStrong buy
Summary
Neutral
SellBuy
Strong sellStrong buy
Strong sellSellNeutralBuyStrong buy
Summary
Neutral
SellBuy
Strong sellStrong buy
Strong sellSellNeutralBuyStrong buy
Moving Averages
Neutral
SellBuy
Strong sellStrong buy
Strong sellSellNeutralBuyStrong buy
Moving Averages
Neutral
SellBuy
Strong sellStrong buy
Strong sellSellNeutralBuyStrong buy
Displays a symbol's price movements over previous years to identify recurring trends.
Frequently Asked Questions
An exchange-traded fund (ETF) is a collection of assets (stocks, bonds, commodities, etc.) that track an underlying index and can be bought on an exchange like individual stocks.
SMH trades at 358.41 USD today, its price has fallen −0.85% in the past 24 hours. Track more dynamics on SMH price chart.
SMH net asset value is 348.01 today — it's risen 3.36% over the past month. NAV represents the total value of the fund's assets less liabilities and serves as a gauge of the fund's performance.
SMH assets under management is 36.56 B USD. AUM is an important metric as it reflects the fund's size and can serve as a gauge of how successful the fund is in attracting investors, which, in its turn, can influence decision-making.
SMH price has risen by 3.38% over the last month, and its yearly performance shows a 37.45% increase. See more dynamics on SMH price chart.
NAV returns, another gauge of an ETF dynamics, have risen by 3.36% over the last month, showed a 19.52% increase in three-month performance and has increased by 37.16% in a year.
NAV returns, another gauge of an ETF dynamics, have risen by 3.36% over the last month, showed a 19.52% increase in three-month performance and has increased by 37.16% in a year.
SMH fund flows account for 2.23 B USD (1 year). Many traders use this metric to get insight into investors' sentiment and evaluate whether it's time to buy or sell the fund.
Since ETFs work like an individual stock, they can be bought and sold on exchanges (e.g. NASDAQ, NYSE, EURONEXT). As it happens with stocks, you need to select a brokerage to access trading. Explore our list of available brokers to find the one to help execute your strategies. Don't forget to do your research before getting to trading. Explore ETFs metrics in our ETF screener to find a reliable opportunity.
SMH invests in stocks. See more details in our Analysis section.
SMH expense ratio is 0.35%. It's an important metric for helping traders understand the fund's operating costs relative to assets and how expensive it would be to hold the fund.
No, SMH isn't leveraged, meaning it doesn't use borrowings or financial derivatives to magnify the performance of the underlying assets or index it follows.
In some ways, ETFs are safe investments, but in a broader sense, they're not safer than any other asset, so it's crucial to analyze a fund before investing. But if your research gives a vague answer, you can always refer to technical analysis.
Today, SMH technical analysis shows the buy rating and its 1-week rating is buy. Since market conditions are prone to changes, it's worth looking a bit further into the future — according to the 1-month rating SMH shows the buy signal. See more of SMH technicals for a more comprehensive analysis.
Today, SMH technical analysis shows the buy rating and its 1-week rating is buy. Since market conditions are prone to changes, it's worth looking a bit further into the future — according to the 1-month rating SMH shows the buy signal. See more of SMH technicals for a more comprehensive analysis.
Yes, SMH pays dividends to its holders with the dividend yield of 0.31%.
SMH trades at a premium (0.03%).
Premium/discount to NAV expresses the difference between the ETF’s price and its NAV value. A positive percentage indicates a premium, meaning the ETF trades at a higher price than the calculated NAV. Conversely, a negative percentage indicates a discount, suggesting the ETF trades at a lower price than NAV.
Premium/discount to NAV expresses the difference between the ETF’s price and its NAV value. A positive percentage indicates a premium, meaning the ETF trades at a higher price than the calculated NAV. Conversely, a negative percentage indicates a discount, suggesting the ETF trades at a lower price than NAV.
SMH shares are issued by Van Eck Associates Corp.
SMH follows the MVIS US Listed Semiconductor 25. ETFs usually track some benchmark seeking to replicate its performance and guide asset selection and objectives.
The fund started trading on May 5, 2000.
The fund's management style is passive, meaning it's aiming to replicate the performance of the underlying index by holding assets in the same proportions as the index. The goal is to match the index's returns.