272.30This channel is not providing individualized trading or investment advice, nor is it a banking service, brokerage service, trading service, investment service or money management service
Trade ideas

Why the Eurodollar Market Became a Financial HavenIntroduction
The Eurodollar market stands as one of the most significant and transformative developments in modern finance. Despite its name, the term “Eurodollar” has little to do with Europe as a continent or the euro as a currency. Instead, it refers to U.S. dollar-denominated deposits held in banks outside the United States, particularly in Europe during its early days. What began as a niche market in the post-World War II era gradually evolved into a global financial haven—an offshore ecosystem of liquidity, flexibility, and innovation that reshaped international finance.
Understanding why the Eurodollar market became a financial haven requires examining the historical context, regulatory framework, and the incentives driving global capital flows. It was not merely a byproduct of globalization; it was the very foundation that allowed global finance to operate efficiently across borders, free from the constraints of national monetary policies.
1. Origins of the Eurodollar Market
The roots of the Eurodollar market trace back to the late 1940s and 1950s, when geopolitical tensions and economic transformations began reshaping the financial landscape. After World War II, the United States emerged as the world’s dominant economic power, with the U.S. dollar becoming the global reserve currency under the Bretton Woods system.
During this time, many foreign banks and corporations began holding dollar deposits outside the United States, particularly in European banks. One of the first major holders of such deposits was the Soviet Union, which sought to protect its dollar holdings from potential U.S. sanctions during the Cold War. By placing dollars in European banks, the Soviets could still conduct trade and financial transactions in dollars—without the risk of U.S. authorities freezing their assets.
As European economies rebuilt under the Marshall Plan, dollar-based trade expanded rapidly. European banks found themselves flush with dollar deposits, which they began lending out to other international borrowers. This marked the birth of the Eurodollar market—a decentralized, unregulated offshore market for U.S. dollars.
2. Regulatory Arbitrage: The Core Catalyst
The Eurodollar market thrived largely because it existed outside U.S. regulatory jurisdiction. Domestic banks in the United States faced strict regulations under the Federal Reserve System, including reserve requirements and interest rate ceilings imposed by Regulation Q. These restrictions limited how much interest U.S. banks could pay on deposits and constrained their lending flexibility.
In contrast, offshore banks—mainly in London—were not subject to U.S. banking regulations. This regulatory arbitrage created a competitive advantage: Eurodollar deposits could offer higher interest rates, and Eurodollar loans could be made more flexibly and at lower costs.
Borrowers and depositors around the world quickly recognized the benefits. Multinational corporations preferred Eurodollar loans for their international operations, and investors sought Eurodollar deposits for better yields. The absence of reserve requirements meant that Eurobanks could leverage their funds more aggressively, enhancing liquidity in the market.
This unregulated freedom made the Eurodollar system an ideal haven—a place where capital could move freely, unencumbered by the constraints of national borders and domestic monetary policies.
3. The London Advantage: The World’s Financial Hub
London’s role as the birthplace and hub of the Eurodollar market was no coincidence. The city had centuries of experience as a global financial center, connecting Europe, America, and the Commonwealth. By the 1950s, the British government encouraged offshore banking activity to boost its post-war economy and maintain London’s global relevance.
The Bank of England adopted a hands-off approach toward Eurodollar transactions, seeing them as foreign currency operations that did not affect domestic monetary stability. This permissive environment, combined with London’s strategic time zone (bridging Asia and America), created a perfect breeding ground for 24-hour international finance.
As a result, London became the nerve center of global dollar liquidity, with Eurodollar deposits circulating seamlessly between Europe, Asia, and the Americas. By the 1970s, Eurodollar markets had become the cornerstone of global finance—fueling trade, investment, and speculation on an unprecedented scale.
4. The Rise of Global Liquidity and Flexibility
The Eurodollar market’s greatest strength was its ability to provide liquidity when and where it was needed most. Unlike domestic banking systems, which were often constrained by national policies and reserve rules, Eurobanks operated in a borderless environment.
Corporations used Eurodollar loans to fund trade, mergers, and acquisitions, while central banks and sovereign wealth funds used Eurodollar deposits as a store of value. The market also became a vital source of funding for governments, especially developing nations seeking to borrow in dollars without going through the tightly regulated U.S. market.
By the late 1960s, the Eurodollar market had grown into a massive pool of offshore liquidity. When the Bretton Woods system collapsed in 1971 and exchange rates began to float, the Eurodollar market became even more essential. It offered a global mechanism for hedging, borrowing, and investing across currencies—laying the foundation for today’s interconnected financial system.
5. Freedom from Monetary Control
Another key reason the Eurodollar market became a financial haven lies in its freedom from central bank control. In the U.S., the Federal Reserve could regulate domestic money supply, influence interest rates, and impose capital controls. However, it had little jurisdiction over offshore dollar transactions.
This meant that even when the Fed tightened domestic credit conditions, international borrowers could still access dollar liquidity through Eurobanks. In essence, the Eurodollar market allowed global finance to operate independently of U.S. monetary policy.
This autonomy had far-reaching implications. It weakened the effectiveness of national monetary controls and allowed financial institutions to bypass domestic credit restrictions. The result was a truly globalized money market—one that operated beyond the reach of any single government, creating a self-sustaining ecosystem of private credit creation.
6. Innovation and Market Instruments
The Eurodollar market also became a laboratory for financial innovation. As competition intensified, banks developed new instruments to manage risk and enhance returns. These included floating-rate loans, syndicated lending, and short-term Eurodollar certificates of deposit.
The introduction of the London Interbank Offered Rate (LIBOR) in the 1960s provided a standardized benchmark for pricing Eurodollar loans. LIBOR quickly became the most important reference rate in global finance, underpinning trillions of dollars in loans, derivatives, and securities.
These innovations transformed the Eurodollar market into a complex web of interbank relationships and credit channels. It was not just a deposit market—it was a full-fledged financial system operating parallel to, but distinct from, domestic banking systems.
7. Safe Haven for Capital and Sovereigns
For many investors and nations, the Eurodollar market became a safe haven for several reasons:
Currency Stability: The U.S. dollar was (and remains) the world’s most trusted currency. Holding dollar assets offshore allowed investors to preserve value even when local currencies faced inflation or devaluation.
Confidentiality: Offshore banking jurisdictions often offered privacy and discretion, making them attractive to corporations, governments, and wealthy individuals seeking to protect their assets from political risks.
Political Neutrality: During the Cold War and beyond, the Eurodollar market offered a politically neutral ground for transactions between entities that might not otherwise cooperate through U.S.-regulated channels.
Diversification: Holding Eurodollar assets provided global investors with diversification away from domestic financial risks.
These features reinforced the Eurodollar market’s reputation as a financial sanctuary, a place where money could flow freely and securely amid global uncertainty.
8. The Eurodollar Market and Global Financial Power
Over time, the Eurodollar system reshaped the balance of financial power. It gave rise to massive offshore banking networks, enabled shadow banking, and facilitated the globalization of credit.
By the 1980s and 1990s, Eurodollar deposits had become an integral part of international capital markets. They funded corporate expansions, sovereign debt issuance, and speculative investments across continents. Even today, a significant portion of the world’s dollar liquidity exists outside U.S. borders—testament to the enduring legacy of the Eurodollar market.
In essence, the Eurodollar market made the U.S. dollar truly global—not just a national currency, but the lifeblood of international finance. Ironically, while it strengthened the dollar’s dominance, it simultaneously limited America’s ability to control its own currency’s global circulation.
9. Challenges and Risks
While the Eurodollar market offered flexibility and freedom, it also introduced new risks. The absence of regulation meant there was no lender of last resort for Eurobanks. During periods of financial stress, such as the 2008 Global Financial Crisis, the shortage of dollar liquidity in offshore markets amplified global instability.
Moreover, the market’s opacity made it difficult for regulators to monitor systemic risk. Interbank exposures, derivative linkages, and maturity mismatches often went undetected until crises struck. Despite these challenges, the Eurodollar market’s scale and interconnectedness made it impossible to dismantle—it had become too central to the functioning of global finance.
10. The Modern Eurodollar Landscape
Today, the Eurodollar market continues to play a vital role, even as financial technology and regulations evolve. Although LIBOR is being phased out and replaced by alternative benchmarks like SOFR (Secured Overnight Financing Rate), the fundamental dynamics of offshore dollar liquidity remain intact.
From Asian financial hubs like Singapore and Hong Kong to Middle Eastern centers like Dubai, the Eurodollar spirit lives on through global dollar lending and deposit activities. The rise of digital finance and offshore capital markets further extends the reach of the Eurodollar ecosystem—making it an indispensable pillar of the global financial architecture.
Conclusion
The Eurodollar market became a financial haven because it embodied freedom, efficiency, and trust in a world increasingly shaped by regulation and geopolitics. Its unregulated origins offered participants higher yields and greater flexibility, while its global reach turned the U.S. dollar into a universal instrument of trade, investment, and security.
From Cold War strategies to modern financial globalization, the Eurodollar market represents more than just offshore banking—it represents the world’s pursuit of monetary independence beyond political borders.
Even in the 21st century, the Eurodollar system remains the invisible backbone of global liquidity, silently powering international finance. It is both a sanctuary for capital and a mirror of our interconnected economic reality—a financial haven born from innovation, trust, and the unstoppable flow of money across nations.

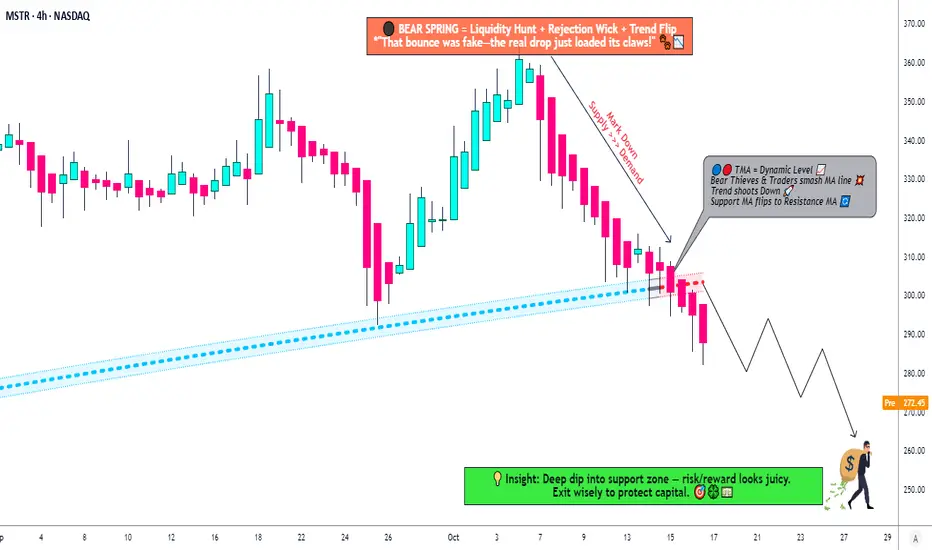
MSTR: Time to Short? Death Cross + Triangle Break Analysis🐻 MSTR "STRATEGY INC." - The Bear's Playground | Thief's Multi-Layer Setup 💰
📊 MARKET SNAPSHOT
Asset: NASDAQ:MSTR (Strategy Inc. - formerly MicroStrategy)
Current Price: ~$291.23 (Oct 17, 2025)
Setup Type: Swing/Day Trade - Bearish Confirmation
Strategy Style: "Thief Method" - Layered Limit Orders 🎯
🔍 THE SETUP - Why This Bearish Play Makes Sense
Ladies and Gentlemen, welcome to the Thief's playbook! 👋 MSTR just gave us a beautiful bearish signal with a triangular moving average breakdown. Here's what the charts are screaming:
🎯 The "Thief" Entry Strategy - Layered Limit Orders
This isn't your typical "buy now" play. We're sneaking in like a thief in the night with MULTIPLE SELL LIMIT LAYERS:
Entry Zones (Layer Your Shorts):
Layer 1: $310 (First resistance retest)
Layer 2: $300 (Psychological level)
Layer 3: $290 (Current consolidation zone)
💡 Pro Tip: Scale into your position! You can add MORE layers based on your risk tolerance (e.g., $305, $295, $285). The "Thief Method" is all about spreading your entries to catch the perfect price zones.
🛑 RISK MANAGEMENT - The Thief's Insurance Policy
Stop Loss: $320 🚨
(This is the Thief's emergency exit - if price breaks above this, the bears lost control)
⚠️ IMPORTANT NOTE:
Dear Thief OG's (Original Gangsters), this is MY stop loss level based on MY analysis. You should set YOUR OWN stop loss based on YOUR risk tolerance. Don't copy blindly - manage YOUR money, take YOUR profits (or losses) at YOUR own risk! This is YOUR trade, not mine. 💯
🎯 PROFIT TARGET - Where the Money's Hiding
Primary Target: $250 🎉
Why $250?
Strong historical support level
Oversold bounce zone (RSI typically rebounds here)
TRAP ALERT: Institutional buyers often accumulate at this level - be ready to ESCAPE with your profits before the bulls wake up! 🐂💤
⚠️ TAKE PROFIT NOTE:
Dear Thief OG's, $250 is MY target based on MY analysis. You can (and should) set YOUR own targets. If you're in profit at $270, $260, or even $280 - TAKE THE MONEY AND RUN! 💰 No shame in banking profits early. Remember: pigs get fat, hogs get slaughtered. This is YOUR trade, YOUR risk, YOUR decision!
🔗 RELATED ASSETS TO WATCH - The Correlation Game
MSTR doesn't trade in a vacuum! Keep your eyes on these correlated assets:
📈 Primary Correlation:
CRYPTOCAP:BTC (Bitcoin): ~$108,625 (Oct 17, 2025) - MSTR holds 640,000+ BTC (3%+ of total supply!)
Correlation Strength: 🔥🔥🔥🔥🔥 ULTRA HIGH
Why It Matters: MSTR is essentially a leveraged Bitcoin play. When BTC sneezes, MSTR catches a cold. Bitcoin's current bearish pressure directly impacts MSTR's valuation.
🔄 Secondary Watchlist:
NASDAQ:COIN (Coinbase): Crypto exchange - sentiment indicator
NASDAQ:RIOT (Riot Platforms): Bitcoin mining stock
NASDAQ:MARA (Marathon Digital): Another BTC-related equity
NASDAQ:CLSK (CleanSpark): Bitcoin mining operations
Key Point: If Bitcoin breaks below $105K support, expect MSTR to accelerate downward. Conversely, if BTC rallies back above $115K, this bearish setup could invalidate. Watch Bitcoin like a hawk! 🦅
📊 THE BIGGER PICTURE - Why MSTR Is Vulnerable Right Now
Bitcoin Pressure: BTC down -2.19% today, testing critical support levels
Institutional Caution: Recent S&P 500 rejection (not included in index) = credibility questions
Valuation Concerns: Trading at significant premium to NAV (Net Asset Value)
Technical Breakdown: Multiple MA crosses + trend reversal signals
Macro Headwinds: Risk-off sentiment in crypto markets (3-day consecutive decline)
🎓 THE THIEF'S WISDOM - Final Thoughts
This setup combines:
✅ Technical confirmation (MA breakout)
✅ Layered entry strategy (better average price)
✅ Clear risk management (defined stop loss)
✅ Realistic profit targets (strong support zone)
✅ Correlated asset monitoring (BTC relationship)
Remember: The market doesn't care about your opinion. Respect the charts, manage your risk, and don't get greedy. The "Thief Method" is about stealing profits intelligently, not gambling recklessly! 🎰❌
💬 TRADE SMART, NOT HARD!
This is a BEARISH SETUP with defined entries, exits, and risk parameters. Whether you're swing trading or day trading, the key is DISCIPLINE. Stick to your plan, don't chase, and protect your capital.
Questions? Thoughts? Drop them below! 👇
Let's build a community of smart traders who help each other win! 🤝
✨ If you find value in my analysis, a 👍 and 🚀 boost is much appreciated — it helps me share more setups with the community!
#MSTR #Bitcoin #BTC #TradingView #SwingTrading #DayTrading #BearishSetup #ShortSetup #CryptoStocks #TechnicalAnalysis #MovingAverages #LayeredEntry #RiskManagement #ProfitTarget #StrategyInc #MicroStrategy #ThiefMethod #TradingStrategy #StockMarket #NASDAQ
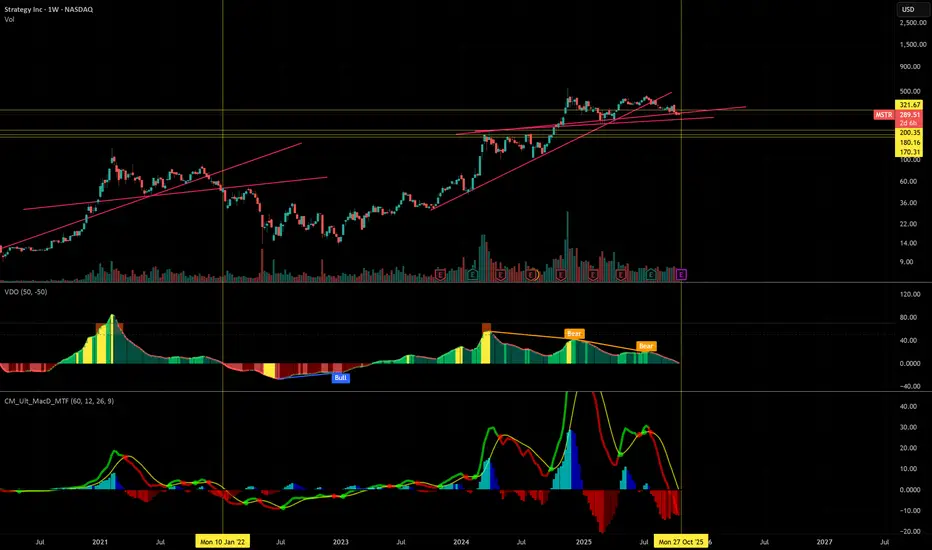
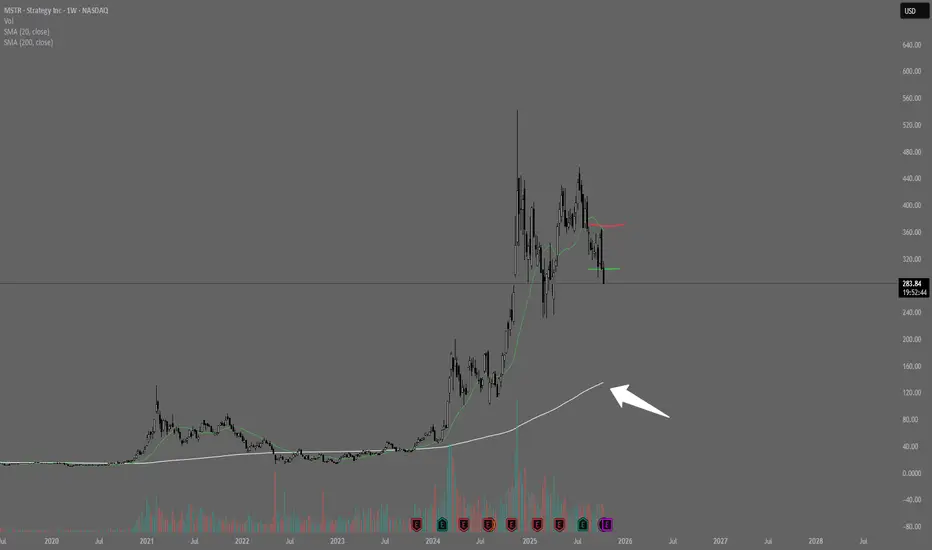
MSTR pull back a buying opportunityMSTR checking key supports.
Respects the trend started 2 years ago, revisiting a historical RSI low, only seen back in June 2022.

MSTR TRADES UP 1X FOR EVERY BTC UP, BUT 3-4X DOWN WITH BTCMSTR is dead. the "Leverage"is 3-4x down for btc movement, but only 1x up for btc movement
the degradation of how far below each btc ath is also getting worse, it has doubled since the last btc ath.

Will Microstrategy $MSTR follow the 2021 cycle?
Top was around the most greedy time in the market per Election '24. As bitcoin put in new all time highs MSTR continued lower highs, just like in '21. Last line of support around $230, it should continue putting in lower highs as the cycle comes to an end.
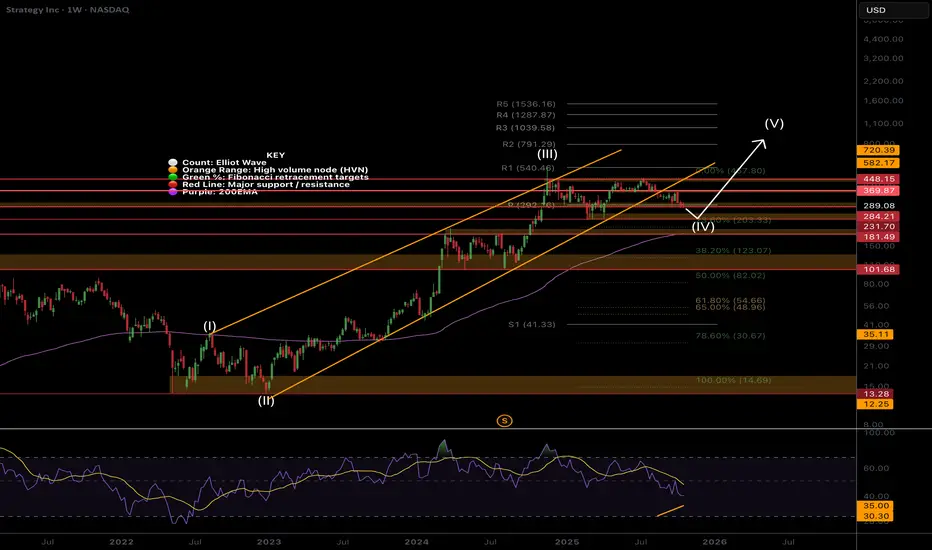
MSTR still in wave 4 rangeNASDAQ:MSTR Price is still in a wave (IV) which are expected to be long and drawn out, yet shallow which is what we have here. I don’t expect wave (V) to kick in until Bitcoin moves. Wave (V) has an expected of the R3 daily pivot at $1039 but will overextend if Bitcoin does.
Price has fallen out of the lower channel boundary and sitting at the weekly pivot, still above the weekly 200EMA so the outlook us bullish. wave (4) may complete at the 0.236 Fibonacci retracement at $203. For now I am waiting to see what happens before entering but believe good opportunities are setting up.
Safe trading
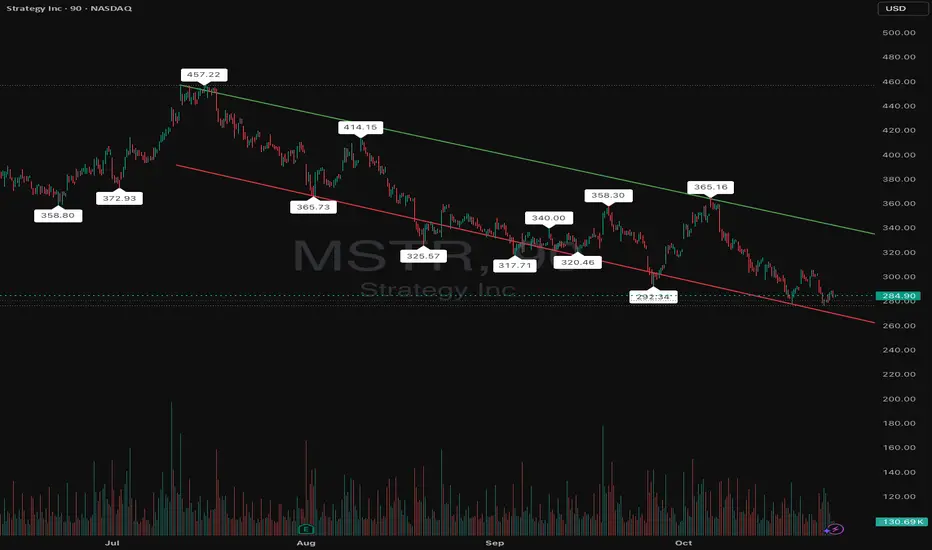
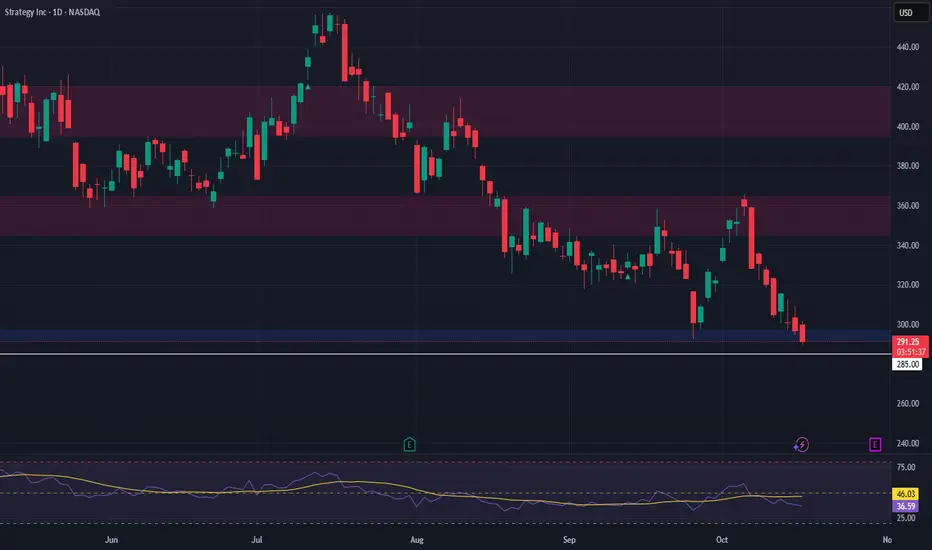
$MSTR - Consolidating at Lower Trendline — Decision Zone AheadMSTR (MicroStrategy Inc.) is trading within a well-defined descending channel that has persisted since July. The stock continues to make lower highs and lower lows, reflecting a strong bearish trend. It is currently testing the lower channel support around the $284–$285 area, a zone that has previously triggered short-term rebounds. If MSTR can hold this level and reclaim $300, a potential bounce toward the mid-channel region around $320–$340 could follow. However, a breakdown below $280 may signal further downside toward $265 or even $250. Overall, the stock is at a critical inflection point where traders are watching to see whether the support holds or the downtrend resumes.
Bullish Scenario (Countertrend play):
Entry near $285 with tight stop below $275 -Target $320–$340
Bearish Scenario (Trend continuation):
Wait for breakdown below $280.
Target $265 then $250 -Stop above $300
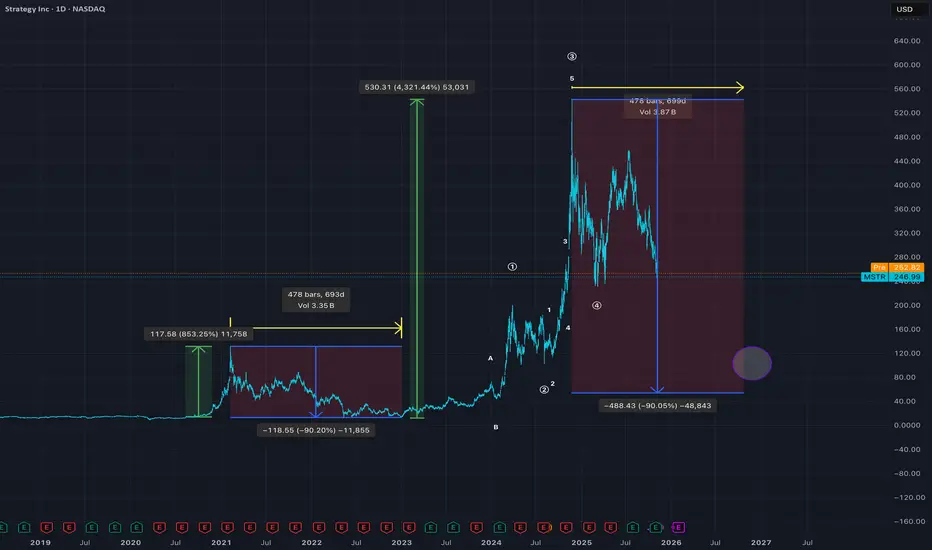
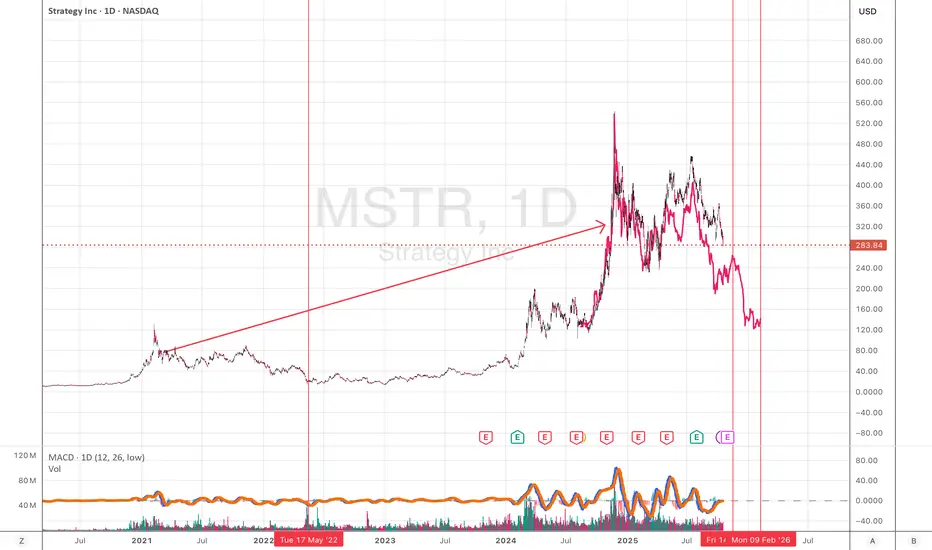
If this looks bullish.. you got another thing coming History doesn't repeat itself, but it often rhymes. So far 1:1.
I reckon the next 356 days will test out Saylors holders
MSTR going lower before making the move upI am looking at NASDAQ:MSTR to make a lower move to a support zone which i see some orders at before moving higher. NASDAQ:MSTR movement has high correlation to $BTC. Seeing it go lower beofre moving up again.
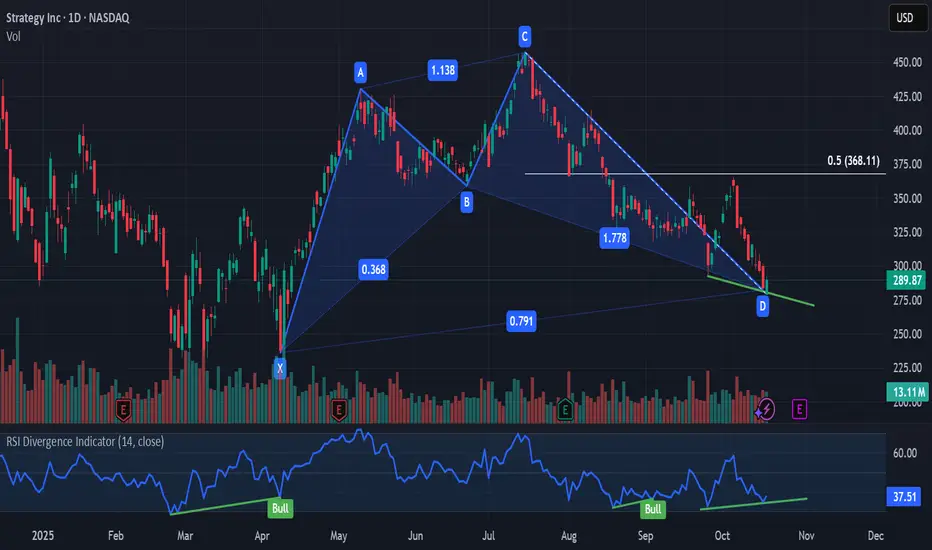
$MSTR bullish cypher patternBullish divergence on Cypher pattern PRZ with CRYPTOCAP:BTC currently trying to bounce during the weekend. possibly targeting 368.11
MSTR : It's all about Dejavues'We had the almost exact behaviour before, but be aware that 20 Oct from BTCUSD Side there will be a intermediate low and year end rally of BTCUSD will start
The Expanding Horizon of Global InvestingUnderstanding Global Investing
Global investing involves allocating capital across international markets, industries, and financial instruments. Unlike domestic investing, which confines opportunities to a single country, global investing allows investors to access equities, bonds, commodities, real estate, and other assets across borders. The rationale is straightforward: diversification reduces risk while enhancing the potential for returns. By investing globally, investors are less exposed to the economic, political, or regulatory volatility of a single nation.
Global investing takes various forms. Some investors focus on developed markets such as the United States, Europe, or Japan, attracted by stability, transparency, and established financial infrastructure. Others target emerging and frontier markets, including countries in Asia, Africa, and Latin America, drawn by high growth potential and demographic advantages. A balanced global portfolio often combines both approaches, capturing the security of developed markets while capitalizing on the growth prospects of emerging economies.
Drivers of the Global Investing Trend
Several factors have fueled the rise of global investing. These drivers encompass economic, technological, and regulatory dimensions.
Economic Globalization: The integration of global markets has expanded opportunities for investors. Companies operate internationally, supply chains span continents, and trade volumes have skyrocketed. As a result, local market performance is increasingly influenced by global economic trends. Investors who remain domestically confined may miss the growth occurring elsewhere, making global investing essential for capitalizing on worldwide opportunities.
Technological Advancements: Technology has democratized access to international markets. Digital trading platforms, online brokerage services, and real-time market data allow individual investors to participate in foreign exchanges with unprecedented ease. Additionally, financial technology innovations such as robo-advisors, algorithmic trading, and blockchain-based investment platforms have made global investing more efficient, cost-effective, and transparent.
Regulatory Harmonization: Over the past few decades, many countries have adopted policies encouraging foreign investment. Liberalization of capital accounts, improved investor protection laws, and the standardization of financial reporting have reduced barriers to entry. This regulatory support has made cross-border investing safer and more appealing, especially for institutional investors managing large portfolios.
Demographic Shifts and Wealth Accumulation: Growing middle-class populations in emerging economies and increased wealth in developed nations have created a surge in global investment capital. Investors are actively seeking diversified opportunities to preserve and grow wealth, often looking beyond their home countries for higher returns.
Benefits of Global Investing
The advantages of investing globally are multifaceted and extend beyond the traditional goal of financial returns.
Diversification: The core principle driving global investing is diversification. Different countries and regions often experience varying economic cycles. While one market may suffer a downturn, another may thrive. Global exposure reduces the impact of localized economic shocks, political instability, or currency fluctuations on an investor’s portfolio.
Access to High-Growth Markets: Emerging markets, in particular, offer compelling growth opportunities. Nations experiencing rapid industrialization, urbanization, and technological adoption often witness significant equity market expansion. Investors who strategically allocate capital to these regions can benefit from high potential returns that may not be available domestically.
Currency Diversification: Global investing introduces exposure to multiple currencies. While currency risk exists, this diversification can also be advantageous. Appreciation in foreign currencies relative to the investor’s home currency can enhance returns. Moreover, spreading investments across multiple currencies can reduce the overall volatility of a portfolio.
Broader Investment Opportunities: International markets provide access to unique sectors and companies not available domestically. For instance, investors in the United States may gain exposure to Asia’s booming technology sector, Africa’s natural resources, or Europe’s green energy initiatives. This access enables more comprehensive portfolio construction.
Inflation Hedge: Certain international assets can act as a hedge against domestic inflation. For example, investing in countries with lower inflation rates or in hard assets such as commodities can protect purchasing power when domestic inflation erodes the value of investments.
Challenges and Risks
While global investing presents substantial opportunities, it is not without challenges. Investors must navigate a complex landscape that involves various risks.
Currency Risk: Fluctuations in exchange rates can affect returns. An appreciating home currency may reduce the value of foreign investments, while a depreciating home currency can amplify gains or losses.
Political and Regulatory Risk: Political instability, changes in government policies, and regulatory uncertainties can significantly impact foreign investments. For instance, sudden restrictions on foreign capital flows or expropriation of assets can lead to losses.
Market and Economic Risk: Economic downturns, financial crises, and market volatility in a foreign country can adversely affect investments. Emerging markets, in particular, are prone to higher volatility due to less mature financial systems.
Information and Transparency Challenges: Investors may face difficulties in accessing reliable information about foreign markets. Differences in accounting standards, corporate governance practices, and financial reporting can pose challenges in evaluating investment opportunities.
Transaction Costs: Investing internationally can involve higher costs, including brokerage fees, taxes, and currency conversion charges. Although technology has reduced some of these barriers, they remain an important consideration in portfolio construction.
Instruments and Strategies for Global Investing
Global investing encompasses a variety of instruments and strategies tailored to different investor profiles.
Equities: Investing in foreign stocks allows participation in the growth of international companies. Investors can purchase individual stocks listed on foreign exchanges or invest in Exchange-Traded Funds (ETFs) that track international indices.
Bonds: Sovereign and corporate bonds issued by foreign governments and companies provide income and diversification. Investors may choose bonds from developed markets for stability or emerging markets for higher yields.
Mutual Funds and ETFs: International mutual funds and ETFs pool capital to invest in global assets. They provide diversification, professional management, and easy access to foreign markets, especially for individual investors.
Alternative Investments: Real estate, commodities, private equity, and hedge funds offer additional avenues for global exposure. These alternatives can enhance returns and provide hedges against inflation and market volatility.
Currency Hedging Strategies: To mitigate currency risk, investors may employ hedging techniques such as forward contracts, options, and currency ETFs. Hedging allows investors to stabilize returns without sacrificing exposure to foreign markets.
The Role of Institutional Investors
Institutional investors such as pension funds, insurance companies, and sovereign wealth funds play a pivotal role in global investing. These entities manage large pools of capital and often have the resources and expertise to navigate complex international markets. Their participation has increased market liquidity, enhanced price discovery, and contributed to the development of global financial markets. Institutional strategies often include a mix of equities, fixed income, and alternative investments, carefully calibrated to achieve long-term growth while managing risk.
Technology and Global Investing
Technological innovation continues to reshape global investing. Digital platforms enable seamless access to international markets, while advanced analytics, artificial intelligence, and big data allow investors to make informed decisions. Moreover, blockchain and decentralized finance (DeFi) are creating new opportunities for cross-border investments, potentially reducing reliance on traditional intermediaries and increasing transparency. Technology also facilitates global portfolio monitoring, performance tracking, and risk management, making international investing more accessible to retail investors.
Future Outlook
The horizon of global investing is expanding faster than ever. Several trends are likely to shape its future:
Sustainable and ESG Investing: Environmental, social, and governance (ESG) criteria are increasingly influencing investment decisions globally. Investors are looking for companies and countries that prioritize sustainability, ethical governance, and social responsibility. This trend is driving capital toward green technologies, renewable energy, and socially responsible enterprises worldwide.
Emerging Market Growth: Emerging markets are expected to continue driving global economic growth. Rising incomes, urbanization, and technological adoption will create new opportunities for investors seeking long-term returns.
Integration of Advanced Technologies: Artificial intelligence, machine learning, and blockchain will enhance global investing strategies, improve risk management, and provide innovative solutions for portfolio optimization.
Geopolitical Dynamics: Geopolitical shifts, trade agreements, and international policy decisions will influence global investment flows. Investors will need to adapt strategies to navigate complex global interactions while balancing risk and reward.
Conclusion
The expanding horizon of global investing represents a paradigm shift in the financial world. It is a reflection of economic globalization, technological innovation, and evolving investor preferences. While opportunities abound, global investing requires careful consideration of risks, diversification strategies, and market dynamics. Investors who embrace a global perspective are better positioned to achieve long-term growth, mitigate risk, and participate in the wealth creation unfolding across the world.
Global investing is not just a strategy—it is a mindset that recognizes the interconnectedness of economies, the power of diversification, and the limitless potential of worldwide markets. As barriers continue to diminish and opportunities proliferate, the horizon for investors is broader, more dynamic, and richer than ever before.
MSTR Hidden Leverage: What Happens When the Cycle Turns?When a company builds its balance sheet around Bitcoin, it becomes more than a software firm — it turns into a leveraged bet on BTC itself.
That’s exactly what MicroStrategy (MSTR) has done. And while this strategy paid off massively during Bitcoin’s uptrend, the same dynamic could become a serious liability when the cycle shifts.
1. The Amplified Correlation
MicroStrategy’s market cap is now deeply tied to the value of its Bitcoin holdings.
As BTC rallies, MSTR tends to outperform — sometimes doubling the percentage moves of Bitcoin itself.
But this also means that during downtrends, the drawdowns can be brutal.
In previous cycles, MSTR lost more than 80% of its value as BTC corrected.
2. The Nature of Hidden Leverage
Unlike traditional leverage through debt or derivatives, MSTR’s “leverage” comes from balance-sheet exposure.
The company has repeatedly issued convertible debt and used the proceeds to buy more Bitcoin.
In other words, the stock is effectively a leveraged vehicle on BTC — but with all the operational and financing risks of a public company layered on top.
3. When Sentiment Shifts
During bull markets, investors pile into MSTR as a regulated way to gain exposure to Bitcoin.
But when risk appetite fades, the same crowd exits just as fast.
That double pressure — falling BTC and capital rotation out of crypto — can trigger violent selloffs.
MSTR’s liquidity amplifies this volatility even further.
4. The Structural Risk
At current levels, MSTR’s valuation is heavily dependent on BTC maintaining or expanding its price range.
If Bitcoin consolidates or enters a deeper correction, the company’s debt-fueled exposure could start to weigh heavily.
This is where the “hidden leverage” shows its downside.
Leverage without leverage only works… until the market reminds you that it’s still leverage.
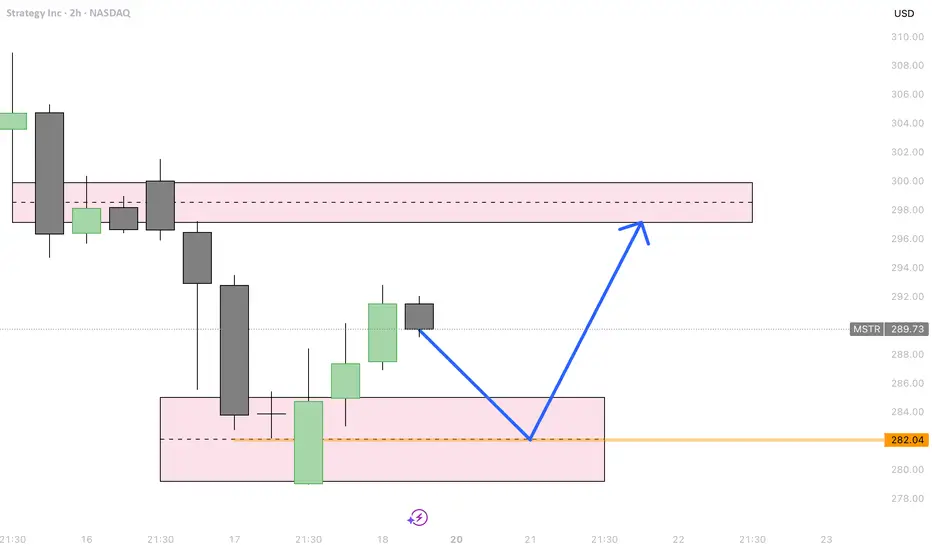
MSTR- Double Bottom Forming at Key Support–Bullish Setup in PlayPrice is once again testing a major support zone ($292–$297), where it is also forming a double bottom pattern — a strong technical reversal signal. This confluence of structure and pattern typically suggests that bulls may soon regain control, setting the stage for a potential move higher.
💡 Trade Idea: Long Spot Entry
Entry Zone: $292–$297
Take Profit Levels:
TP1: $345–$365
TP2: $395–$420
Stop Loss: Just below $285
MSTR: Trend ContinuesSince our last update, MSTR extended its sell-off. We still expect the low of this wave to form above the support level at $153.49. Once wave 2 is complete, we anticipate a strong wave 3 rally pushing above resistance at $674.18. Our alternative scenario assumes a different wave count: in this case, price may currently be developing the magenta wave alt. to the upside (probability: 30%). This count would be confirmed by a direct move above resistance at $430.50.

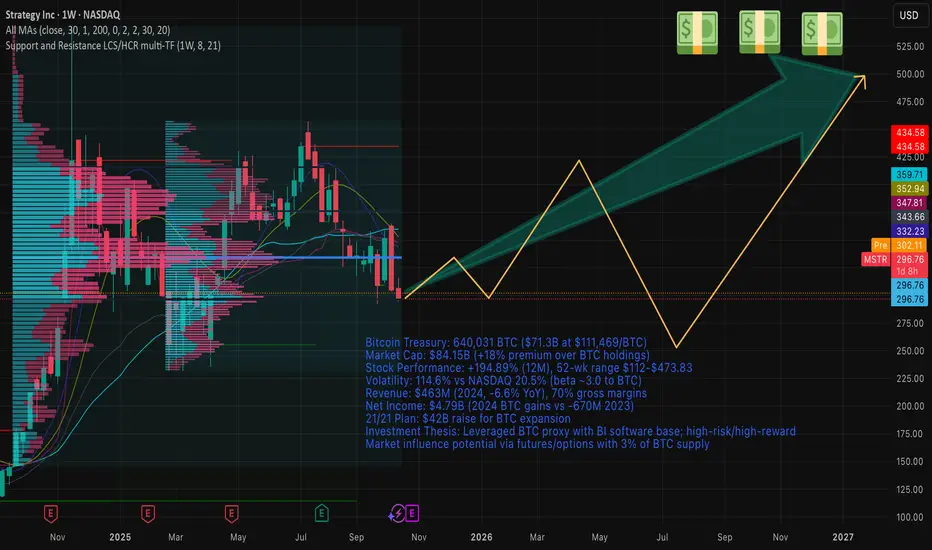
Strategy Inc. (NASDAQ: MSTR) - Financial ReportDate: October 16, 2025
Current Market Context:
As of October 16, 2025, Bitcoin trades at approximately $111,469 USD, reflecting a volatile yet upward trajectory influenced by institutional adoption and macroeconomic factors.
Strategy Inc., formerly MicroStrategy, holds 640,031 BTC, valued at $71.3 billion USD as of today.
The company's market capitalization stands at $84.15 billion USD, representing an 18% premium over its Bitcoin reserve value.
This premium accounts for operational assets, including fixed costs, employee salaries, and intellectual property, while underscoring the market's perception of MSTR as a leveraged Bitcoin proxy.
Notably, the company's substantial BTC holdings enable potential market influence through strategies involving futures and options, allowing for amplified exposure to cryptocurrency volatility.
1. Company Overview
Strategy Inc. (MSTR) is a leading provider of AI-powered enterprise analytics software and services, operating in the business intelligence (BI) and software sector. Founded in 1989 by Michael J. Saylor and Sanju Bansal in Wilmington, Delaware, the company initially focused on data mining and BI tools inspired by systems-dynamics theory from their MIT studies.
It secured its first major client, McDonald's, with a $10 million contract in 1992, driving 100% annual revenue growth from 1990 to 1996. By 1994, the firm relocated to Tysons Corner, Virginia, expanding to 50 employees.
The company went public in 1998 and evolved into a pioneer in BI platforms, offering products like MicroStrategy ONE for non-technical insights and HyperIntelligence for contextual overlays. In August 2020, under Saylor's leadership, Strategy adopted Bitcoin as its primary treasury reserve asset, purchasing 21,454 BTC for $250 million—a move that transformed it into the world's largest corporate Bitcoin holder.
This pivot positioned MSTR as a "Bitcoin spot leveraged ETF" proxy, blending software revenue with cryptocurrency exposure.
In February 2025, it rebranded from MicroStrategy to Strategy Inc. to emphasize its dual focus on analytics and Bitcoin innovation. Today, it serves industries including finance, healthcare, retail, and government, with a global presence across North America, EMEA, LATAM, and APAC.
Strategic Objectives and Corporate Vision
Strategy's vision is to empower organizations with AI-driven analytics while leveraging Bitcoin as a superior store of value against inflation and currency devaluation. Core objectives include:
- Expanding market share in BI through innovative technologies like cloud-native platforms and partnerships.
- Executing the "21/21 Plan": Raising $21 billion in equity and $21 billion in fixed-income instruments over three years to acquire more BTC, enhancing treasury value.
- Balancing software growth (e.g., via Strategy Mosaic for data governance) with Bitcoin strategy for long-term value creation.
Saylor, the Executive Chairman, focuses on Bitcoin acquisitions, while CEO Phong Le oversees operations. The company holds 340 patents, emphasizing innovation in BI and blockchain applications.
2. Financial Analysis
Consolidated Balance Sheet: Last Three Years
Strategy's financials reflect modest BI revenue growth overshadowed by Bitcoin impairments and gains. Data is in USD millions, sourced from annual reports.
| Metric | 2024 | 2023 | 2022 |
|--------------------|---------|---------|---------|
| Total Revenue | 463.0 | 496.0 | 496.0 |
| Cost of Revenue | 138.9 | 148.0 | 152.0 |
| Gross Profit | 324.1 | 348.0 | 344.0 |
| Operating Expenses | -6,660 | 450.0 | 500.0 |
| Operating Income | 6,660 | -102.0 | -156.0 |
| Net Income | 4,790 | -670.8 | -1,470 |
| Gross Margin (%) | 70.1 | 70.2 | 69.4 |
| Net Margin (%) | 1,036.6 | -135.3 | -296.4 |
Volatility stems from Bitcoin fair-value adjustments: 2024 gains drove net income surge, while prior years saw impairments. Revenue declined 6.6% YoY in 2024 due to subscription shifts, but gross margins remain robust at ~70%.
Cash Flow Analysis
Cash flows highlight Bitcoin-driven investing outflows, offset by financing inflows. Data in USD millions.
| Category | 2024 | 2023 | 2022 |
|-------------------------|-------- |---------|---------|
| Operating Cash Flow | 50.1 | 65.0 | 45.0 |
| Investing Cash Flow | -35,630 | -2,100 | -500.0 |
| Financing Cash Flow | 35,500 | 2,050 | 450.0 |
| Net Change in Cash | -80 | 15.0 | -5.0 |
| Free Cash Flow Growth (%) | -1,069 | N/A | N/A |
Operating cash flow remains positive but modest (~$50M in 2024), supporting software operations. Investing activities reflect massive BTC purchases ($35.6B in 2024 via debt/equity raises), while financing provides liquidity through convertible notes and ATM offerings. This structure amplifies BTC exposure but increases dilution risk.
Key Performance Indicators
Financial ratios reveal efficiency in equity utilization but asset strain from BTC leverage.
| Ratio | 2024 | 2023 | 2022 | Interpretation |
|--------------- --|----------|----------|--------|----------------|
| ROE (%) | 18.01 | -25.0 | -40.0 | Strong recovery via BTC gains; measures profitability per equity dollar. |
| ROA (%) | 12.75 | -5.0 | -8.0 | Improved asset efficiency; net income/total assets. |
| ROI (%) | 12.75 | -4.5 | -7.5 | Aligns with ROA; return on invested capital in BTC/software. |
| Debt/Equity | 0.16 | 0.25 | 0.30 | Low leverage; supports BTC strategy without excessive risk. |
| Interest Coverage | 5.2 | 1.5 | 0.8 | Adequate coverage post-2024 gains; EBIT/interest expense. |
ROE surged in 2024 due to unrealized BTC appreciation, calculated as Net Income / Average Shareholders' Equity. ROA = Net Income / Total Assets, highlighting BTC's role in boosting returns despite flat software assets.
Debt Analysis
Total debt stands at $8.21 billion (2024), primarily convertible notes for BTC buys. Debt/Equity ratio of 0.16 indicates conservative leverage, with current ratio at 0.68 signaling short-term liquidity pressure from BTC focus. Interest coverage improved to 5.2x in 2024, mitigating default risk amid rising rates. Strategies include ATM equity sales to repay debt.
3. Market Analysis
Stock Performance: Last 12 Months
MSTR delivered 43.55% returns over the past 12 months (October 2024–October 2025), far outpacing benchmarks. 52-week high: $473.83 (November 2024); low: $112.00 (October 2024). Current price: ~$296.76, with YTD loss of -1.12%.
Volatility and Benchmark Comparison
Annualized volatility: 114.6% (MSTR) vs. 20.5% (NASDAQ) and 15.2% (S&P 500), driven by BTC correlation (beta ~3.0 to BTC). MSTR outperformed S&P 500 (+71% vs. +16%) and NASDAQ over 12 months, but with 7x the volatility.
Sharpe ratio: 1.82 (MSTR) vs. 0.92 (S&P 500), indicating superior risk-adjusted returns.
Competitors and Market Position
In Business Intelligence software, Strategy holds ~1.19% market share, trailing Microsoft Power BI (19.85%) and Tableau (16.11%).
Key competitors: Tableau (Salesforce), Qlik, IBM Cognos, Oracle BI, and Power BI. Strengths include scalability and mobile BI; weaknesses are higher complexity vs. user-friendly rivals.
As a BTC holder, it leads corporates (e.g., vs. Tesla's ~11,000 BTC), positioning MSTR as a unique hybrid: BI challenger with crypto dominance (~3% of BTC supply).
4. Future Outlook
Growth Forecasts: 2025–2028
Analysts project 5–10% annual BI revenue growth to $550M by 2028, driven by AI integrations. BTC holdings could reach 1M+ via 21/21 Plan, implying 20–50% stock upside if BTC hits $150K (base case: $400–$600/share by 2028). EPS growth: 1557% in 2025, stabilizing at 15% CAGR. Overall revenue: $500M–$600M by 2028, with net income tied to BTC (projected $10B+ if holdings appreciate 30% annually).
Expansion Plans, Acquisitions, and Initiatives
- 21/21 Plan: $42B raise for BTC buys; recent $2B preferred stock offering targets Q1 2026.
- Acquisitions: Potential in blockchain/BI (e.g., mobile analytics firms); no major 2025 deals announced.
- Initiatives: Launch of Bitcoin-linked securities; expansion into APAC BI markets; AI enhancements like Strategy One for predictive analytics.
Potential Risks and Mitigation
- Risks: BTC volatility (80% drawdown potential); dilution from equity raises; regulatory scrutiny on crypto holdings; BI competition eroding 1–2% share annually.
- Mitigation: Diversified revenue (BTC as 90% value driver but software as stabilizer); debt refinancing via ATM sales; hedging via futures/options with its BTC hoard for market influence.
Scenario analysis: Base (BTC +20%/yr) yields 25% IRR; bear (BTC -30%) limits downside to 15% via operational cash.
5. Conclusion
Overall Assessment and Investment Potential
Strategy Inc. exemplifies a high-conviction, transformative play: a BI stalwart amplified by Bitcoin's asymmetric upside. With $84.15B market cap trading at an 18% premium to its $71.3B BTC holdings—factoring in ~$500M annual fixed costs, salaries for 1,530 employees, and BI IP—the firm offers leveraged exposure without direct crypto custody risks. Historical 1,620% returns since 2020 validate Saylor's vision, outperforming S&P 500 by 22x. Potential is strong for 2025–2028 if BTC adoption accelerates, with ROE/ROA signaling efficient capital deployment.
Investor Recommendations
Buy/Hold for Growth-Oriented Portfolios: Target $400–$500 by end-2026 (20–50% upside) on BTC momentum; allocate 5–10% for high-risk tolerance.
Strengths: BTC treasury (market influence via derivatives); resilient 70% margins; innovation (340 patents).
Weaknesses: Revenue stagnation (-3.2% CAGR); volatility (114% vs. 20% benchmarks); dilution risk (74% YTD BTC yield via shares).
Conservative investors: Monitor Q4 2025 earnings (Oct 30) for BTC yield updates; diversify with S&P 500 ETFs.
This is not financial advice—consult professionals.
MSTR - legendary cypher Possibly going for final test of key trend line and historic S/R zone one more time... but who knows. Love the massive ascending triangle into ATH.

Difference Between Forward and Futures Forex Markets1. Definition and Basic Concept
Forward Market:
A forward forex contract is a private agreement between two parties to buy or sell a specific amount of a currency at a predetermined rate on a future date. It is a customizable contract where the terms—such as amount, delivery date, and exchange rate—are negotiated directly between the buyer and the seller.
Futures Market:
A futures forex contract, on the other hand, is a standardized agreement traded on an organized exchange (such as the Chicago Mercantile Exchange - CME) to buy or sell a currency at a set price on a specific future date. Futures contracts are governed by exchange rules and are not negotiable between individuals.
Example:
If an Indian importer knows they must pay $1 million in three months, they can lock in today’s rate with a forward contract negotiated with their bank. Alternatively, they could use a futures contract on the exchange to hedge the same exposure, but under standardized terms.
2. Trading Venue and Regulation
Forward Market:
The forward forex market is Over-the-Counter (OTC), meaning trades occur directly between parties—usually through banks, brokers, or large financial institutions. It is unregulated compared to futures markets, giving flexibility but also introducing counterparty risk.
Futures Market:
Futures contracts are traded on regulated exchanges, ensuring transparency, standardized contract sizes, and proper oversight by authorities such as the Commodity Futures Trading Commission (CFTC) in the U.S. This makes the futures market more secure and trustworthy for investors.
Key Difference:
OTC forward markets offer privacy and customization, whereas futures markets emphasize standardization, regulation, and transparency.
3. Contract Customization
Forward Market:
Forward contracts are fully customizable. Parties can decide the exact amount, currency pair, settlement date, and method of delivery. This flexibility suits businesses and institutions with specific hedging needs.
Futures Market:
Futures contracts are standardized in terms of contract size, maturity dates (e.g., March, June, September, December), and settlement procedures. Traders must accept these fixed terms, which can limit flexibility but make trading easier for speculative purposes.
Example:
A company wanting to hedge €2.5 million in three months can easily set that amount in a forward contract. In contrast, a futures contract might have a fixed lot size (say, €125,000 per contract), so the company would need to trade multiple contracts to approximate the desired amount.
4. Settlement and Delivery
Forward Market:
Settlement occurs on the agreed future date, and most forward contracts end in actual delivery of the currencies. However, some may be settled in cash based on the difference between the agreed rate and the spot rate at maturity.
Futures Market:
Most futures contracts are cash-settled before expiry, as traders often close their positions before the delivery date. Only a small percentage result in physical delivery of the currencies.
Key Point:
Forwards typically end with physical delivery, while futures are mainly used for speculation and hedging without actual currency exchange.
5. Counterparty Risk
Forward Market:
Since forwards are private agreements, there is a high counterparty risk—the possibility that one party may default on the contract. There is no intermediary guaranteeing the trade.
Futures Market:
Futures contracts eliminate counterparty risk because the exchange clearing house acts as the intermediary, guaranteeing that both sides meet their obligations. Traders must maintain margin accounts to manage default risk.
Result:
Futures offer greater security due to exchange-backed settlement mechanisms.
6. Mark-to-Market and Margin Requirements
Forward Market:
Forward contracts are not marked to market, meaning profits or losses are realized only at the contract’s maturity. No margin or daily settlement is required.
Futures Market:
Futures contracts are marked to market daily, meaning gains and losses are settled every trading day. Traders must maintain margin accounts (initial and maintenance margins) to cover potential losses, ensuring market integrity.
Example:
If the exchange rate moves unfavorably in a futures position, the trader must deposit additional funds to maintain their margin. In forwards, the loss or gain is realized only at the end.
7. Liquidity and Market Participants
Forward Market:
Liquidity in forwards depends on the specific currency pair and the parties involved. It’s dominated by banks, multinational corporations, and institutional investors seeking to hedge specific exposures.
Futures Market:
The futures market is highly liquid due to standardized contracts and participation from a wide range of players—hedgers, speculators, and institutional traders. Continuous trading ensures tight spreads and efficient pricing.
In summary:
Forwards serve mainly for hedging; futures attract both hedgers and speculators due to liquidity and transparency.
8. Purpose and Usage
Forward Market:
Primarily used for hedging long-term exposures. Forwards protect against adverse currency movements for future transactions like exports, imports, or loans in foreign currencies.
Futures Market:
Used for both hedging and speculation. Hedge funds and traders use futures to profit from short-term price movements in currency pairs or to manage portfolio risk efficiently.
Example:
A corporate treasurer uses forwards to hedge a future payment, while a speculator might use futures to bet on the dollar strengthening against the euro.
9. Pricing and Cost Structure
Forward Market:
Forward prices are determined by the interest rate differential between the two currencies and the current spot rate. There are no exchange fees, but the pricing may include a bank’s spread or commission.
Futures Market:
Futures prices are also influenced by interest rate differentials but may deviate slightly from forward rates due to daily margin settlements and market expectations. Traders also pay exchange and brokerage fees.
Key Insight:
Forward pricing is customized and negotiated privately, while futures pricing is transparent and visible on exchanges.
10. Transparency and Accessibility
Forward Market:
Forward markets are less transparent, as prices and deals are not publicly available. Only large players like banks and corporations typically participate due to the high transaction size.
Futures Market:
Futures markets are highly transparent. Prices, trading volumes, and open interest data are publicly available in real time, enabling fair competition and analysis for all traders.
Final Comparison:
Transparency in futures ensures fairness and easier access for retail and institutional investors, while forwards remain largely institutional and relationship-based.
Conclusion
While both forward and futures forex markets allow participants to hedge or speculate on future currency movements, their structure, purpose, and participants differ greatly.
Forwards offer customization and flexibility but come with higher counterparty risk and limited liquidity.
Futures provide standardization, security, and transparency, making them ideal for speculative trading and risk management in a regulated environment.
In summary:
Aspect Forward Market Futures Market
Trading Venue OTC (Private) Exchange-Traded
Customization Fully customizable Standardized
Regulation Unregulated Regulated
Settlement On maturity Daily (mark-to-market)
Counterparty Risk High Minimal
Participants Corporates, Banks Traders, Investors
Transparency Low High
Liquidity Moderate High
Margin Requirement None Required
Usage Long-term hedging Hedging & speculation
MSTR Looking at the marco charts, this looks like a classic wyckoff accumulation bottom. Typically at these zones, theres no confidence sentiment in hopes of the stock market to fully recover. Prehistoric data has shown these are the best times to start buying into the fear & uncertainty.
With bloody interest rates dropping, this might create an upwards short term inverse affect on assets before the whole house crashes

MSTR LongThe broader market structure on MSTR (15-minute) remains bearish, characterized by a series of lower highs and lower lows. The most recent Break of Structure (BOS) occurred around $309.34, confirming continuation to the downside after price failed to sustain above prior support. No Change of Character (CHoCH) has yet formed, meaning the downtrend remains intact, though short-term corrective movement is underway as price consolidates above a minor demand zone.
The upper supply zones between $323–$330 remain strong, as each previously caused sharp declines with little to no bullish defense—evidence of significant selling pressure. Sellers were clearly aggressive here, leaving inefficiency and unmitigated zones overhead that could attract price for liquidity before a continuation lower. The nearby demand zone between $306–$308 shows initial signs of buyer interest; price rebounded from this area with a brief impulse, suggesting temporary absorption, but it’s still relatively weak given the speed and strength of prior declines.
Within the marked region, price is currently pulling back toward the $308 demand, and the reaction there will determine the next leg. If buyers defend that zone again, we can expect a short-term bounce targeting $320–$323, where the next layer of supply awaits. However, failure to hold above $306 would invalidate this corrective move and re-open downside targets toward $295–$292, aligning with the lower demand area.
From a footprint analysis perspective, recent candles likely show a mild uptick in positive delta as buyers attempt to build a base, but the overall delta profile still favors sellers—suggesting buy absorption rather than true initiative buying. Expect heavier negative delta if price re-enters supply, confirming that sellers remain in control.
Trade bias: short-term bullish correction within a broader bearish trend. Expect a reaction higher from $308–$306 into $320–$323, followed by potential continuation down.
Invalidation: a clean break below $306, which would negate any bullish retracement.
Momentum: mildly favors buyers in the near term but remains dominated by sellers on the higher structure.

Aggressive Bitcoin Strategy Could Propel GainsCurrent Price: $304.79
Direction: LONG
Targets:
- T1 = $320.00
- T2 = $340.00
Stop Levels:
- S1 = $295.00
- S2 = $280.00
**Wisdom of Professional Traders:**
This analysis synthesizes insights from thousands of professional traders and market experts, leveraging collective intelligence to identify high-probability trade setups. The wisdom of crowds principle highlights consensus opportunities in MicroStrategy, particularly due to its hybrid positioning as a software company and a proxy for Bitcoin exposure, which continues to be a driving factor in its stock price movements.
**Key Insights:**
MicroStrategy’s aggressive accumulation of Bitcoin has made it a unique blend of tech stock and crypto play. The company’s recent disclosures indicate it holds over 160,000 BTC as of October 2025, with purchases funded through debt instruments and internal cash flow. Analysts highlight that MicroStrategy is positioned to benefit from the upcoming Bitcoin halving event in Q2 2026, which historically precedes significant BTC price appreciation.
As institutional interest resurges in cryptocurrencies, the company’s strategic positioning could pay off in spades. However, traders remain cautious of any adverse regulatory developments or major crypto sell-offs, as these have historically been double-edged risks for MicroStrategy’s stock. On technical grounds, the breakout above the $300 resistance shows promising bullish momentum, suggesting further upside if the stock sustains above this threshold.
**Recent Performance:**
MicroStrategy stock has demonstrated resilience, rising 12% over the last 30 days as Bitcoin reclaimed the critical $30,000 mark. The firm’s aggressive BTC accumulation strategy has led to renewed investor confidence amidst broader optimism in the crypto space. The stock corrected slightly during September but bounced from the $280 support zone, forming a bullish engulfing pattern that indicates substantial buying interest in current price levels.
**Expert Analysis:**
Technical analysts identify MicroStrategy’s recent move above the 200-day moving average as a crucial turning point for sustained upward momentum. The RSI currently sits at 63, suggesting moderate bullish strength without entering overbought territory. Key resistance levels at $320 and $340 present initial profit-taking zones, while the $280 support continues to act as a floor for downside protection.
Fundamentally, analysts project that MicroStrategy’s Bitcoin holdings could appreciate significantly in value if BTC resumes its historical trend post-halving. The firm’s operational software business also provides baseline revenue stability, reducing downside risk relative to pure cryptocurrency plays. However, traders should remain aware of leverage risks and potential BTC volatility, which could disrupt momentum in the short to medium term.
**News Impact:**
Recent headlines around potential Bitcoin ETF approvals globally are spurring renewed buying interest across the crypto space, including companies with significant BTC holdings, such as MicroStrategy. CEO Michael Saylor’s unwavering stance on Bitcoin has further enhanced the firm’s reputation among crypto-focused investors. Additionally, MicroStrategy’s strategic financing operations, minimizing shareholder dilution, are being viewed favorably by institutional investors anticipating double-digit returns into 2026.
**Trading Recommendation:**
MicroStrategy’s bullish momentum, fueled by both technical strength and macro tailwinds in cryptocurrencies, makes it an attractive long proposition at current levels. Holding above $300 while targeting upside to $320 and $340 allows traders to capitalize on the stock’s breakout potential. Aggressive investors may consider positioning for further gains as Bitcoin adoption accelerates globally. With strong support at $280 limiting risk, this trade offers a favorable risk-reward setup in the medium term.
Do you want to save hours every week? Register for the free weekly update in your language!

$MSTR Swing Trade Setup: Layered Short Entries on Breakout📉 MSTR "STRATEGY INC" STOCK – Bearish Thief Plan (Swing/Scalp Setup)
⚡ Trade Setup (Bearish Pending Order Plan)
Asset: NASDAQ:MSTR (MicroStrategy Inc.)
Plan: Bearish (waiting for support breakout confirmation).
Entry Zone:
Pending breakout entry @ 320.00 ⚡
Layered “Thief” Strategy (scaling entries):
Sell Limit Layers: 340.00 / 330.00 / 320.00
You may add or adjust layers based on your own risk tolerance.
🔔 Set TradingView alerts at breakout levels to track price action.
Stop Loss (Thief Style):
Protective SL @ 360.00 (after breakout confirmation).
Adjust per your strategy & risk management.
Target Zone (Exit):
Police barricade support @ 290.00
Note: Take profit is discretionary — escape with profits at your own chosen level 🚪💰.
🔑 Why This Plan? (Thief Strategy Context)
The Thief Plan = using multiple layered limit entries after a breakout for better risk/reward.
Scaling entries gives flexibility while reducing FOMO and chasing.
Exit early at support barricades or oversold traps.
📊 MicroStrategy (MSTR) Market Data Report
As of September 7, 2025
1. Retail & Institutional Sentiment 🤝
Retail: Mixed / cautious (crypto exposure volatility).
Institutional: Neutral → slightly bearish (Bitcoin correlation + regulatory risk).
Estimated Sentiment: 55% Neutral / 30% Bearish / 15% Bullish.
2. Fear & Greed Index 😨😋
Current level: Neutral ~50/100
Suggests balanced emotions → no extreme greed or fear.
3. Fundamental & Macro Scores 📈📉
Fundamental ~60/100: MSTR tied to Bitcoin trends, highly volatile.
Macro ~55/100: Pressures include crypto regulation, tech volatility, interest rates.
Bitcoin remains the key driver.
4. Market Outlook 🐂🐻
Bull Case: BTC rally → MSTR boost, institutional adoption helps.
Bear Case: Regulatory clampdowns, BTC volatility → downside pressure.
Overall: Neutral → Slightly Bearish (short-term caution).
🚀 Key Takeaways
NASDAQ:MSTR moves in sync with Bitcoin → monitor BTC charts closely.
Sentiment is not strongly bullish → short setups have edge here.
Thief layering strategy aligns with volatility.
Always respect SL & manage risk 🔐.
🔗 Related Pairs to Watch
BITSTAMP:BTCUSD
NASDAQ:COIN (Coinbase)
NASDAQ:RIOT (Riot Platforms)
NASDAQ:MARA (Marathon Digital)
SP:SPX / NASDAQ:NDX (macro impact on tech/crypto plays)
✨ “If you find value in my analysis, a 👍 and 🚀 boost is much appreciated — it helps me share more setups with the community!”
#MSTR #MicroStrategy #Stocks #SwingTrade #Scalping #BearishSetup #CryptoStocks #LayeredStrategy #ThiefPlan #BitcoinCorrelation #TradingViewIdea
