TSLA – Mild Pullback Before Resuming Its Upward TrajectoryHello everyone,
Tesla (TSLA) is showing a healthy technical pullback after an impressive rally, yet the broader bullish trend remains intact. The stock is currently hovering around $438.69, down 4.5% in the latest session — a move that reflects short-term profit-taking rather than a shift in market sentiment.
On the news side, Tesla has just unveiled lower-cost versions of the Model 3 and Model Y — a strategic decision aimed at expanding its mid-range customer base. However, the market’s reaction has been somewhat cautious, possibly due to concerns over shrinking profit margins as prices drop. Nevertheless, this move allows Tesla to strengthen its global footprint and improve competitiveness, particularly in key markets like China and Europe.
At the same time, the company continues to advance its Full Self-Driving (FSD) technology and the Robotaxi project — seen as Tesla’s long-term growth pillars. Once fully realised, autonomous mobility services could unlock significant recurring revenue, reinforcing investor confidence even amid short-term corrections.
From a technical perspective, the 4H chart indicates that price remains well above the Ichimoku cloud, confirming that the uptrend still dominates. Shallow Fair Value Gaps (FVGs) have been filled, hinting that price might retest support before rebounding. The $430–$420 area serves as a critical support zone, while resistance stands near $440 and $445. A clear breakout above $440 could open the path toward $450–$460.
Overall, Tesla appears to be consolidating within a natural pause rather than reversing. As long as the $420 level holds, the bullish structure remains valid.
What about you — do you see this pullback as a springboard for new highs, or the start of a longer consolidation phase for TSLA?
TSLA trade ideas
Tesla - The massive triangle breakout!🪩Tesla ( NASDAQ:TSLA ) is breaking out:
🔎Analysis summary:
Last month, we witnessed an incredible but expected rally of about +35% on Tesla. Furthermore, with this move Tesla is attempting to break above the previous all time highs. After bullish confirmation, this would also lead to a massive triangle breakout.
📝Levels to watch:
$400
SwingTraderPhil
SwingTrading.Simplified. | Investing.Simplified. | #LONGTERMVISION

Take a bullish position on Tesla as price action shows strong up
Current Price: $413.49
Direction: LONG
Targets:
- T1 = $437.00
- T2 = $459.00
Stop Levels:
- S1 = $405.00
- S2 = $396.00
**Wisdom of Professional Traders:**
This analysis synthesizes insights from thousands of professional traders and market experts who closely monitor Tesla’s performance and future outlook. Collective wisdom heavily emphasizes Tesla’s innovative edge in the electric vehicle (EV) industry and its expanding lead into key growth sectors such as autonomous driving and energy storage. Traders see Tesla not only as a market leader but as a company with significant upside driven by its ability to announce game-changing technological advancements and strategic global expansions. The consensus suggests that Tesla’s ongoing operational improvements and rising demand have positioned it as a solid buy.
**Key Insights:**
Tesla’s robust fundamentals continue to drive optimism among professional traders. The company has successfully increased production capacity in 2025. Recent updates regarding its next-generation vehicle platform, dubbed "Project Titan", have reinforced confidence in long-term growth potential. The expanded Gigafactory projects in Mexico and Indonesia are helping to reduce unit costs, which traders believe will scale profitability and sustain earnings growth over several quarters. Analysts are also eyeing Tesla’s significant advancements in artificial intelligence applications, particularly its Full-Self Driving (FSD) suite, which might unlock tremendous recurring revenue streams like subscriptions.
Additionally, Tesla’s energy storage division is performing better than anticipated in 2025, directly contributing to revenue diversification. Traders argue that Tesla’s valuation is underpinned by its ability to integrate vertically across EV manufacturing, charging networks, and energy grids, making it more resilient to potential sector-wide downturns than its peers such as Rivian or Ford. Finally, technical indicators suggest bullish momentum reinforced by positive institutional inflows.
**Recent Performance:**
Over the last month, Tesla’s stock price has seen a notable rally. The stock has climbed approximately 10% since early September 2025, fueled by improving investor confidence from both retail and institutional participants. On the earnings front, Tesla’s Q3 2025 report released last week showed a 32% year-over-year increase in operating margins, surpassing consensus estimates. Key growth figures included over 20% jump in total vehicle deliveries and strong revenues from energy products. Such impressive performance confirms Tesla’s ability to scale production efficiently even while grappling with broader macroeconomic challenges.
**Expert Analysis:**
From a technical analysis perspective, Tesla appears poised for further upside. The Relative Strength Index (RSI) currently sits at 62, just on the cusp of being overbought, which suggests sustained bullish sentiment without yet showing overextension. The Moving Average Convergence Divergence (MACD) signals strong upward momentum, while Tesla is trading comfortably above its 50-day moving average of $398.25 and 200-day moving average of $376.00. Market observers are targeting a breakout above $420 as a critical resistance point, after which the stock could potentially push towards the $450 level.
Experts are also discussing Tesla’s valuation, which trades at a forward P/E multiple of 41—a premium to other automakers but justified by its superior growth trajectory. Analysts believe this premium valuation reflects Tesla’s several-layered optionality, including its disruptive position in both industry-leading technology and renewable energy solutions.
**News Impact:**
Recent headlines further bolster positive sentiment around Tesla. In early October 2025, Tesla announced final upgrades to its battery technology, revealing a solid-state prototype that could significantly extend range and durability compared to lithium-ion alternatives. Moreover, CEO Elon Musk’s comments during the last conference call pointed toward laser-focused execution on its next-gen product lineup and growth in emerging markets like Latin America. Further, discussions around government subsidies for EV adoption in Europe and tax incentives in the U.S. continue to create a more favorable electoral outlook for Tesla as it remains a pivotal player in the global EV race.
**Trading Recommendation:**
Based on Tesla's strong fundamental performance, bullish technical indicators, and its ability to expand capably in multiple verticals, taking a LONG position is recommended. The stock’s momentum suggests potential growth over the coming weeks, especially with Q3 earnings validation and positive news flow supporting investor sentiment. Traders should look for a breakout above $420 with a short-term upside target of $437 followed by $459 in the next leg of its rally. Implementing stops at $405 and $396 ensures risk management against market volatility, while remaining positioned for sizable gains.
Do you want to save hours every week? register for the free weekly update in your language!

TSLA BULLISH OCT 9 2025There is a lot of bullish momentum in Tesla at current price. Price action is always superior .
If you dont understand a trade then dont enter in it trusting me or any stranger as this is your hard earned money. Missing a trade is not the end of the world.
Its a trade so,
STOP LOSS means Stop my loss
Trade:
Entry- curren price
SL-$416 close
Target-$460 min

TSLA maybe retest support near 360$ but target is 700$Price is near channel resistance and red trendline sell pressure zone so we can expect short-term fall here like the red arrow but soon after that short-term fall we can expect heavy gain here like the green arrow on chart and targets like 600$ and more also if the red trendline break valid to the upside without that correction target can hit.
DISCLAIMER: ((trade based on your own decision))
<<press like👍 if you enjoy💚
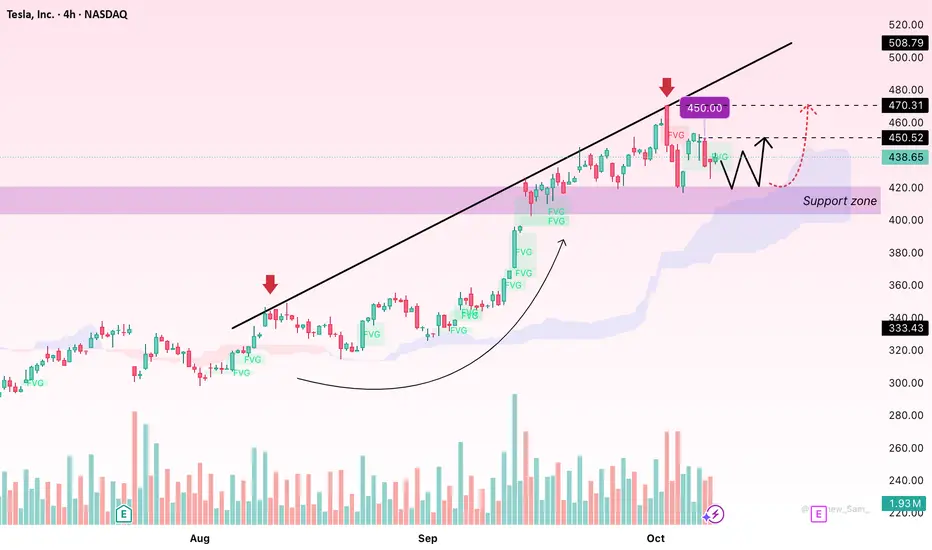
Breakout Incoming!Tesla remains within a well-defined channel range, consolidating near lower channel support on declining volume, which reflects healthy consolidation after prior momentum. The recent action has formed a symmetrical triangle, with price compressing between rising support and descending resistance — a classic setup for a volatility squeeze and potential breakout.
Despite short-term weakness, TSLA has consistently held above prior support levels within the channel. With bullish sentiment building ahead of earnings, it’s unlikely the stock breaks below existing support (~$416–$420).
The key resistance to watch is at $455, aligning with the upper boundary of the current structure. A decisive breakout above this level could trigger a move toward $470, which coincides with the previous high and marks a potential continuation of the bullish trend.
Notably, the price breakout between September 11 and September 22 offers a useful reference; that move demonstrated TSLA’s ability to accelerate rapidly once volume returns and resistance levels are cleared - this stock is a freight train once it gets moving.
Given the technical compression, low-volume consolidation, and improving sentiment, I’d expect a breakout as early as tomorrow or early next week, especially as we lead into earnings.
Key Levels:
• Support: $416–$420
• Resistance: $455 (breakout trigger)
• Target: $470+ (prior high / upper channel objective)
• Future Target: Liftoff?

Why Most Prop Traders Fail (Even the Skilled Ones)When speaking with Prop Traders, we have found the issue was not about
bad setups; it’s emotions under pressure that is the problem
Fear after a loss. Greed after a win.
That’s when discipline slips and accounts die.
Here’s what helps:
Before each session, ask ?
“Would I take this trade if I weren’t trying to prove something?”
This one question has saved more accounts than any indicator
I’ve been helping traders stay calm when it matters most.
If you’ve ever blown up knowing exactly what you should’ve done, DM me and I’ll show you what’s been working.
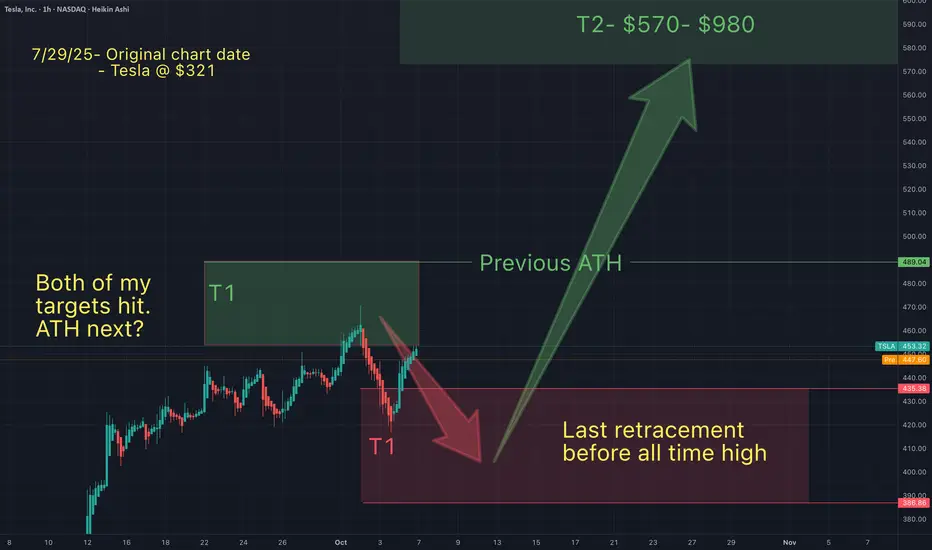
You will ask yourself "how did he know Tesla would do that"?On July 29th I suggested Telsa would follow a predicatble path. Price action has unfolded as anicipated every step of the way.
After a long run up, on Oct 1st I suggested that Tesla had topped at my green T1 and would retrace into my red support zone and bonce.
Now that this has played out, the only question that remains is Tesla going lower into my red T1...or simply all time highs from here?
Either way, Tesla may be about to melt faces (few & small retracements). For the next 2-10 weeks Tesla may form a blow off top (*"IF" Telsa continues this pattern). This blow off, will be the end of this bull pattern that I have been following since the April lows. Once Tesla hits my next range ($570-980) I expect a huge dump. I will monitor price action closely, once Tesla is in this next range.
May the trends be with you.
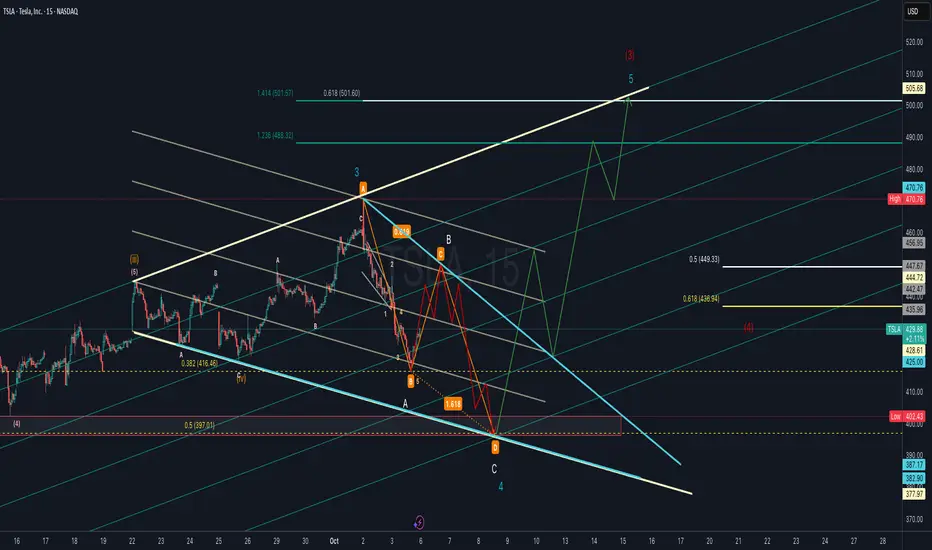
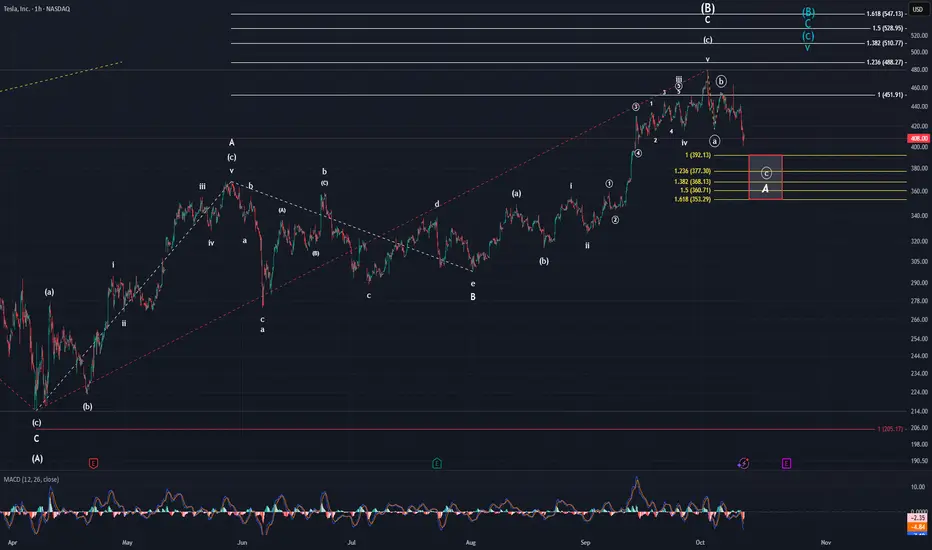
TSLA Elliott Wave Count with ABC Harmonic or Flat Corrective Tesla (TSLA) is forming a potential Wave 4 correction that aligns with an ABC harmonic structure. Price action suggests a possible deeper retracement into the 0.5–0.618 Fibonacci support zone (436–449 area) before resuming its larger uptrend.
If Wave 4 completes near the harmonic “D” zone (highlighted support box), the next leg higher could target the 1.236–1.414 Fibonacci extensions around 488–501, in line with Wave 5 projection.
Key levels to watch:
Support: 436.9 (0.618 retrace), 425 psychological, 397 strong support.
Resistance: 444.7, 470.8 (previous high), 501–505 (Wave 5 target).
Bullish scenario: Wave 4 completes soon, leading to a strong Wave 5 breakout towards 500+.
Bearish scenario: Breakdown below 425–397 support could invalidate the bullish count and extend correction lower.
The other possibility is that it is actually unfolding a flat correction in Wave 4 after completing Wave 3 near the recent high. The structure suggests price may continue to consolidate within the corrective channel before setting up the next impulse leg.
Bullish scenario: Flat correction completes, setting the stage for Wave 5 rally toward 490–505.
Bearish scenario: Breakdown below 397 invalidates the bullish count and signals deeper retracement.
Tesla Correction ahead ? - Levels to be aware Of !In this video I present to you the idea of a Tesla correction into the 340/350USD price zone .
I mark out a potential short setup as well as a strong area for longs/accumulation.
Tools used TPO chart, Fibs, Anchored V wap , Volume Profile, Parallel channels
Good luck with your trading and thanks for your support

SMA 20: The most used, simple, and useful indicatorThe 20-period Simple Moving Average ( SMA 20 ) is easy to calculate and widely used, though often undervalued by traders eager for novelty. Its presence is notable in popular technical indicators like Bollinger Bands and Donchian Channels. Even the most purist price action traders include it on their charts, valuing its ability to identify trends and key support and resistance levels. Today, I want to explore the practical uses traders can derive from this versatile indicator.
Behavioral Patterns
Technical Analysis emerged from the detection and study of repetitive patterns or phenomena. These patterns are intrinsically tied to investor psychology, and their influence on decision-making is fundamental.
Repetitive patterns around an SMA 20 typically indicate that a trend has strength and stability, attracting investors and paving the way for highly effective systems or methodologies. One of my favorites involves identifying entry points in strong trends that have clearly respected the SMA 20.
Figures 1 and 2 illustrate this type of approach:
Figure 1:
Figure 2:
Price Overextensions
A price overextension in trading refers to an extreme price movement that significantly deviates from its average or reference level. This phenomenon often indicates that the price has moved too far, too fast in one direction (bullish or bearish) over a short period, suggesting a potential reversal or correction.
The SMA 20 is extremely useful for visually detecting these phenomena. Moreover, when trading in high-volatility contexts like overextensions, the SMA 20 can serve as a safe exit zone.
In Figure 3, you can observe how the price extends twice, significantly diverging from the SMA 20. The first overextension wouldn’t have been sufficient for an entry, but the second overextension generated a clear bearish divergence, which, combined with price action, would have validated a short entry.
The SMA 20 is a discreet target for taking profits without excessive exposure. This leverages a widely applied statistical concept in markets: mean reversion.
Figure 3:
Breakout Trading
Breakout trading involves entering the market when an asset’s price breaks through a key support or resistance level, with the expectation that the movement will continue in the breakout direction.
A price action phenomenon that significantly increases the likelihood of a successful breakout is pre-breakout tension , a state of compressed supply and demand characterized by a narrow range, low volatility, and order accumulation at key levels.
The SMA 20 is extremely useful for clearly identifying the dominance between buying and selling forces, as well as visually highlighting pre-breakout tension.
In Figure 4, I use a 20-period Exponential Moving Average (EMA 20) to increase sensitivity to the indicator’s changes.
Notice how the EMA 20 seems to compress the price against the range’s boundaries, as if trying to push it out.
Figure 4:
Retest Patterns
A retest occurs when, after breaking a significant support or resistance, opposing forces push back to test the strength of the prior level.
In Figure 5, you can see how, after a bearish breakout from an exhaustion pattern, bulls attack strongly but encounter resistance at what was previously a breached support. An SMA 20 aligned with this zone increases the level’s robustness, which is defended by sellers who see an excellent profit opportunity.
Figure 5:
Figure 6 shows an opposite example.
Figure 6:
Conclusions
With this brief overview, I aim to demonstrate that it’s not necessary to rely on novel or complex technical indicators to make sound market decisions. In Technical Analysis, simplicity, combined with deep understanding, often yields significant results.
Final Note
If you’d like to take a look at my analysis record, you can find my profile in Spanish, where I transparently share well-defined market entries. Send your good vibes if you enjoyed this article, and may God bless you all.
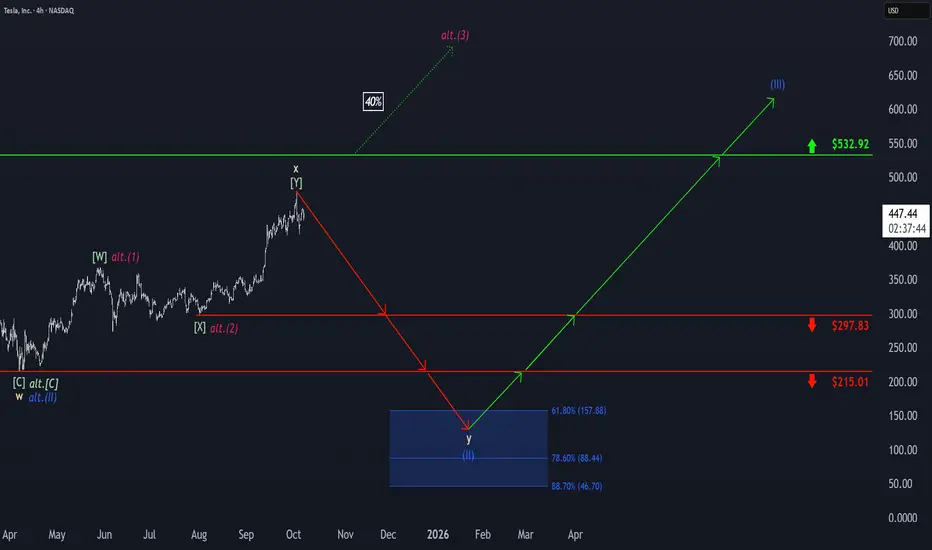
Tesla: Top Established!Tesla initially hit a new high before quickly reversing course with a notable move to the downside. As a result, we now view the corrective upward movement of beige wave x as complete and anticipate further sell-offs as part of wave y. The stock is expected to gradually break below the support levels at $297.83 and $215.01, ultimately reaching our blue Target Zone between $157.88 and $46.70, which we have identified for the final corrective low of blue wave (II). However, there remains a 40% chance that TSLA will not reach the blue zone at all but instead will break out directly above resistance at $532.92. In this case, we would consider blue wave alt.(II) already complete and locate the stock in a sustained (magenta) upward impulse. Even in our primary scenario, the new uptrend of the regular wave (III) is ultimately expected to surpass the $532.92 resistance.
TESLA 190 MERRY CHRISTMAS !!!PIVOT BACK TO 190 CHISTMAS RALLY !!!
PIVOT AND ANLYSIS
Merry christmas to al !!!
stay profitable !!!!

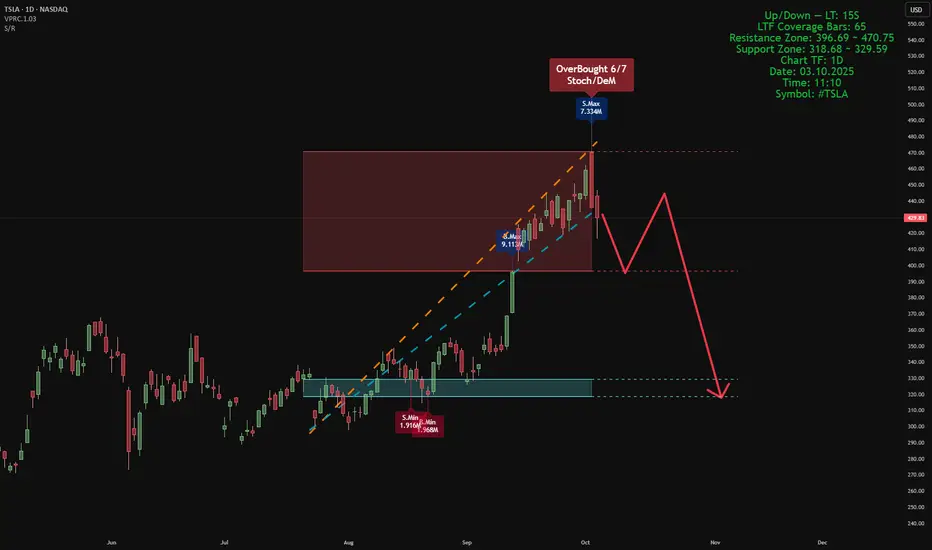
Smart Money Support/Resistance + ATAI Volume Analysis —PracticalApplication
When these two indicators work together — Smart Money Support/Resistance (Lite) and ATAI Volume Analysis with Price Action — the chart begins to speak a clearer language: one defines where the reaction zones form, and the other explains what happens inside them. The purpose is not prediction but understanding the balance between smart money pressure and retail momentum.
1. Parameter Alignment
On the right side of the chart, the green info panel confirms that both indicators share identical configurations. In this example, the lookback period is set to 52, chosen deliberately because it must be smaller than the total number of LTF coverage bars (65). For the Smart Money Support/Resistance indicator, the projection is set to 26 — extending the detected zones forward without adding excessive visual noise. This alignment is crucial; mismatched parameters can desynchronize volume readings and structural boundaries.
2. Reading the Chart
In this sample chart, the upper red area represents a Smart Money resistance zone — a region of concentrated selling pressure detected from lower timeframe volume. Simultaneously, ATAI Volume Analysis signals an Overbought (6/7) condition, meaning multiple oscillators confirm exhaustion while seller volume (S.Max) begins to outweigh buyer volume (B.Min). This overlap suggests that liquidity has shifted and the prior bullish impulse is weakening. From here, price may consolidate within the zone or initiate a structured retracement toward the blue support area, previously defined by accumulation volume. The red projected path simply visualizes one potential structural scenario; it is not a prediction or trade signal.
3. Broader Context
This example serves only as a demonstration of how these two tools interact when properly tuned. Different assets and timeframes naturally yield unique structures and behaviors, yet the principle remains consistent: define the territory first with Smart Money Support/Resistance, then interpret market behavior within it using ATAI Volume Analysis.
This content is for educational purposes only — not financial advice. User feedback and practical observations play a key role in refining future versions of both indicators.
TSLA SELL++++ $360-370 to be testedAs I posted last week, and, clearly too early TSLA needs to test the $370 range where it broke out from. I do pat myself on the back for the epic bounce off support at $324.80 that needed to hold to see $426's and TSLA always goes further then we think both ways. We're way overdone and todays reversal shows it. $370's imminent in coming weeks

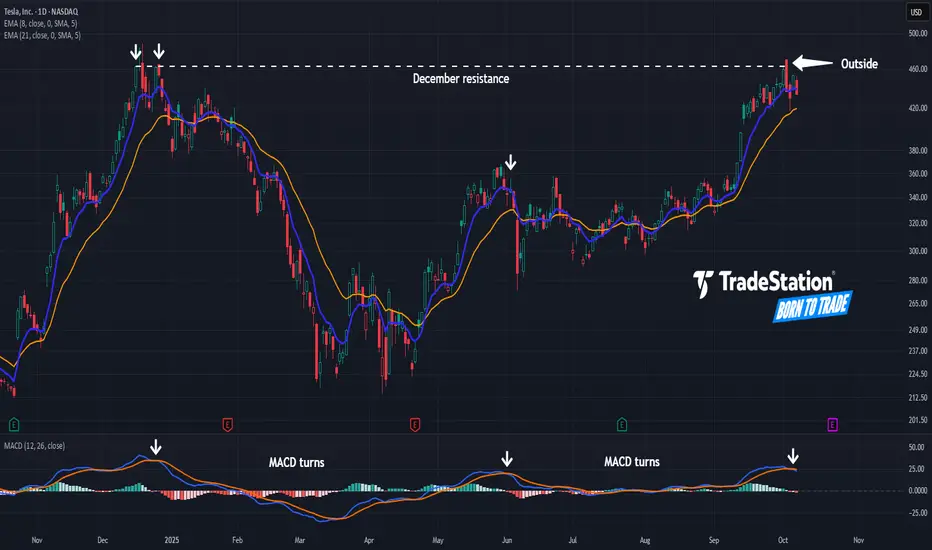
A Top for Tesla?Tesla ended the third quarter on a strong note, but some traders may see risk of the EV maker stalling.
The first pattern on today’s chart is the $463 price area. TSLA peaked at that level twice last December before reversing lower. Sellers appeared around the same level this month, which may confirm resistance is in place.
Second, the rejection day featured a higher high and lower low. That bearish outside candle is a potential reversal pattern.
Next, MACD has turned lower. Notice how previous downward reversals corresponded with deeper price declines. (Marked by white arrows in the lower study.)
Finally, TSLA is an active underlier in the options market. (Its average volume of 2.7 million contracts in the last month ranks first in the S&P 500, according to TradeStation data.) That could help traders take positions with calls and puts.
TradeStation has, for decades, advanced the trading industry, providing access to stocks, options and futures. If you're born to trade, we could be for you. See our Overview for more.
Past performance, whether actual or indicated by historical tests of strategies, is no guarantee of future performance or success. There is a possibility that you may sustain a loss equal to or greater than your entire investment regardless of which asset class you trade (equities, options or futures); therefore, you should not invest or risk money that you cannot afford to lose. Online trading is not suitable for all investors. View the document titled Characteristics and Risks of Standardized Options at www.TradeStation.com . Before trading any asset class, customers must read the relevant risk disclosure statements on www.TradeStation.com . System access and trade placement and execution may be delayed or fail due to market volatility and volume, quote delays, system and software errors, Internet traffic, outages and other factors.
Securities and futures trading is offered to self-directed customers by TradeStation Securities, Inc., a broker-dealer registered with the Securities and Exchange Commission and a futures commission merchant licensed with the Commodity Futures Trading Commission). TradeStation Securities is a member of the Financial Industry Regulatory Authority, the National Futures Association, and a number of exchanges.
Options trading is not suitable for all investors. Your TradeStation Securities’ account application to trade options will be considered and approved or disapproved based on all relevant factors, including your trading experience. See www.TradeStation.com . Visit www.TradeStation.com for full details on the costs and fees associated with options.
Margin trading involves risks, and it is important that you fully understand those risks before trading on margin. The Margin Disclosure Statement outlines many of those risks, including that you can lose more funds than you deposit in your margin account; your brokerage firm can force the sale of securities in your account; your brokerage firm can sell your securities without contacting you; and you are not entitled to an extension of time on a margin call. Review the Margin Disclosure Statement at www.TradeStation.com .
TradeStation Securities, Inc. and TradeStation Technologies, Inc. are each wholly owned subsidiaries of TradeStation Group, Inc., both operating, and providing products and services, under the TradeStation brand and trademark. When applying for, or purchasing, accounts, subscriptions, products and services, it is important that you know which company you will be dealing with. Visit www.TradeStation.com for further important information explaining what this means.
TESLA My Opinion! BUY!
My dear friends,
Please, find my technical outlook for TESLA below:
The instrument tests an important psychological level 413.27
Bias - Bullish
Technical Indicators: Supper Trend gives a precise Bullish signal, while Pivot Point HL predicts price changes and potential reversals in the market.
Target - 428.09
Recommended Stop Loss - 405.57
About Used Indicators:
Super-trend indicator is more useful in trending markets where there are clear uptrends and downtrends in price.
Disclosure: I am part of Trade Nation's Influencer program and receive a monthly fee for using their TradingView charts in my analysis.
———————————
WISH YOU ALL LUCK

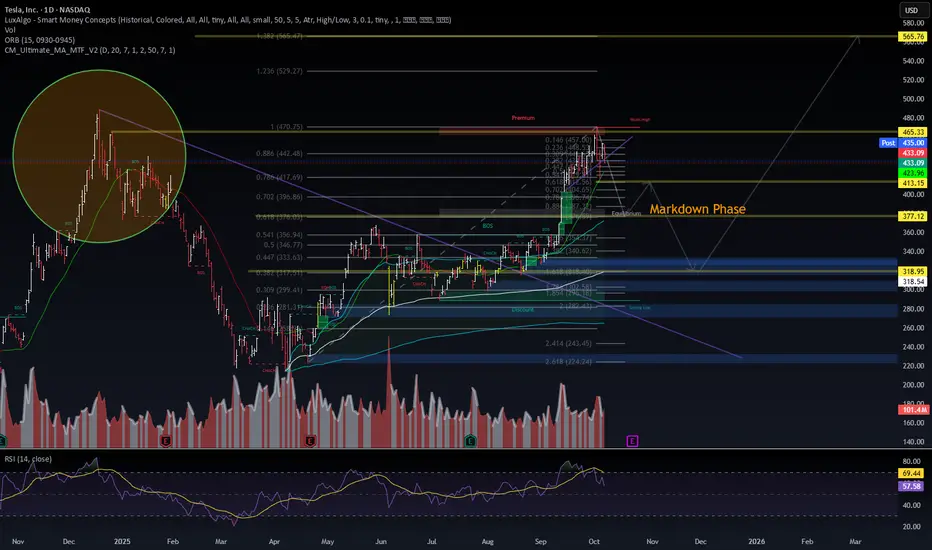
TSLA: My Final StrategyNASDAQ:TSLA ⚠️ Entering markdown phase.
Breakdown under 447 confirms structural weakness.
First liquidity target → 413 → 377, then 318 if macro risk expands.
VolanX DSS bias: 70% bearish. Only reclaim >465 flips trend.
#TSLA #VolanX #AITrading #WaverVanir #SmartMoneyConcepts
WaverVanir ⚡ To grow and conquer
Not Investment Advice
TSLA: ShortNASDAQ:TSLA ⚡ Coiling up in a symmetrical wedge right under equilibrium — a textbook indecision zone before expansion.
Still trading below premium structure → bias remains bearish unless we see a clean breakout and hold above 434.5.
Volume contracting, RSI midline hovering → pressure building for next leg.
🎯 Breakdown targets: 427 → 422 → 416
🚀 Bull case invalidation: Close above 434.5, targeting 444–450
🧠 VolanX DSS Bias: Bearish continuation, awaiting volatility trigger
#TSLA #VolanX #SmartMoney #LiquidityZones #PriceAction #AITrading #WaverVanir
Not Investment Advice

TeslaFriday was a rough day for anyone that was long...pretty much anything lol. There were a few tickers like MP that posted a green day, but they were far and few between. Tesla was no exception to this and closed down over $22. This should not have come as a surprise for anyone though. Maybe the magnitude in which the market turned downwards, but not that it did. I have been saying for 2-3 weeks that the top was near. that being said, although price tanked the way that it did, we technically do not have the confirmation needed for a top. Do I think it likely we have a top in place? Yes, I do. However, one cannot definitively say it is in for a fact. The absolute confirmation doesn't come until we can breach $368.33 unfortunately.
We will get clues and data pointing to a top on the way down though. The first thing I want to point out is that we have officially breached the last TWO wave 4's of a lesser degree. This in itself is a very good sign the top is in. Also, MACD made a new local low. When you look at the yellow fibs tracking the possible abc down, the 1.382 is just below that minor A wave top. This means over half of the standard target area for minute ((c)) of minor A is below the minor A high.
Another thing I want to point out is that in the overnights, Robinhood is showing Tesla trading @ $423 currently, and has raised as high as $425. This could be pointing to a couple things. The first is that the minute ((c)) wave is just subdividing into a smaller 3-wave pattern that will ultimately end within the target box to conclude minor A wave. The other is that Friday's low was the minute ((a)) wave low with ((b)) currently underway. Then lastly, it could be pointing to my ALT turquoise count that suggests another high to the low $500's is needed.
I do not like the turquoise count, but I cannot rule it out with 100% certainty yet, so it stays for now. The count that I favor is the white count, and ((c)) being carved out in three waves. Hopefully we get some clarifying data tomorrow, but if not, we should get some this week. For now, we continue observing. Should you not be able to help yourself and want to enter into a trade...use TIGHT stops. I am not a gambling man, so I will remain on the sidelines. Ultimately, I believe it is only a matter of time until we see price back into the $100's...
TSLA: TradeBear flag forming on 15-min — structure looks weak.
Liquidity sweep around 441 done, momentum fading.
If we lose 434, expect acceleration into deeper liquidity zones (possible 418 area).
RSI flattening, volume divergence visible — watch for breakdown confirmation.
No confirmation = short trap possible, but bias remains bearish until >441 reclaims.
#TSLA #Trading #TechnicalAnalysis #BearFlag #SmartMoneyConcepts #Stocks
Not Investment Advice

Is this Tesla / Palantir fractal showing both will hit ATH soon?Fractals are a mathmatical anomaly, if you understand linear equations (and believe the market is "random"). All assets are doing the same patterns over and over, on all time frames. You just need to see it for what it is.
May the trends be with you.

The 7 Killers That Make You Lose Money in TradingTrading isn’t easy; in fact, it’s one of the most complicated ways to make money in the financial world.
I know that’s not what the mainstream narrative tells you. The same narrative that warns “more than 90% of traders lose money” also sells the illusion that you’ll be part of the 10% who don’t, because deep down, we all think we’re different, smarter, faster, more capable than the crowd.
But if you strip away emotion and bias and read that statistic correctly, it’s a harsh truth: you have less than a 10% probability of long-term success. That’s not pessimism; that’s probability. And probability doesn’t lie. Every day, it quietly proves that most “special” traders end up broke, not because markets are unfair, but because they misread the numbers that could have saved them.
After more than 20 years in this game, I’ve noticed one thing every losing trader has in common: they ignore what’s painfully obvious. Trading is numbers in an uncertain world.
Numbers mean math. Put math in an uncertain environment, and the only way to handle it is through probability. Yet most traders fight this reality, chasing signals, news, or “gut feelings” instead of learning how probability actually runs the game.
After working with hundreds of losing traders, I found that this blindness leads to seven recurring mistakes: the same ones that keep the losing rate stuck above 90%.
1. Mistake: Trying to Predict Instead of Projecting
The moment you believe you need to know where the market’s going, you’ve already lost your edge. By definition, the future is uncertain; anything can happen. No system or algorithm can change that.
The game changes when you stop trying to predict what the market will do and start projecting how your account will behave under uncertainty. It’s not about guessing direction; it’s about managing outcomes.
Probability reminds us that uncertainty isn’t our enemy, it’s our playing field. Without it, there would be no opportunity. Don’t focus on prediction; learn to handle what the market does and control its impact on your account value.
📖 Referenced posts: “In a World of Chances, Probability is the King” and “The True Laser Vision in Trading.”
2. Mistake: Judging Success Trade by Trade
If you judge your system by a single trade, you’re missing the point. Trading isn’t a sprint; it’s a marathon. Your edge doesn’t live in one trade, it appears in the average of many.
Focusing on each result drags you into an emotional roller coaster, the highs of winning and the lows of losing. In reality, you’re not reacting to truth; you’re reacting to variance, and variance loves to mislead.
The real measure of your system (your expectancy) doesn’t care about your last trade. It only reveals itself after enough repetitions, as the law of large numbers smooths out noise and exposes your true average performance.
If you want peace of mind, stop zooming in on the moment. Zoom out and focus on the mean, the expected value of your account. That’s the mindset that turns emotions into data and chaos into clarity.
📖 Referenced posts: “Sharpening Your Trading Focus” and “Spying on Your Trading Future.”
3. Mistake: Not Accepting Losses as Part of the Process
I’ve seen it countless times: new traders obsessed with their win rate. Almost every candidate I’ve mentored asks the same question before hiring me: “What’s your winning rate?”
And I get it. In a world obsessed with prediction, it feels natural to think accuracy equals success. But that’s where I correct them: we’re not here to predict; we’re here to make money.
Instead of asking how often a trader is right, ask, “How much money does he keep after losses?” That’s the question that shifts focus from ego to expectancy, from being right to being profitable.
📖 Referenced posts: “Decoding Trading Odds: Demystifying Probability”.
4. Mistake: Misjudging Probability as Too Complicated
Many traders avoid thinking in probabilities because they believe it’s too mathematical. They prefer indicators because they seem easier and more visible. I get it, not everyone loves math. But in trading, probability isn’t complex theory; it’s practical logic.
Think about predicting the weather. When you see a small gray cloud, you don’t say, “It will rain.” You say, “It might rain.” That’s probabilistic thinking: assigning likelihood instead of claiming certainty.
Trading works the same way. Every trade is its own weather forecast. You can’t predict what will happen, but you can estimate what’s likely and prepare for both outcomes. Once you see probability as a decision framework, you stop reacting emotionally and start thinking strategically.
📖 Referenced posts: “In a World of Chances, Probability is the King” and “Decoding Trading Odds: Demystifying Probability.”
5. Mistake: Overleveraging Your Edge
Even with a profitable system, betting too big turns strategy into suicide. Leverage doesn’t just multiply gains; it magnifies mistakes. I’ve seen many good traders destroy solid systems because they couldn’t stay anchored to steady, safe growth. They wanted to accelerate the curve.
But here’s the truth: every time you increase position size, you also increase your risk of ruin exponentially. Great traders know success isn’t about how fast you can grow, but how long you can keep growing.
It’s even worse for traders who don’t know if they have an edge at all. Leverage in the wrong hands is like a driver who thinks that because he can handle a Tesla, he can drive an F1 car. He’s not compounding; he’s just going to hit the wall faster.
And the market knows that. That’s why those aggressive leverage offers exist, they want your money fast.
Knowing how to play the long game is the real alpha.
📖 Referenced posts: “Spying on Your Trading Future” and “Risk Management: The Engine of Expectancy” (upcoming).
6. Mistake: Misunderstanding Variance and Calling It Bad Luck
When things go wrong, most traders think they’re bad traders, or they blame their system and rush to replace it. Or worse, they believe the markets are rigged. In reality, they just don’t understand variance.
Variance is when you take three losses in a row despite perfect setups. It’s not betrayal or bad luck; it’s randomness doing its job. Every system has a natural distribution of wins and losses, and they’ll always appear randomly. Sometimes you’ll win, sometimes you’ll lose. No rule or model can predict exactly when. That’s not broken; that’s just markets being markets.
Neither streak defines your edge, they’re both part of the math. That’s why only expectancy can tell you if you have an edge or just luck.
When traders don’t understand variance, they take it personally. A losing streak feels like punishment; a winning streak feels like mastery. Both are illusions. Expectancy, the expected value of your account, doesn’t care about your feelings. It only reveals your edge over a large enough sample, when randomness smooths out and the real average emerges.
Accept variance as part of the process and trading becomes calmer, simpler, and much more rational.
📖 Referenced posts: “Spying on Your Trading Future” and “Sharpening Your Trading Focus.”
7. Mistake: Replacing Numbers and Logic with Dopamine and Emotion
One of the hardest habits to break in new traders is their need for dopamine. Many don’t come to the market to trade; they come to feel something. They treat trading like entertainment — constant stimulation, adrenaline, and fast feedback.
A typical beginner believes trading means dozens of short-term trades per day, with stops and targets hit constantly, like scrolling through TikTok. Each trade becomes another “like,” another hit of excitement.
I often tell my students, “If you’re here for entertainment, go to the cinema, or better yet, go to Las Vegas. It’ll cost you less, and you’ll leave happier.”
Trading isn’t a game of dopamine; it’s a game of data and probabilities. The more you chase emotional highs, the further you drift from logic and expectancy. When you trade emotions instead of numbers, you stop trading your system and start trading your mood.
📖 Referenced posts: “Sharpening Your Trading Focus” and “The True Laser Vision in Trading.”
Bonus: Trusting the Wrong Sources
Here’s an uncomfortable question: if 90% of traders lose money, what are the odds that most trading education actually works?
If we apply probability to information itself, we’d infer that 90% of the “trading wisdom” online is more likely to produce losses than profits. In other words, there’s a 90% chance your guru is wrong. And that’s before considering how many truly successful traders never share what really works.
So ask yourself: if most people fail, does it make sense to follow what most people do? There’s no formal proof for this, but after two decades in the game, I’ve seen the pattern repeat endlessly. The crowd follows the same noisy ideas... and the crowd loses.
It may not be a comfortable truth, but sometimes the truth that shocks you is the one that sets you free.
Final Thought
Most traders don’t lose because they lack talent; they lose because they fight probability instead of using it. Trading is uncertainty made measurable — a game of math, mindset, and patience.
Learn to think like a risk manager, not a fortune teller.
And remember, if you’re here for entertainment, go to Las Vegas. It’ll cost you less, and you’ll probably leave happier.
Throughout this post, I’ve referenced other entries that explore each of these mistakes in more depth. They’re all part of the How To Lambo series, where I keep breaking down the probabilistic view of trading in plain language: practical, rigorous, and free of jargon.
If you haven’t read them yet, I highly recommend starting with “Probability is the King” and “The True Laser Vision in Trading.”