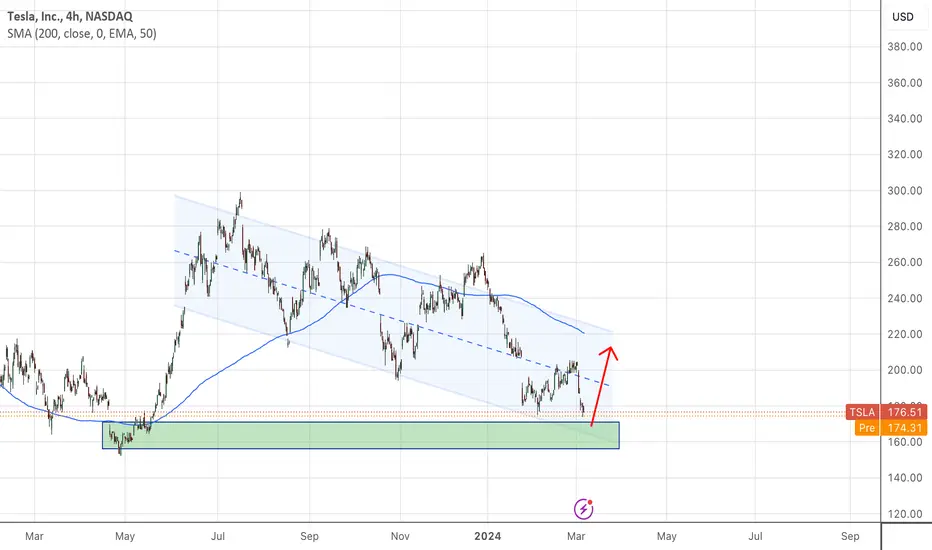
Trying TSLA againidk if it was the company buy in program or what but i def missed a $25 downside move on tsla. kinda salty about that ngl. from the looks of it we're setting up for a leg back up to 200-210.
gonna start looking at contracts couple months out once we find a clear bottom.
TSLA trade ideas

TESLA What Next? BUY!
My dear friends,
Please, find my technical outlook for TESLA below:
The price is coiling around a solid key level - 175.34
Bias - Bullish
Technical Indicators: Pivot Points High anticipates a potential price reversal.
Super trend shows a clear buy, giving a perfect indicators' convergence.
Goal - 195.09
Safe Stop Loss - 165.33
About Used Indicators:
The pivot point itself is simply the average of the high, low and closing prices from the previous trading day.
———————————
WISH YOU ALL LUCK

TESLA: Last analysis correct, time is getting stretched Last analysis was correct: we have had a top and after 40 out of 44 days a considerable retracement to begin a T+2i.
We expect more downtrend for next week, at least we should go lower than 173.70. The t+3 has still another day but eventually we can extend time through an Hybrid cycle.
This mean that time is stretched to proceed with a downtrend.

Short TSLAThe overall picture is sideway down.
TF Month
- Bear Signal
TF Week
- Close to the turning point

TSLA Waiting for turning pointThe overall picture is sideway down.
TF Month
- Bear Signal
TF Week
- Close to the turning point

IS TESLA SETTING UP FOR A MULTI YEAR BULL RUN?2 week chart, let's break it down
Look at the RSI in the triangle pattern. It happened again in 2013 and price rocketed after we broke the upper end of that channel
I believe a similar thing is about to happen.
When you combine this with the golden cross that just formed on the Stochastic RSI, we are seeing momentum slowly shift.
It will take a period of about 1 - 4 months, but your worst case scenario is...
$165 is the bottom and we potentially rally from here to the $500s
You're only downside in this scenario is
1. we reach $500 by 2025
2. trade sideways between $500 and our previous all-time high of $415
3. then we correct with the rest of the stock & crypto market in the 2026 bear market
4. before bottoming out at $200 then going on an incredible run from 2027 to 2030
As Tesla investors, we need to be prepared for 2027 to 2030
1. When Interest Rates will be astronomically lower
2. Cybertruck is in full volume production @ 250K Cybertrucks / year.
3. The Model 3 & Y refresh are the most popular cars ever
4. the $25,000 Tesla is in full volume production and is championed as Tesla's "iPhone 4 moment"
5. The value of Energy, FSD & The Tesla Optimus Bot is fully realized in the valuation of the stock price, as well as the tailwind it will provide to earnings
6. Gigafactory Mexico + India & the Lithium Refinery in Texas are open for business, The Gigafactory Nevada expansion is complete & Tesla Semi enters Volume Production
----
Overall, if y'all Tesla Investors can fully stick through 2024 - 2027, you will do incredibly well in 2027 - 2030!

TESLA ABOUT TO ENTER A HISTORICAL BUY ZONE!!!Back on the 2 week chart, Tesla Stock is about to enter what is ridiculously oversold territory, the past 9 years of history has told you that this is the BEST TIME TO BUY
In addition, we entered this zone twice BEFORE making new all time highs, and the second time could be on the horizon
If you missed the dip of January 2023, DO NOT MISS THIS ONE!!!!

TSLA Re-testing Breakout from Bearish ChannelI will be watching this to see how it reacts between 230 and 245. This is a key level according to a bearish channel I've drawn on this daily chart.
I am not making a play right now.

Going long tslataking it all the way back to 187.50. its back in the box and taking a swing, may take another for next week also.

TSLA - There is a clear story to this chart. Here's what we needAlways tell a HTF story of the charts before getting bogged down in LTF chaos. These HTF algorithms control price.
Clear what we need to look out for on this TSLA chart - Yellow strong algorithm needs to activate to take us out of magenta and teal strong selling.
Fortunately for me, you can't laugh at this. These are the same algorithms proving themselves over and over again for years. Do this same thing on the hourly chart for more detail and you will be able to work yourself into many profitable positions and understand how price is reacting to and from these HTF algorithms.
Cheers to more knowledge, more profits, and to building a strong community in which we can all find consistency in our own styles of trading.
Happy Trading :)

TLSA to $160! TSLA breaks out and a potential $160 is in sight. Patient play with this one, as we know the market is gonna do what the market will do.
TSLA Double BottomSimple Double bottom chart pattern has been in making and it is presenting a bullish signal technically .
This means a movement towards the channel top of 221
Entry @ current price
Stop loss @ 168
TP @ 221

TSLA Projection Here's my prediction for NASDAQ:TSLA , based on the physics of a basketball.
I call this chart: The ball drop.
Because the Technoking dropped the ball.
I called the 2023 top on July 20th. Have it marked on my calendar. I was able to predict it back then using the ball drop technical chart.

TESLA: Bottomed and has huge upside potential.Tesla got almost oversold technically on the 1D timeframe (RSI = 36.047, MACD = -6.760, ADX = 34.229) as it made a new 10 month Low trading under both the 1D MA50 and MA200. The 1D CCI though is reversing, being traded inside a Channel Down. The previous two times this pattern emerged, Tesla formed a bottom. In November-December 2023 , the price rallied by +35.91% and in May-July 2023, by +97.38%. This gives us a buy opportunity with a huge upside potential, a short term target (TP = 235.50) and long term (TP = 340.00).
## If you like our free content follow our profile to get more daily ideas. ##
## Comments and likes are greatly appreciated. ##

More Pain for TSLA - $165 or LowerI get a lot of questions about TSLA, and I can tell that many of you are eager to buy this TSLA dip. However, I'm seeing a lot of bearish signs for TSLA and I don't think there will be a buy opportunity any time soon. The green support level has flipped into resistance, and TSLA is forming a strong move down this week. I have $164.76 as a key price target for a rebound. I think TSLA and the EV market are weak right now, we can see lower prices over the next few months.

TSLA's triangle just broke—can it reclaim or will it slide?NASDAQ:TSLA reported quarterly earnings after hours. The initial reaction has been negative but that can sometimes change during the volatility that continues during the conference call and later the next few days.
This post will not delve into the fundamentals as a some prior posts have done. After all, markets are presumably efficient and discount all new information very rapidly, and surely algorithimic programs have already processed the report and its ramifications for the future. So the following charts will look at technical analysis alone.
From a technical perspective, TSLA had been in a large triangle that appears to be breaking over the last couple of weeks. This is true on both logarithmically scaled charts and linear / arithmetic charts. The log-scaled chart shows a somewhat bigger break so far than the linear scaled chart.
Supplementary Chart A shows a logarithmically scaled chart of this triangle.
Supplementary Chart A (Log)
Supplementary Chart B (Linear)
TSLA has been in an uptrend since its bear-market lows in early January 2023. But as prior posts have discussed, the next larger degree of trend is surely sideways, going back to the all-time highs. A simple box drawn around price on a monthly or weekly chart since even somewhat before the all-time highs shows this sideways range.
Next, consider that since the all-time high was reached, TSLA retraced to its 61.8% Fibonacci retracement and failed on its first attempt at cracking that level as shown in the next chart.
Supplementary Chart C (61.8% Fibonacci retracement)
Furthermore, TSLA has struggled mightily at its all-time high anchored VWAP. At least six major breakout attempts above this VWAP have failed since TSLA formed its all-time high. See Supplemental Chart D below, showing the all-time-high VWAP in magenta. So have the failures to succeed in a break above this VWAP exhausted themselves so that next one or two will surely succeed as the bulls might want to argue? Or have the failures only reinforced the bears' case? Until price can recover this $234 area, it's tough to be bullish on TSLA.
Supplementary Chart D
More recent anchored VWAPs also make the bull case difficult to see for the time being. These are shown in the next supplementary chart. The key levels from these VWAPs are $241.72 and $214.62.
Supplementary Chart E (Other Major VWAPs)
And price hasn't been able to poke a head above the YTD anchored VWAP either the last 3 weeks as shown in Supplementary Chart F.
Supplementary Chart F (YTD VWAP)
Finally, consider that the major 61.8% Fibonacci retracement of the current uptrend from January 2023 lies at $177.25. This is an all-important support level for bulls who think TSLA is merely consolidating its uptrend from January 2023 lows.
Supplementary Chart G (Another 61.8% Fibonacci retracement from the January 2023 lows to July 2023 highs)
These technicals don't present a trade idea or attempt to reinforce a bear or bull case for anyone who is so positioned. But it does attempt to read the technical landscape as it now stands, without any sort of bullish or bearish bias from fundamentals or macro environment. The overall case isn't bullish until key levels can be recovered. Until then, lows might be tested if price can't quickly find its way back into the consolidative safety of the triangle shown.
________________________________________
Author's Comment: Thank you for reviewing this post and considering its charts and analysis. The author welcomes comments, discussion and debate (respectfully presented) in the comment section. Shared charts are especially helpful to support any opposing or alternative view. This article is intended to present an unbiased, technical view of the security or tradable risk asset discussed.
Please note further that this technical-analysis viewpoint is short-term in nature. This is not a trade recommendation but a technical-analysis overview and commentary with levels to watch for the near term. This technical-analysis viewpoint could change at a moment's notice should price move beyond a level of invalidation. Further, proper risk-management techniques are vital to trading success. And countertrend or mean-reversion trading, e.g., trading a rally in a bear market, is lower probability and is tricky and challenging even for the most experienced traders.
DISCLAIMER: This post contains commentary published solely for educational and informational purposes. This post's content (and any content available through links in this post) and its views do not constitute financial advice or an investment or trading recommendation, and they do not account for readers' personal financial circumstances, or their investing or trading objectives, time frame, and risk tolerance. Readers should perform their own due diligence, and consult a qualified financial adviser or other investment / financial professional before entering any trade, investment or other transaction.


Testing monthly upward channel supportTSLA is now testing the upward channel. This upward channel was once resistance but was broken with force and is pulling back to test it for the second time as support. If TSLA can hold here, it is a very bullish setup in the long term.

Bullish on TeslaBullish on Tesla.
Double bottom confirmed in a Falling Wedge pattern.
First target on chart.

TSLA - Put option TSLA is on a channel and if we break this we're going to 120.. What makes this different then the other bounces is that the 50MA has broken the 200MA which signals more weakness then just a bounce.. Keep a close eye on this one or if you have $400 laying around you can buy the May put option at 120 now..

tsla wait for correction *The content on this analysis is subject to change at any time without notice, and is provided for the sole purpose of assisting traders to make independent investment decisions.

TSLA - Weekly chart still Bearish. Still no buy signal. Daily and Weekly charts are both Downtrend and Bearish.
TSLA Price Structure forming Support and Resistant at every 50$ interval.
i.e Major Support and Resistant are at 100, 150, 200, 250, 300... (Please remember this levels)
We have seen 250 rejection Dec 2023, Breaks 205 Jan 2024, pullback and rejection at 205 last couple weeks.
205 is now become Support turned Resistant. Next Support is around 150..
Expect technical rebound around this area which can be an opportunity for hit and run BUY trade (Intraday / Short term trade againts HTF direction.).. Otherwise, stay out until buy signal appear..
Currently, Turtle Sell signal (Price Action) triggers in both DAILY and WEEKLY charts with MCDX Buying Momentum is DOWN while Selling Momentum is Up
Selling Volume / Retailer is DOMINATING Buying Volume / Banker ( 68% Retailer vs 8% Banker )
Note : 0% Banker in DAILY CHART..

TESLA consolidation continuation tradeAs TESLA consolidates there is a chance it will pull back up before falling more.