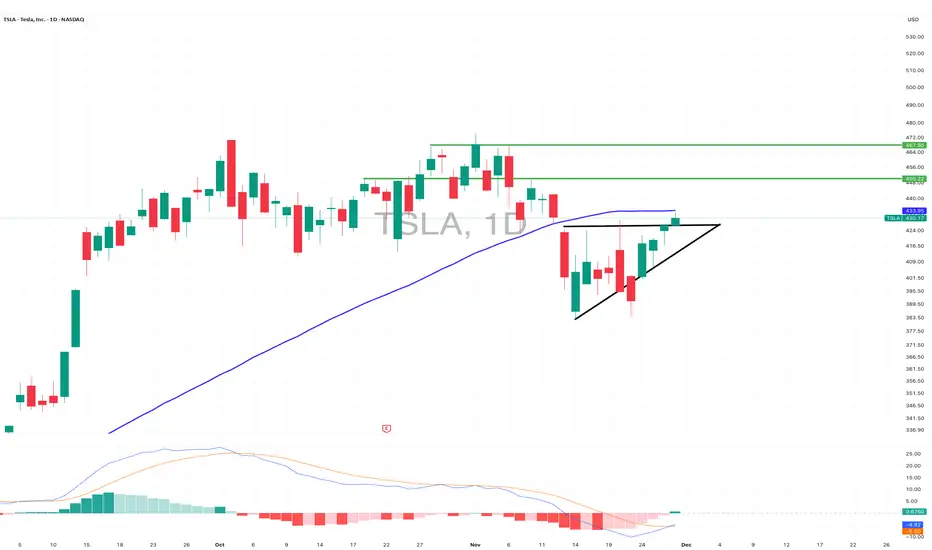
$TSLA Weekend analysis - 30th Nov, 2025NASDAQ:TSLA broke out of its ascending triangle on Friday and is now pushing toward the 50D SMA. It needs to reclaim and close above 433.95 to keep the momentum going.
If it clears that level, the next targets I’m watching are 450.22 and 467.82. The MACD also confirmed a bullish crossover on Friday, which supports the case for more upside.
Trade ideas
TSLA Weekly Trade Snapshot: Bullish MomentumTSLA Weekly Signal | 2025-12-01
Instrument: TSLA
Direction: CALL (LONG)
Strike Price: $430.00
Entry Price: $9.50
Profit Target 1: $15.20 (60% gain)
Profit Target 2: $19.00 (100% gain)
Stop Loss: $6.65 (30% loss)
Expiry: 2025-12-05 (4 days)
Position Size: 2% of portfolio
Confidence: 65%
Weekly Momentum: BULLISH (+1.07% 1W)
Flow Intel: Bearish, PCR 1.56
Katy AI Prediction: Neutral (-0.91% predicted move)
Risk Level: MEDIUM – conflicts between Katy AI neutral and bullish technicals

Tesla bullish momentum points to $435 test this weekCurrent Price: $402.77
Direction: LONG
Confidence Level: 66% (Several traders lean bullish with clear near-term upside targets, but mixed caution at resistance)
Targets:
- T1 = $418
- T2 = $435
Stop Levels:
- S1 = $397
- S2 = $382
**Wisdom of Professional Traders:**
I've been pulling together what multiple professional traders are saying about Tesla, and the collective picture leans bullish in the short term. Several traders noted higher highs, higher lows in recent sessions and upside potential toward $435, even as they warn of possible resistance around $440. That said, the consensus is that as long as price stays above key supports like $397 and the more distant $382 zone, the bulls have control in this current weekly window.
**Key Insights:**
Here's what's driving this view: The price action is showing a clean pattern of higher highs and higher lows, with a possible push into the 430s before facing any major resistance. Traders are watching the 418–420 zone as a near-term waypoint; holding above it keeps the rally intact. The bullish sentiment is supported by patterns like weekly inside bar breaks to the upside and even a potential monthly cup-and-handle if deeper supports hold.
What's interesting is that even the cautious voices—those pointing out the rising wedge formation—still expect a run into the 435 area before any meaningful rejection. This gives the long side some breathing room this week, especially with key support levels unbroken. The fact that several traders identified the same upside levels increases the conviction in these targets.
**Recent Performance:**
Tesla gained nearly 10% recently, rebounding strongly from the lows and moving toward the important 418–420 support-resistance pivot. The stock is up significantly year-to-date—over 80% from certain analyses—with the latest breakout above prior consolidation bringing more buyers in. This rally is happening in line with broader market strength, as the NASDAQ, SPY, and even small caps have put in solid gains.
**Expert Analysis:**
Multiple traders see the near-term chart setup as constructive. A few pointed to a bullish breakout above $412.50 that sets the stage for higher moves, while others emphasized the importance of holding above the 50-day moving average. The $397 level repeatedly comes up as a line in the sand; lose that, and downside targets in the 370s might come back into play, but for now that level is intact. Upside calls cluster around $435, with extensions to $440 if momentum remains.
**News Impact:**
There's no major fresh headline driving Tesla right now, but the background tone includes optimism about potential chip partnerships and continued EV growth. Market-wide, traders are eyeing Fed policy signals from Jerome Powell's recent comments, which could influence momentum stocks like Tesla. With no adverse company-specific news, Tesla rides the tailwinds of a generally bullish tech market.
**Trading Recommendation:**
Given the collective trader analysis, I'd go LONG here with a first target at $418, locking in partial profits there, and a second target at $435. Stops go just below $397 to protect against sharp reversals, with a secondary stop near $382 if volatility spikes. The price pattern and widespread trader agreement on these levels make this a reasonable bullish setup for the week, but watch that 435–440 band closely for possible rejection.
TSLA: Get ready...It doesn't get much prettier than this.
Textbook technical set up for some price discovery.
All that's needed is some sort of catalyst (say... FSD expansion warp speed?)
No trade advice. 607 PT.

Tesla Long Alert: Katy AI Projects Upward MomentumTSLA QuantSignals Katy 1M Prediction 2025-11-26
Ticker: SPY
Signal Type: Daily / Weekly
Direction: BULLISH / BEARISH / NEUTRAL
Confidence: 0%
Current Price: $0.00
Entry: $0.00
Targets:
T1: $0.00
T2: $0.00
Stop Loss: $0.00
Expiry: (If using options)
📈 TradingView Information — Template 2 (Advanced)
📉 Trend:
Primary Trend: XX
Volume Strength: XX
Volatility Index: XX
Momentum Score: XX
🎯 Signal Levels:
Buy Zone: $0.00 – $0.00
Risk Zone: $0.00
Profit Zone 1: $0.00
Profit Zone 2: $0.00
📌 Analyst Note:
Short summary (e.g., “Momentum weakening, approaching supply zone.”)
🚀 TradingView Information — QuantSignals Style
Ticker: SPY
Final Prediction: $0.00 (±0.00%)
30min Target: $0.00 (±0.00%)
Trend: BULLISH / BEARISH / NEUTRAL
Confidence: 0.0%
Volatility: 0.0%
TSLA at a Critical Pivot! TSLA at a Critical Pivot! Bounce Coming or Fake Pump Before a Bigger Drop? 🚀⚠️
Alright, TSLA traders… this one is getting interesting.
Based on the weekly, daily, hourly structure AND the GEX map you provided, TSLA is sitting right at a decision zone where institutions will either:
✅ push it toward $435–$450
or
❌ dump it back into the $390–$380 liquidity pocket
Let’s break it down clean and human — like we always do.
🟦 Weekly Timeframe (Big Picture)
TSLA finally broke out of the long consolidation and now pulling back into previous structure.
Key observations:
* Weekly candle rejecting near $475–$500 supply
* Price holding above key weekly support around $410–$417
* Rising trendline still intact
* No major breakdown yet
If the weekly holds above $410, the trend continues bullish.
If it loses $410, weekly structure turns bearish quickly.
🟩 Daily Timeframe
This is where it gets tricky.
Daily chart shows:
* CHoCH + BOS signals around $420
* Strong rejection at daily supply $470–$500
* Retest of demand zone $390–$405
* Price currently hovering in the middle
This daily structure tells me:
TSLA bounced, but it's not out of trouble yet.
We need a clean daily close above $425–$430 to unlock the upside again.
If daily closes below $410, sellers will take control fast.
🟨 1H Timeframe (Trader Zone)
On the 1H:
* Multiple CHoCH/BOS flips
* Price stuck in a range $410–$428
* Weak momentum on the latest bounce
* Overhead supply sitting right above current price
This looks like:
📌 accumulation OR distribution
1H will decide the next move:
✅ Break & hold above $428 = continuation toward $435–$450
❌ Reject $428 and break $410 = drop into $395–$385
🔥 GEX Outlook (Institutional Positioning)
Your GEX chart is very clear:
📈 CALL Walls:
* $428 / $435 / $450 cluster
* Highest positive NET GEX at $410–$420
📉 PUT Walls:
* $390
* $385
* $380 major support
Institutions are:
✅ defending $410–$420
✅ hedged heavily around $435
❌ willing to let price fall toward $390 if $410 fails
This aligns PERFECTLY with the price structure.
🧭 My Thoughts
TSLA looks stronger than NVDA and SPY in the short-term.
This bounce is not random — GEX shows real defense at $410 and buyers stepped in.
However…
If TSLA fails to break above $428 convincingly, this bounce becomes a trap, and that drop toward $390–$385 becomes very likely.
🎯 Trade Levels to Watch
Bullish Scenario
* Entry: above $428
* Target: $435 → $450
* Stop: below $417
Bearish Scenario
* Entry: below $410
* Target: $395 → $385
* Stop: above $423
🚀 Option Thoughts
If trading options:
Calls only make sense above $428
Puts become high conviction below $410
Inside that range = chop risk
✅ Conclusion
TSLA is sitting at the most important zone of the week.
If $428 breaks cleanly → continuation to $450
If $410 breaks → fast flush to $390–$385 liquidity
⚠️ Disclaimer
This analysis is for educational purposes only and does not constitute financial advice. Always do your own research and manage your risk before trading.

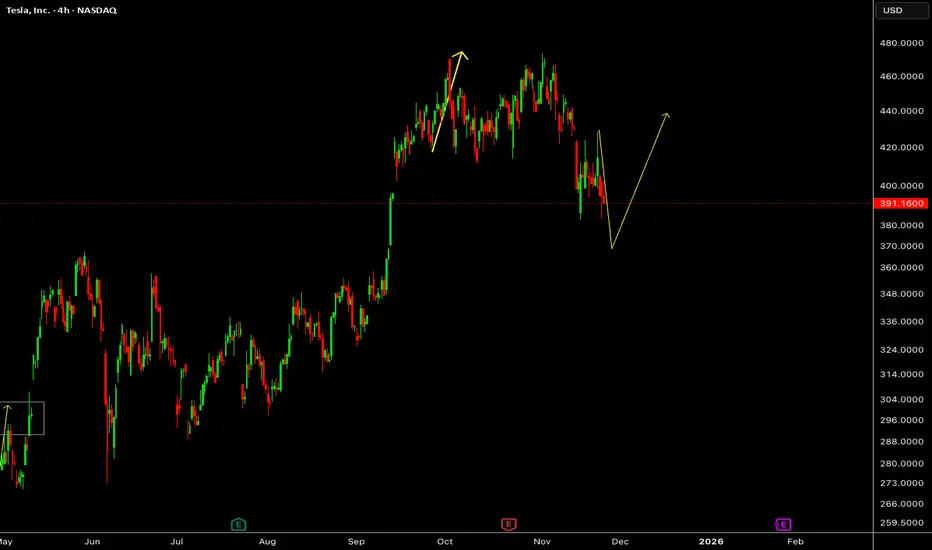
TSLA – Downside Extension Followed by Potential Rebound PhaseTesla has continued to slide after its recent peak, with price action forming a deeper corrective leg. The latest reaction suggests a rebound scenario may develop if momentum begins to shift, paving the way for a possible recovery sequence in the coming sessions.
Disclosure: We are part of Trade Nation's Influencer program and receive a monthly fee for using their TradingView charts in our analysis.
Make it simpleSeems wave 3 is getting in place soon, buckle up!
we had already 2 major impulses, with the normal dip.
Looks good. send it!

Tesla - Withstanding all weakness!🏹Tesla ( NASDAQ:TSLA ) can still break out:
🔎Analysis summary:
Since Tesla was listed on the Nasdaq back in 2013, we witnessed a lot of triangle breakouts. And starting all the way back in 2020, Tesla once again created a bullish triangle. Last month we saw the breakout and this month we have to see the confirmation
📝Levels to watch:
$400
SwingTraderPhil
SwingTrading.Simplified. | Investing.Simplified. | #LONGTERMVISION

TSLA:Truncated 5th at 474 A-Bottom 382 Confirmed-3Scenarios MapTSLA: Truncated 5th at 474 ☠️ A-Bottom 382 Confirmed – 3 Scenarios Mapped: B to 440/460 or Bust? C-Targets 287-367 + Fed Cut Catalyst Dec 9-10:
Tesla's 5-wave impulsive rally from $273 to $474.07 is officially terminated in a classic Truncated 5th Wave pattern – one of the most reliable bearish setups in Elliott Wave theory.
Key Confirmation Signals:
Wave ⑤ high: 474.07 = exact same price as sub-wave (i) of ③ (textbook same-price failure)
Screaming RSI bearish divergence at the top
Volume collapse + SMA20/50 death cross (Sep) → truncation locked in
Current structure: ABC zigzag correction (likely Wave IV of larger cycle or Wave A of bear impulse).
Wave A: 474.07 → 382.78 (0.786 retracement of entire impulse, Nov 14 low)
Wave B: Now underway as platform consolidation post-hammer reversal (Nov 23 low 383.76, RSI oversold confirmed)
-Primary target: 430-440 (0.618 Fib of A) by early Dec
-If breakout 445: Extend to 460 (0.786 Fib, 35% odds – accelerated rally fueled by Fed doves)
MACD/RSI Fuel for B-Wave:
MACD bullish divergence emerging (-3.85 turning up) → Gold cross by Nov end
RSI oversold hammer → Short-term bounce to 410+ expected
3 Scenarios for Wave C (Post-B Top):
| Scenario | Probability | B-Wave High | C-Wave Target | Key Condition |
|-------------------|-------------|-----------------|-----------------|----------------------------------------|
| **Weak B: Deep C** | 50% | 430-440 (Platform Type) | 287-293 (C=1.618×A) | B stalls at 440; Dec FOMC mild cut → Extension from 319 (1.272×A) low |
| **Strong B: Shallow C** | 35% | 445-460 (Accelerated Rally) | 361-367 (C=1.0×A) | Break 445 on Fed fuel; Shallow due to strong rebound |
| **Bullish Invalid: Extended ⑤** | 15% | >485 (Break Secondary Resistance) | 550-600+ (0.618 of Impulse) | Weekly close >485 negates ABC → Wave ⑤ resumes |
Catalysts to Watch:
Dec 9-10 FOMC: Expected 25bp cut (89% odds post-Williams) – Long shadow potential for B acceleration (see chart)
Bear confirm: <380 break → C accelerates to 250 (2.0×A, high-volume 2024 low)
Timeframe: B ends early Dec; C launches mid-Dec, bottoms Jan 2026 (4-6 weeks)
Trade with stops: Long B to 440 (trail below 380); Flip short at B top divergence.
This is not financial advice – DYOR.

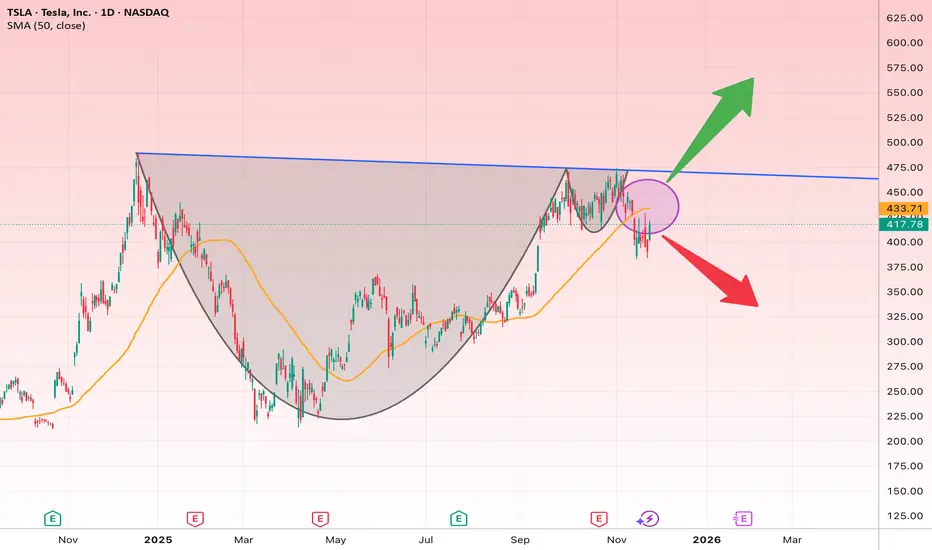
TSLA at a Turning Point: Cup & Handle Breakout or Breakdown?The chart shows a clear Cup & Handle pattern forming on the daily timeframe. Price touched the descending resistance (blue line) and failed to break out, placing TSLA at a critical decision point.
Key Points:
• Main Resistance: 450–465 zone (descending trendline + neckline of pattern)
• Major Support: 395–400 zone
• The 50-day MA is currently acting as near-term resistance.
Bullish Scenario (If price breaks above 465)
A breakout with a daily close above 465 would likely trigger:
• Target 1: $500
• Target 2: $545
• Target 3: $600
Bearish Scenario (If 395 breaks)
A breakdown below 395 may lead to:
• Bearish Target 1: $360
• Target 2: $325
Suggested Stop-Loss:
• $394 (for long positions)
TSLA long-term TATesla stock is in uptrend on weekly time frame, but the distribution has started on mid-term, watch for $380 level to hold. If this level is broken it may go even lower to $360, let's keep an eye on it.

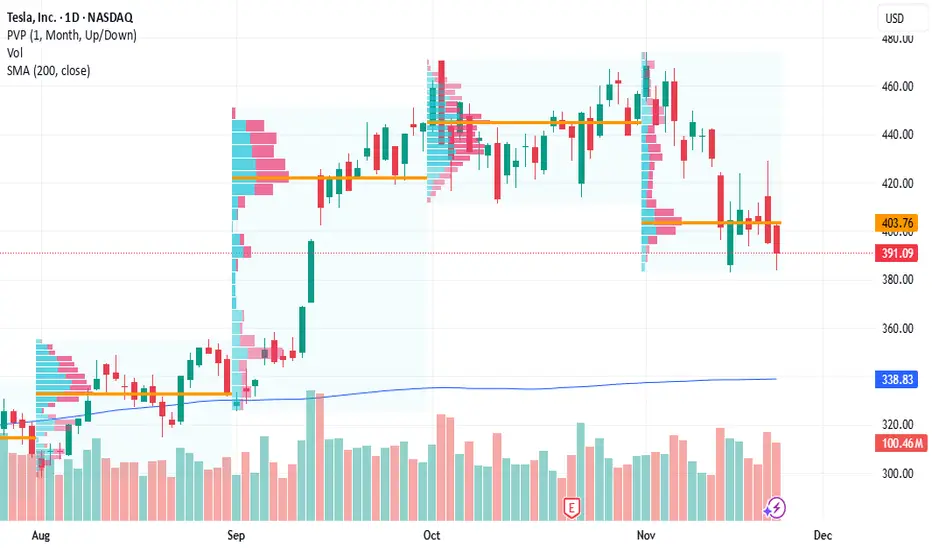
TSLA: Fundamentals Are Collapsing While Valuation Stays in OrbitTesla is trading near multi-month highs… but the fundamentals tell a very different story.
EPS has dropped by 50%, revenue growth has almost stalled, and yet the stock still carries a Forward P/E of 164.
This combination — slowing growth and extreme valuation — looks like the definition of an institutional bubble setup.
🧮 Fundamental Context
Over the past few years, Tesla’s growth has slowed dramatically:
Revenue rose from 31B → 53B → 81B → 96B → 97B — barely any increase.
EPS climbed from 0.2 → 1.6 → 3.6 → 4.3 — and then fell by half.
Quarter-over-quarter metrics remain negative, with no visible recovery trend.
Meanwhile, the Forward P/E of 164 implies double-digit expansion ahead — which clearly isn’t happening.
The fundamentals simply do not justify this kind of valuation.
Right now, Tesla’s numbers resemble the early phase of a valuation compression cycle — where prices eventually catch up with reality.
📉 Technical Structure
Technically, Tesla has been moving in a broad sideways range, forming what looks like a long-term Wave 4 structure.
We’re currently inside the “B” leg, which could already be complete or near completion.
Once that wave ends, the next expected move is a Wave C decline.
Key levels to watch:
📍 Upper resistance zone: $400 – $550
📍 Primary cluster: around $250
📍 Support zone: $150 – $200
The chart shows clear volume concentration around $250 — once that level breaks, the next liquidity pocket sits between $150 and $200.
That’s where a potential bottoming cluster could form before the final upward leg.
⚠️ Market Outlook
While other FANG names maintain solid balance sheets and stable earnings, Tesla’s fundamentals are deteriorating sharply.
Yes, the stock may still see short-term pumps driven by sentiment or Musk’s fan base — but markets always return to fundamentals.
And those fundamentals are pointing downward.
📊 Summary
EPS and revenue both trending lower 📉
Forward P/E at 164 — completely disconnected from growth metrics
Technical range suggests potential decline toward $200–$150
Current price action likely part of a larger corrective structure
Long-term investors should exercise extreme caution ⚠️
Tesla isn’t a short-term “growth story” anymore — it’s a valuation risk story.
Until earnings stabilize and margins recover, this stock looks massively overpriced.

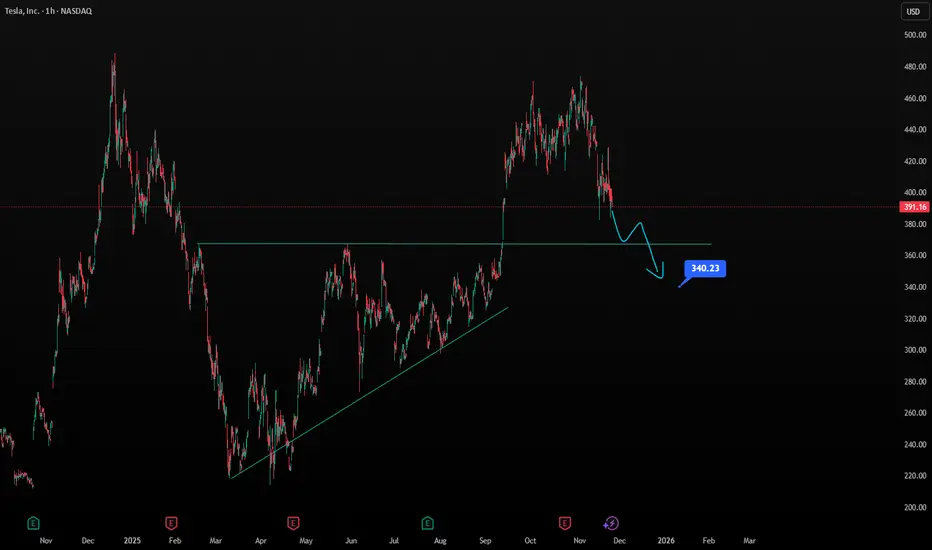
Midterm Stock Forecast for TeslaNASDAQ:TSLA at $391 shows weakening technical structure, suggesting a continuation toward $340. H1 trendlines indicate fading bullish pressure. Fundamentals remain mixed: energy storage grows, but auto margins face pressure and competition intensifies. The $340 zone is a key demand area for potential midterm stabilization.
TESLA IS ENTERING A CRITICAL ZONETesla currently remains in an uptrend while moving inside the existing ascending channel. The most recent reaction came from the trendline, but an important structure has formed above: a clear double top pattern . After the pattern completed, price declined and is now retesting the neckline, which has already acted as resistance. The 50 EMA is also positioned at this same level, adding confluence.
According to the mechanics of the double top, the expected downward projection is typically equal to the distance between the top of the pattern and the neckline. That measured move aligns almost perfectly with the lower support zone and the 200 EMA , forming a strong confluence area.
Additionally, there is an imbalance inside that lower region, which commonly pulls price back to fill it. RSI has formed a downtrend and is moving toward the 30 level, which supports the likelihood of a continued decline.
If price breaks above both the RSI downtrend and the neckline, the move back upward along the channel becomes possible. However, the bearish confirmations remain strong unless a significant positive catalyst invalidates the setup.

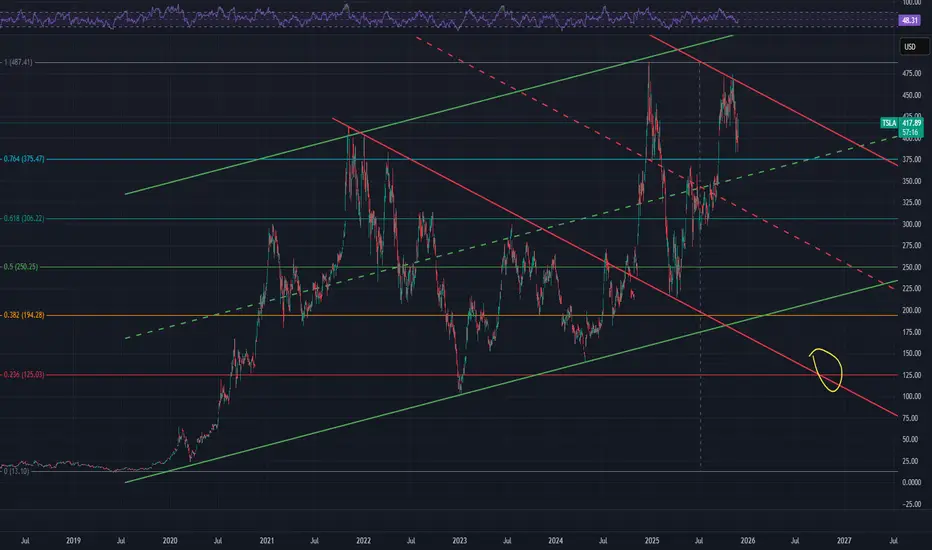
TSLA going back to 120$ in late 2026 ?I just want to put this idea out there.
Seems insane, but stranger things have happened.
Will come back in a year and see if these channels really have been planned for a long time.
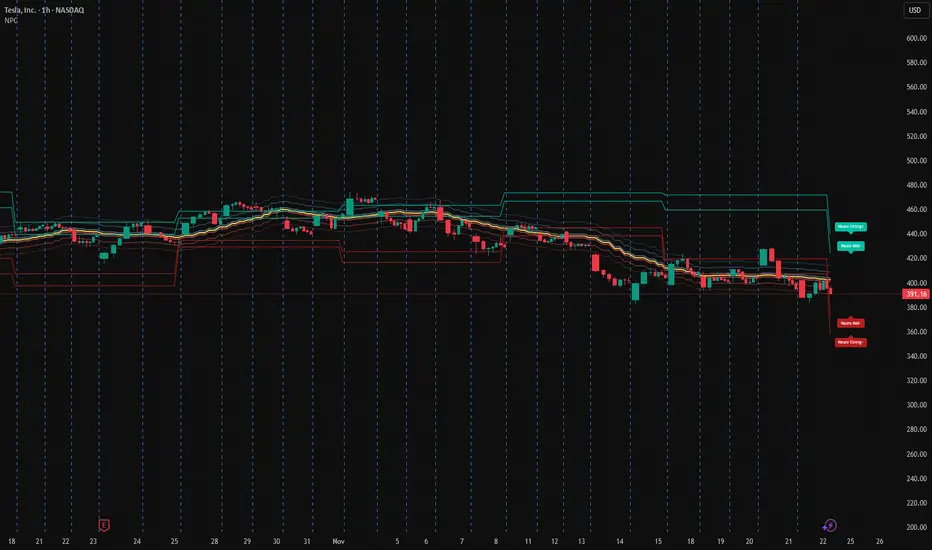
Tesla (1H) – Post-Distribution Breakdown vs NPC Equilibrium ZoneTesla is currently trading inside a NPC post-distribution compression range after breaking down from the upper volatility structure.
Instead of predicting direction, here’s the statistical positioning based on the NeuroPolynomial Channel:
Current Positioning:
• Price under NPC Core Cluster
• Distance to lower stress band: ~1.4%
• Distance to upper expansion band: ~3.2%
• Compression vs prior impulse: ~0.61
NPC Volatility Map:
• Upper Expansion Zone: +3% to +3.8%
• Core Equilibrium: 400–412 zone
• Lower Rejection Band: −1.4%
• Breakdown Continuation Zone: −2.8% to −3.5%
Interpretation (scenario-based):
– Sustained acceptance above core → structural rebuild attempt
– Rejection at core → continuation inside stress band
– Re-entry into strong-lower → extension zone unlock
This is a volatility structure map, not a prediction model.
It will be a bumpy ride downhillTesla's fanboys would not like it.
The company is facing turbulent times ahead and is still failing to provide what was promised years ago.
1. The legislators won't approve SDC also known as autonomous cars in the near future, because a human supervision is required. So the robotaxi is just a fiction.
2. Robots development is way behind the competitors. We all see the Boston Dynamics' Atlas, Mercedes-Benz project and some other projects. Comparing the Optimus project with the best out there is non-sense, because it fails on all fronts. Considering NVidia now open-sourced their project and collaboration with Google and Disney, IMO Tesla is out of the robo market now.
3. We see clear signs of a distribution phase at the top, fuelled by a lot of insider sells.
*Support levels are shown on the chart as green boxes. .
It is NOT a TRADING ADVISE .
There is a HIGH RISK of losing money when trading.
TSLA stock might be considered UNSAFE right NOW.

TESLA Will Explode! BUY!
My dear friends,
My technical analysis for TESLA is below:
The market is trading on 391.16 pivot level.
Bias - Bullish
Technical Indicators: Both Super Trend & Pivot HL indicate a highly probable Bullish continuation.
Target - 403.74
Recommended Stop Loss - 384.61
About Used Indicators:
A pivot point is a technical analysis indicator, or calculations, used to determine the overall trend of the market over different time frames.
Disclosure: I am part of Trade Nation's Influencer program and receive a monthly fee for using their TradingView charts in my analysis.
———————————
WISH YOU ALL LUCK
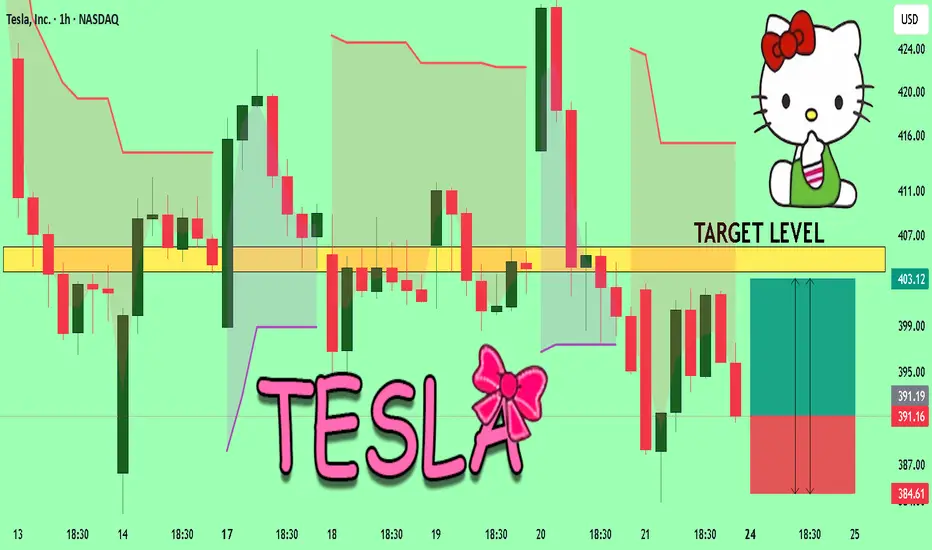
Tesla downside momentum could extend before any reboundCurrent Price: $402.77
Direction: SHORT
Confidence Level: 62%
Targets:
- T1 = $380.00
- T2 = $368.00
Stop Levels:
- S1 = $410.00
- S2 = $420.00
**Wisdom of Professional Traders:**
The collective insights from multiple professional traders show a consistent short‑term bias to the downside for Tesla, even among those who are bullish longer term. Several traders focused on the $380 area as the first key level to watch, with many citing $368 as the major gap‑fill target for this week. While a few see buying opportunities lower, the weight of commentary points to more near‑term weakness before a sustainable rally sets in.
**Key Insights:**
Here’s what’s driving my view: across the trader community, Tesla is in a clear short‑term downtrend of lower highs and lower lows. Multiple traders marked $398–$400 as an overhead resistance zone with “a lot of supply,” making it hard for price to push higher before testing lower supports. There’s also consensus that any bounce here would likely be a “pump and dump” into resistance before the next leg lower.
Another important observation is that many traders see $380 as the immediate downside target, with $368 as a more aggressive move that fills the open daily gap. Quite a few expect that if the market shows further weakness, these levels could be reached within this week. The short‑term technical picture – failing rallies, resistance holding, and repeated tests of support – keeps me leaning to a short bias.
**Recent Performance:**
Tesla has retreated from highs in the $460s into the low $400s over recent weeks. Last week’s action saw it struggle to hold intraday bounces, closing lower and respecting resistance in the high $390s to $400 range. The stock’s recent inability to follow through on rallies, despite broader market upticks, underlines the pressure sellers are applying.
**Expert Analysis:**
Several traders pointed to the break of a short‑term uptrend late last week, followed by confirmation of fresh downside momentum. $380 was highlighted repeatedly as a heavy buy interest zone – but crucially, that’s also where they expect price to gravitate to in the short term. The $368 gap is seen as a likely magnet if $380 fails to hold. Other market experts tied this weakness to double top patterns and broader tech weakness, adding fundamental headwinds like Bitcoin impairment impacts on Tesla’s net income.
**News Impact:**
While there were mentions of long‑term catalysts like robo‑taxis and updated FSD ratings, these are not expected to influence this week’s price action. Recent headlines about large stake sales by high‑profile investors and Tesla’s exposure to Bitcoin impairments have added a cautious tone. This news flow supports the case for near‑term softness as traders weigh potential earnings impacts.
**Trading Recommendation:**
Here’s my take: With heavy supply above $398–$400 and traders eyeing $380 and $368 as near‑term targets, I see a SHORT setup as the higher‑probability play for this week. A break under $382 could accelerate momentum toward $380 quickly, with $368 in play if selling persists. I’d keep stops above $410 to protect against a squeeze, with $420 as a hard‑fail level for the short thesis. Position sizing should be moderate given the potential for sharp bounces in a volatile name like Tesla.
Tesla Retests Key support Amid a New Lawsuit After Deadly CrashTesla (NASDAQ: NASDAQ:TSLA ) faces renewed scrutiny after a lawsuit was filed over a fatal January 2023 crash in Washington state. According to the complaint, the vehicle “rapidly accelerated” before striking a utility pole and bursting into flames, killing one passenger and severely injuring another. First responders reportedly struggled to access the victims due to the vehicle’s structure and fire behavior, raising questions about safety systems and emergency accessibility.
The lawsuit lands during a period of heightened attention on Tesla’s real-world AI features, including Autopilot and Full Self-Driving (FSD). While the filing does not explicitly blame autonomous systems, it adds pressure to Tesla’s regulatory and legal environment, which remains a critical investor risk factor heading into 2026.
Tesla’s Fundamentals Remain Strong
Despite the legal challenges, Tesla retains a massive market cap near $1.33 trillion and continues scaling its energy and robotics divisions. The company remains profitable, with a strong balance sheet and long-term margin expansion driven by software, AI, and autonomous capabilities. The Optimus humanoid robot program and 4680 battery ramp both strengthen Tesla’s position in the next industrial cycle.
Tesla’s broad lineup—from the Model 3 to the Semi and Cybertruck—supports global delivery growth, while its charging infrastructure partnerships increase ecosystem reach. Fundamentally, Tesla remains one of the strongest players in the EV and AI–mobility sectors.
Technical Outlook: Trendline Retest in Play
From a price-action perspective, Tesla trades around $391, pulling back toward a critical ascending trendline visible on the weekly chart. This trendline has guided Tesla’s recovery since April and remains the key level to watch.
Support:
• $390 trendline
• Major demand at $350
• Long-term support at $250
Resistance:
• $425
• $492 (2025 high)
A strong bounce at the trendline could send TSLA back toward $425 and eventually $492. However, a clean breakdown risks a deeper correction toward the $320 zone.

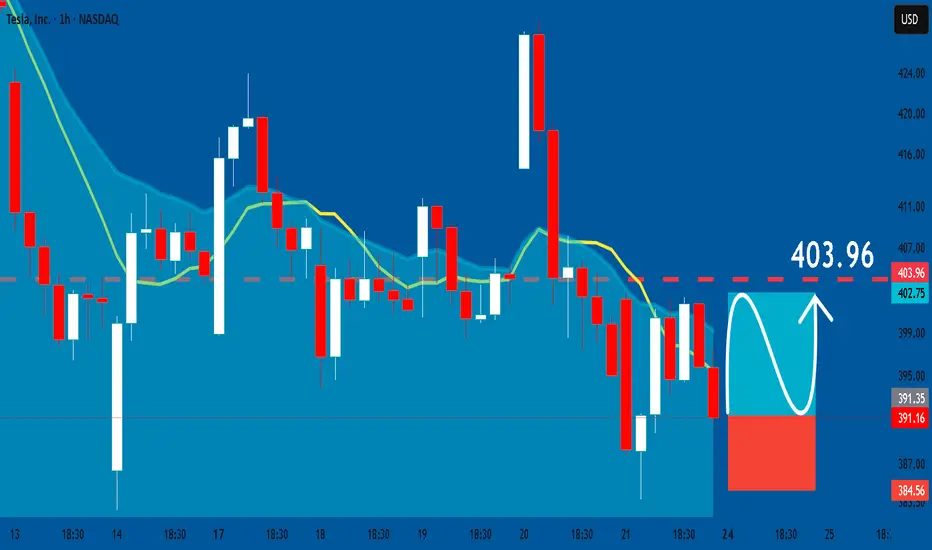
TESLA: Long Signal Explained
TESLA
- Classic bullish pattern
- Our team expects retracement
SUGGESTED TRADE:
Swing Trade
Buy TESLA
Entry - 391.16
Stop - 384.56
Take - 403.96
Our Risk - 1%
Start protection of your profits from lower levels
Disclosure: I am part of Trade Nation's Influencer program and receive a monthly fee for using their TradingView charts in my analysis.
❤️ Please, support our work with like & comment! ❤️
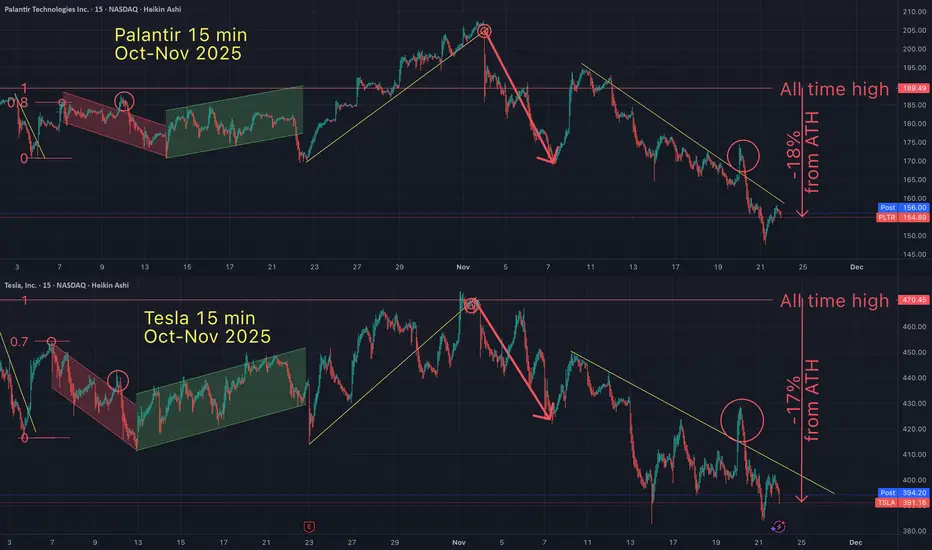
Tesla / Palantir Fractal - 50 Days of identical price action?On oct 7th I suggested that Tesla and Palantir had been in a 'fractal" pattern. Since identifying this pattern, it's been 50 days of identical price action (on the 15 minute timeframe). But this fractal goes back much further in time.
Fractals are a mathmatical anomaly, if you understand linear equations (and believe the market is "random"). All assets are doing the same patterns over and over, on all time frames. You just need to see it for what it is.
May the truth be with you.