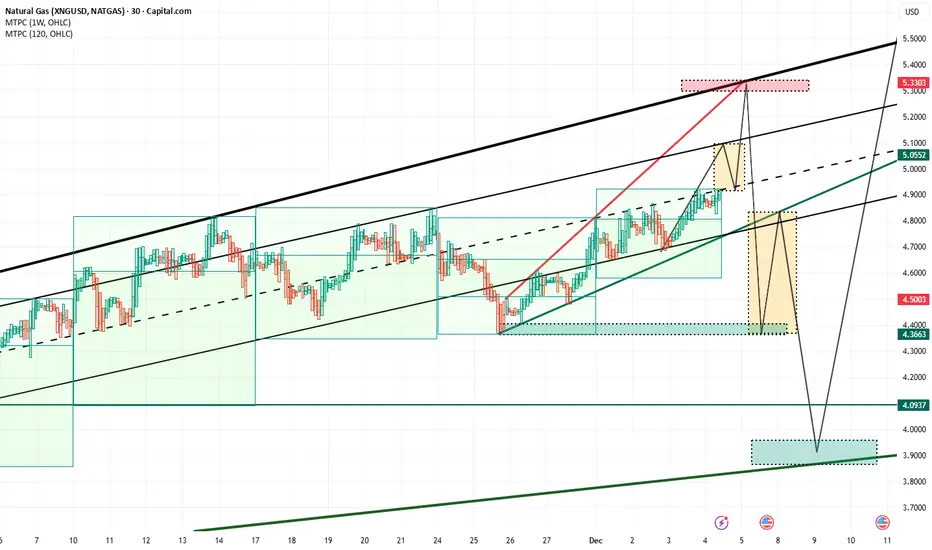
Weekly reverse CandleA push toward the upper channel boundary and the key resistance area at 5.30–5.33 USD remains the dominant scenario. An interim dip is possible on the way up, with a potential retracement forming anywhere between 5.08 and 4.92 USD.
If the price reaches the 5.30–5.33 USD zone on Friday and gets rejected while the main support holds, the weekly candle would turn into a clear reversal signal. forming a strong Weekly reverse Candle.
A break of this support in the following week would then open the path toward the 4.0–3.9 USD region, which stands out as the most probable deeper pullback area.
On the descent toward that zone, a sharp corrective bounce from around 4.36 back toward approximately 4.80 USD is highly plausible.
It remains a game of probabilities: a decline can unfold from 5.00 or even 5.20 USD, and both scenarios remain entirely possible. The exact outcome will depend on how the price behaves as it approaches these levels and which of the following market reactions takes shape.
Trade ideas
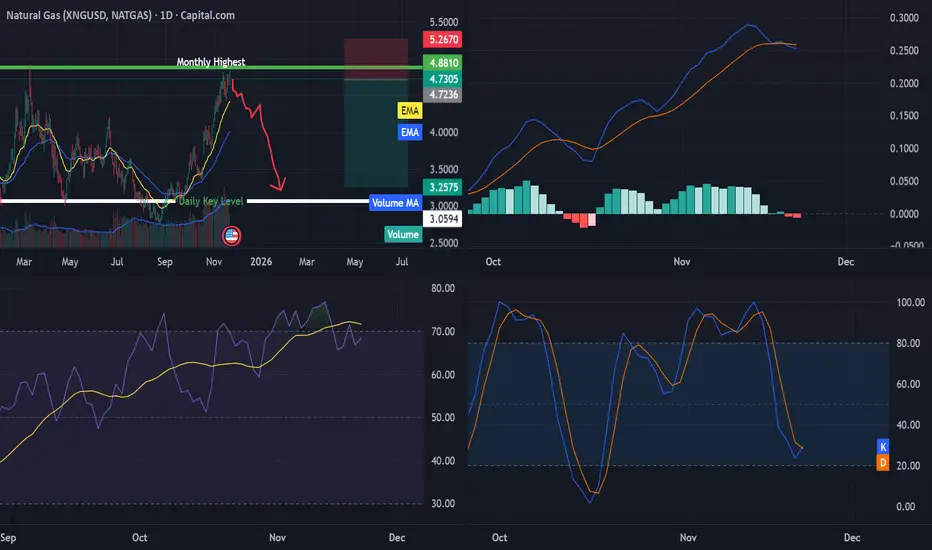
Natural Gas Analysis- Although the seasonality is bullish for NG (due to Dec–Jan peak demand) and there’s a ~70% probability of December closing higher than Nov, with historical average gains of 15–25%.
- However, based on the 2-week chart, it is observed that price has already front-run winter demand
- It has recently tested the Fibonacci resistance zone 0.382 (4.805), and currently ranging below the fib level
- The structure failing to breach the fib level and previous highs of 4.920 signaling early exhaustion of bullish momentum.
- The prices are currently also testing the upper Bollinger band, and RSI is also reversing from higher zone, signaling a bearish correction (or reversal trend) cannot be neglected
- A pullback toward fib level 0.618 (4.070) to psychological level 4.000 is more probable before any next leg up.
- Although note that Volatility will remain elevated in NG during the winter season
The vertical dotted lines represents the period between Nov to Feb (4 months) - where in the past 5 years, the prices closed in red 4 times and only 1 time in green (2024-25)
Taking reference from the previous 5 years, it becomes more probable that the upcoming quarter starting from today (Dec 1, 25), might show a corrective trend
Overall Bias:
- Short-term cautious/mean-reversion till 4.076 - 4.000
- Medium-term bullish only after healthy retracement and base formation.

Natural Gas Price Nears Three-Year High in Early DecemberNatural Gas Price Nears Three-Year High in Early December
In mid-November, analysing the XNG/USD chart, we noted a rise in natural gas prices, outlined a system of trend channels, and suggested a possible pullback scenario.
Indeed, since then (as indicated by the arrow), U.S. gas prices retreated to the lower boundary of the orange ascending channel, forming a low at point B. From late November, renewed buying activity has been observed, driven by:
→ Seasonal factor: U.S. forecasts for December indicate below-average temperatures, sharply increasing demand for heating and electricity.
→ Export and geopolitics: The U.S. is exporting record volumes of liquefied natural gas (LNG). Europe continues to purchase U.S. gas to replace Russian supplies, while demand in Asia is also rising.
→ Anticipation of shortages: Due to high exports and early cold weather, traders are factoring in the risk that storage levels may deplete faster than usual.
Technical Analysis of XNG/USD
Price is currently near a resistance zone formed by:
→ The upper boundary of a broad descending channel, extended following a bullish breakout in late October.
→ The $4.800/MMBtu level, near which a peak formed in March.
→ The psychological $5.000/MMBtu mark.
At the same time, price action indicates bulls remain in control:
→ The lower boundary of the orange channel acts as support.
→ Low B resembles a false bearish breakout of low A, trapping short sellers who expected a breakdown.
→ Long lower wicks at low B indicate strong buying pressure.
Given this, it is reasonable to suggest that if U.S. gas prices failed to hold above $4.800/MMBtu in mid-November, December could prove more favourable for bulls, potentially establishing a three-year high.
This article represents the opinion of the Companies operating under the FXOpen brand only. It is not to be construed as an offer, solicitation, or recommendation with respect to products and services provided by the Companies operating under the FXOpen brand, nor is it to be considered financial advice.


Natural Gas Wave Analysis – 25 November 2025
- Natural Gas falling inside impulse wave (1)
- Likely to fall to support level 4.200
Natural Gas recently reversed from resistance area between the long-term resistance level 4.800 (former top of the shooting star from May) and the upper daily Bollinger Band.
This resistance area was further strengthened by the resistance trendline of the narrow daily up channel from October.
Having just broken the aforementioned daily up channel, Natural Gas can be expected to fall further in the accelerated impulse wave (1) to the next support level 4.200.

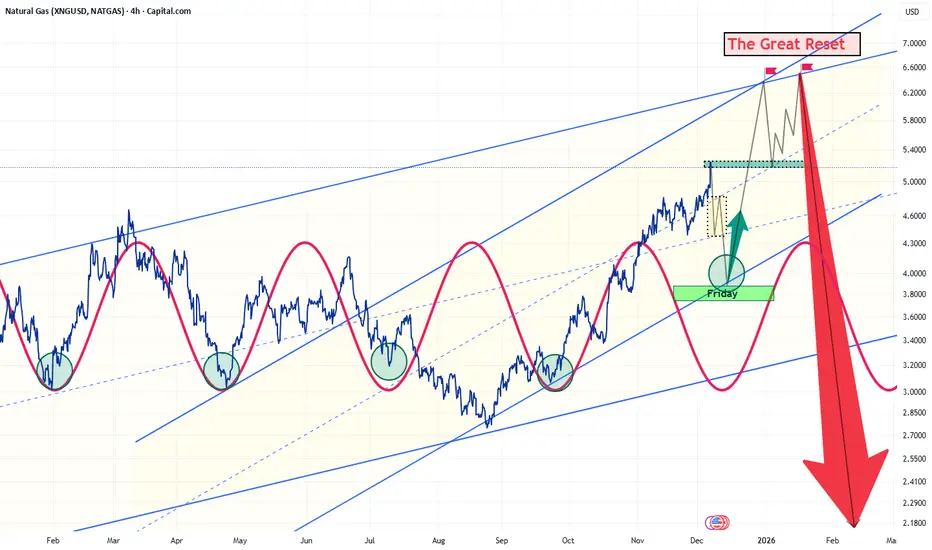
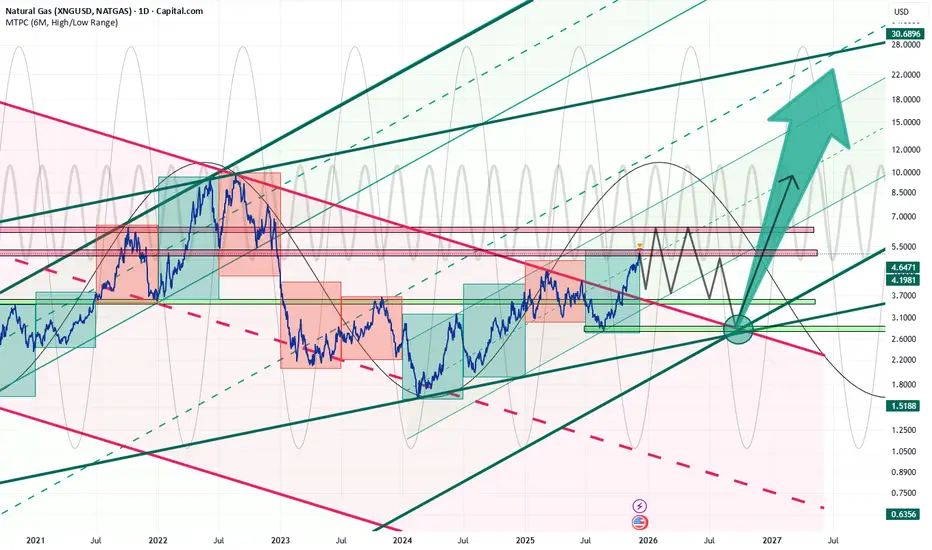
the Big Picture, and the next Friday weekly HammerFrom a technical perspective, Natural Gas is nearing a high-conviction inflection point. The weekly hammer that will be formed into Friday’s close (12.12.2025) indicates a potential shift in market structure following the optimal accumulation zone around 4.9. This configuration favors a sharp, impulsive rally over the next 2–3 weeks, with a likely target at the long-term channel resistance near 6.4. The emerging double-top formation suggests a setup for a notable momentum reversal.
On the macroeconomic side, the ongoing “Great Reset” is expected to exert downward pressure across major risk assets over the next six months. Volatility is rising, and global markets are entering a corrective phase.
Natural Gas (NG) – Multi-Timeframe Technical AnalysisNatural Gas (NG) – Multi-Timeframe Technical Analysis
Monthly (1M)
Price has pushed into the 4.80 zone, which corresponds to the previous major monthly high. The last three monthly candles are bullish, showing strong upward momentum, but NG is now entering a significant historical resistance area.
Weekly (1W)
Volume is rising, indicating strong participation. Price bounced cleanly from the retest zone, and the current candle remains green, but buyers are now encountering notable resistance at the top of the range.
Daily (1D)
Clear wick rejection around 4.85, showing that sellers are defending this level.
MACD is showing mild crossovers and losing momentum.
RSI is overbought and making a bearish crossover — often a sign of short-term exhaustion.
4-Hour (4H)
A potential double-top pattern is forming at the 4.85 resistance, which supports the idea of weakening bullish momentum on the lower timeframes.
Natural Gas remains bullish on higher timeframes, but the 4.80–4.88 zone is acting as a strong resistance cluster. Lower timeframes are already showing signs of momentum fading.
If bulls fail to break above 4.88, a short-term correction is likely.
A clean breakout above this area would invalidate bearish signals and could open the next leg toward higher Fibonacci levels.
History might repeat itself on Natural GasNatural Gas in a breakout. Just a potential scenario to look for.

Multi-Cycle Alignment Points to Sharp DownturnThe chart presents a sophisticated multi-cycle composite model overlaid on the prevailing Natural Gas trend. Notably, all four cycles will converge during the January–February 2026 window, creating a concentrated alignment that signals the likely emergence of the second major peak.
When multiple cycles reach their highs in unison, this synchronicity often delineates a critical market turning point—especially here, where prices are confronting significant resistance and aligning with the prior peak from September 2021. This formation suggests a heightened probability of a strong downward phase, potentially initiating a broader structural market correction.

Natural Gas Bulls Eye 5.000 as Market Shows Overbought Trap🔥 NATURAL GAS DAY TRADE BLUEPRINT — BULLS TARGETING THE 5.000 ZONE! 🔥
**📈 XNG/USD — “NATURAL GAS” Commodities CFD
Market Trade Opportunity Guide (Day Trade)**
🧭 TRADE PLAN (Bullish Momentum Outlook)
Asset: XNG/USD “NATURAL GAS”
Plan: Bullish
Entry: Any price level based on your strategy
🛡️ STOP LOSS SETUP
Stop Loss: This is thief SL @ 4.700
Dear Ladies & Gentleman (Thief OG's), adjust your SL based on your own strategy & your risk conditions.
Note: Dear Ladies & Gentleman (Thief OG's), I am not recommending to set only my SL. It’s your choice — you make money & take money at your own risk.
🎯 TARGET ZONE
Police barricade acts as a strong resistance + market is overbought + a trap is visible, so escape with profits.
OUR Target: 5.000
Note: Dear Ladies & Gentleman (Thief OG's), I am not recommending to set only my TP. It’s your choice — you make money & take money at your own risk.
🔗 RELATED PAIRS TO WATCH (Correlation & Key Notes)
Here are highly relevant pairs connected to Natural Gas through USD strength, risk sentiment, energy market flows, and commodity-currency behavior:
1️⃣ USD/CAD (🇺🇸 USD vs 🇨🇦 CAD)
🔑 Key Points / Correlation:
Canada is a major energy exporter, so CAD often strengthens when energy (including Natural Gas) rises.
If XNG/USD pumps, CAD may gain → USD/CAD can show downside pressure.
Watch for correlation shifts during high-impact USD news.
2️⃣ WTI Crude Oil – USOIL (🛢️ Energy Sector Lead Indicator)
🔑 Key Points / Correlation:
Oil and Natural Gas are part of the same energy complex; they often move in tandem.
Strong oil = strong sentiment for energy markets.
If USOIL is bullish, it often supports XNG upside continuation.
3️⃣ DXY – US Dollar Index (💵 USD Strength Barometer)
🔑 Key Points / Correlation:
XNG/USD is priced in USD.
Strong DXY = natural gas usually corrects.
Weak DXY = commodity prices typically lift.
Always check DXY trend before entering Natural Gas trades.
4️⃣ EUR/USD (💶 Major USD Flow Indicator)
🔑 Key Points / Correlation:
Higher EUR/USD = weaker USD = bullish pressure on XNG/USD.
When EUR/USD is rising strongly, most USD-denominated commodities get a tailwind.
5️⃣ USD/CHF (🇺🇸 USD vs 🇨🇭 CHF — Safe-Haven Gauge)
🔑 Key Points / Correlation:
Natural Gas rises during risk-on conditions.
USD/CHF dropping signals safe-haven outflow → adds strength to commodity markets like XNG.
6️⃣ GBP/USD (🇬🇧 GBP vs USD — USD Sentiment Mirror)
🔑 Key Points / Correlation:
GBP/USD rising = weaker USD = supports Natural Gas bullish legs.
Acts as a secondary USD trend confirmation pair.
7️⃣ AUD/USD (🇦🇺 Commodity Currency Pair)
🔑 Key Points / Correlation:
AUD is a commodity-linked currency; rises when global commodities strengthen.
AUD/USD strength can confirm an overall commodity-bullish environment supporting XNG upside.
📌 FINAL NOTE
Trade smart, monitor correlations, and adjust risk according to your own strategy — protect capital first, profit next. 🔥📊

Natural Gas - New 52 Week High? Natural Gas appears to be setting up another bullish move this week.
A sweep of its 52 week high seems very likely.
If this sweep of the massive March 2025 high pivot occurs there is a very high probable day trade short scalp opportunity.
I'm watching the next inventory report on Thursday very closely.

LNG: $5 Jan. Futures as Cold Snap & Record Exports Drain Storage* Due to the platform's features, the charts are arranged in sequence from left to right, from the first to the ninth chart. The charts were created by our team and based on an analysis from Bloomberg and the EIA data. This analysis was conducted in cooperation with Anastasia Volkova, analyst of LSE.
Natural gas enters Week 49 with a notable shift, as January 2026 futures breach the $5/MMBtu mark-28-32% above year-ago levels-driven by a historic cold snap and peak LNG exports. The entire 2026 curve now sits well above the 15-year upper quartile, with a rare inversion (2026 > 2027) of 40-70 cents signaling intense near-term demand. Storage is set to fall -13 BCF for Week 48 (November 28), beating the 5-year average draw of -31 BCF, leaving inventories at 3,922 BCF-still 208 BCF above the median but 29 BCF below 2024. HDD+CDD values hit 30-year highs, with further spikes forecast until December 5-6 before normalizing.
Current prices compared to price dispersion 10 days before expiration by month since 2010
Cold weather in the US and record LNG flows continue to provide strong support for natural gas prices. January 2026 futures are already trading confidently around the psychological mark of USD 5.00/MMBtu, which is approximately 28-32% higher than the same contract a year earlier. The entire 2026 futures curve is now significantly above the upper limit of the interquartile range for the last 15 years and, notably, significantly exceeds the 2027 quotes (the gap reaches 40-70 cents for most months). Possible reasons for this curve inversion (2026 > 2027) include a combination of factors: expectations of very cold weather, maximum utilization of export terminals, plans to commission large volumes of new LNG capacity, and high demand from the energy sector for new data centers.
Forward curve compared to 2020-2025
The shape of the 2025 forward curve on nearby contracts has broken away from the 2023-2024 ranges, but contracts with delivery in two years and beyond continue to show clear price stabilization at historically stable levels.
Current stocks and forecast for next week compared to 2019-2024
According to the forecast for week 48 (November 28), gas reserves in underground storage facilities will decrease by -13 BCF, which is higher than the average of -31 BCF over the past five years. At the same time, the stock level will reach 3922 BCF, which is 29 BCF lower than the 2024 level, but 208 BCF higher than the 5-year average.
HDD+CDD based on current NOAA data and forecast for the next two weeks compared to 1994-2024
Currently, the total HDD + CDD (heating and cooling degree days) indicators for all climatic regions of the United States are at their highest level in decades relative to the 30-year climate norm. According to meteorological model forecasts, the increase in degree days will continue until December 5-6, after which a decline will begin, and by December 10-12, values will return to normal seasonal norms.
HDD+CDD based on current NOAA data and forecast compared to 1994-2024 by region
As of December 3, in terms of regions, the peak number of degree days is expected in the coming week, exceeding the upper interquartile range in the central regions of EN, ES, WN, WS, and South Atlantic. After December 10, the weather is expected to stabilize and return to average levels and below.
Daily supply/demand difference compared to 2014-2024
As of December 3, the difference between supply and demand in 2025 is above the maximum level for 2014-2024. The main drivers of demand growth over supply are increased consumption for industry, power generation, and household consumption due to cold weather. LNG exports are at peak levels.
Number of days for delivery from warehouses
The graph shows the number of days of supply from storage alone, based on current consumption levels. As of December 3, reserves are sufficient for ≈27 days, which is 1 day less than in 2024, 7 days below the average, and at the lower end of the 10-year minimum range. With this level of reserves and consumption, even minor disruptions in production or spikes in demand could cause sharp price reactions, especially in late winter and early spring.
Filling level of European storage facilities
The overall level of gas storage in Europe on December 3 fell by 2.7% over the week and stands at 74.9%, which is 10.5% below the average level and 10% lower than last year.
Electricity generation by source
Compared to last week, gas generation in the US48 energy balance on December 3, 2025, increased significantly to 43.9% of the total (+3% for the week). The share of nuclear generation decreased by 2% to 18% and is below the 5-year low. The share of coal generation increased by 1.5% to 19.7% and is at an average level. Wind (7.8%) and solar (3.2%) decreased slightly compared to last week.

Lines dont lie-Sep.2026 we have definitively broken out of the descending channel. Currently, the market is facing two potential upward channels. The breakout from the red triangle will determine which of these channels we will follow. Based on anticipated global economic conditions and the market’s geometric dynamics, channel 2 appears to be the more logical trajectory. Price movement toward the borders of channel 2 has so far respected the integrity of the 6-month candle.
September 2026 is projected to mark the point where buyers will fully align, completing the dynamic termination of the first wave and forming a significant second-wave structure.
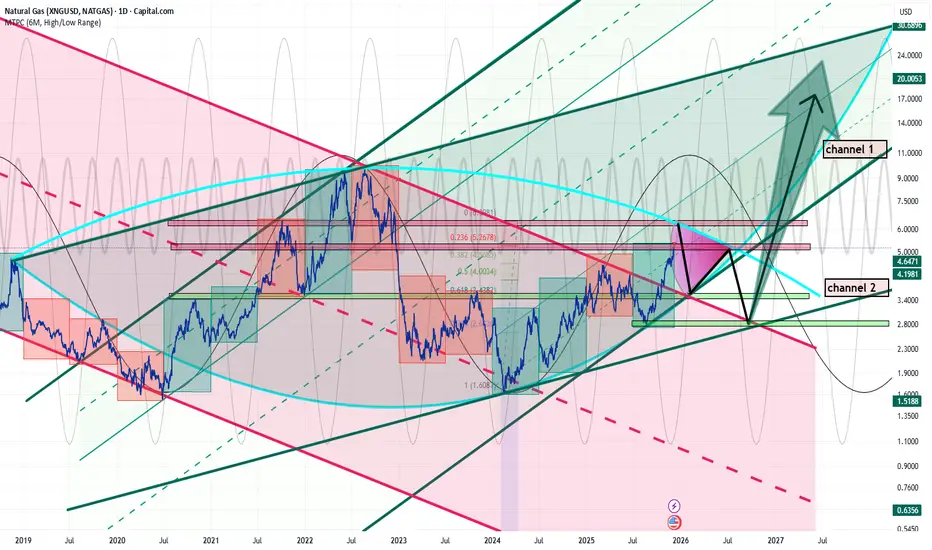
Geometrical Projection 2026: a New Bullish Era Sep.2026By early 2026, we anticipate the emergence of a new six-month green candle. Following this, a downward correction is expected, with the possibility—though not certainty—of forming a second peak in May. Ultimately, the projection points toward a retest of the bottom of the current six-month candle, signaling an exit from the five-year descending channel and defining the lower boundary of a new ascending channel. By September 2026, geometric patterns and buyer alignment suggest the potential onset of a new bullish era.
Natural Gas: The Rally Continues!!Technical Analysis & Order Flow
1. Natural Gas (NATGAS) - The Primary
Weekly/Daily: Price has broken out of a multi-year base. The strong impulse candles suggest institutional buying. We are likely in Level 3 of a standard Market Maker cycle (the trending phase).
4H Structure: Price is making clear Higher Highs and Higher Lows. The recent pause at 4.437 is a Bullish Consolidation (Time Correction).
Liquidity: There is "clean" buy-side liquidity above 4.500. A break of this level will likely trigger a gamma squeeze to 4.800.
Order Block: The 4.350 level represents a key Bullish Order Block (previous resistance turned support) on the 1H chart. We want to see price wick into this zone and reject lower prices.
2. DXY (US Dollar) - The Inverse Indicator
Analysis: DXY is currently testing a major resistance zone at 100.20 – 100.50 (Blue Box on your chart).
Trigger: If DXY rejects this level and drops toward 99.00, it provides a massive tailwind for Commodities (incl. NatGas of course).
Caution: A DXY 4H candle close above 100.50 would invalidate the immediate bullish momentum for Gas.
3. Peabody Energy (BTU) - The Correlation (Coal/Energy Sector)
Analysis: BTU is lagging behind the Gas rally but is finding support at the 26.00 level.
Signal: We watch for BTU to break above 26.50. If Coal starts rallying, it confirms the broader "Energy Sector" bid, adding confidence to the Nat.Gas long.
Execution Strategy
Monday Open: Gap open likely! We don't chase the gap up if it opens above 4.500.
The "Trap": We watch for a False Move (Stop Hunt) lower during the London session (approx. 3:00 AM - 5:00 AM ET) down into the 4.380 area.
Entry Trigger: We enter long when we see a 15m bullish engulfing candle or a W-Pattern forming inside the 4.350-4.380 zone.
Trade Management :
We move Stop Loss to BE once price clears 4.500;
Verdicts:
Technical Trend: ✅ Strong Bullish
Seasonality: ✅ Bullish (Winter Heating Demand)
Volume Profile: ✅ Expanding on Up-moves
Trade Probability: High (80%+)

Natural gas going upPrice is resting on 2 diagonal trendlines and 1 level of intrest right now. buy when one hour candle closes green.
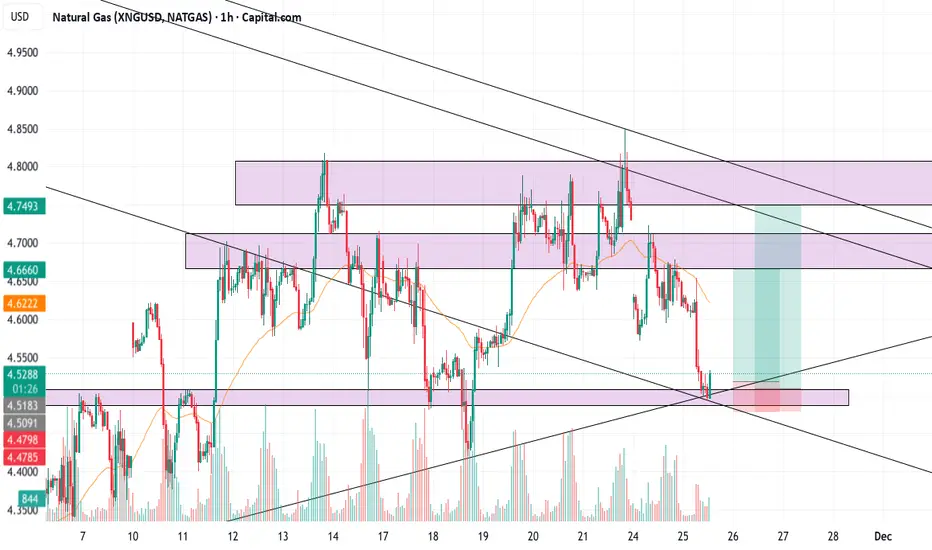
Natural Gas CFD analysisThanks for the chart! I can read it clearly. Here’s a quick actionable outlook based on what you’ve shared 👇
⸻
📊 NATURAL GAS – 1H (CFD) Analysis
Current price: 4676
The chart shows:
🔹 Key Levels
Type Level
Buy Reversal 4687.6
Break Down 4629.5
Sell Reversal 4804
Breakout 4862.1
🎯 Upside Targets (if price sustains above 4687.6)
• 4930.1
• 4962.3
🎯 Downside Targets (if price breaks & sustains below 4629.5)
• 4561.5
• 4529.3
⸻
📌 Trading Plan Based on Levels
🟢 Bullish Scenario
If 4687.6 breaks & holds
Buy above 4688
SL: 4658
TP1: 4730
TP2: 4800
TP3: 4930
Reason: Trendline support + potential buy reversal zone
🔴 Bearish Scenario
If 4629.5 breaks & closes below
Sell below 4628
SL: 4660
TP1: 4560
TP2: 4530
Reason: Structure breakdown leads to lower zone targets
⸻
🧠 What to Watch
✔ Strong bullish reaction from green trendline support
❗ Still lower highs forming → needs confirmation above 4687.6
⚡ Volatility expected around US session / inventory updates
⸻

NAT-GAS | Approaching Resistance After Geopolitical ShockNatural gas has surged sharply in recent sessions, partly reflecting renewed geopolitical tension after the latest developments in Ukraine. Markets tend to price in supply-risk premiums quickly, especially when the backdrop involves infrastructure vulnerability and winter demand approaching. This rally has now carried price directly into a major resistance zone around 4.75–5.00.
Technical Lens:
The chart shows a clean breakout from the multi-month descending structure, followed by an impulsive leg upward with very shallow pullbacks. Price is now pressing into a clear supply area that previously capped rallies. How it behaves here will likely define the next swing.
Scenarios:
• If the resistance zone holds:
Price may stall as early longs take profit and volatility compresses. This region acted as a distribution area earlier in the year, and the recent rally has travelled a long way without a meaningful pause. A cooling-off phase would make sense if geopolitical volatility eases or if weather forecasts soften demand expectations.
• If the zone breaks:
A decisive push through 5.00 would suggest the market is repricing the risk environment more aggressively. Concerns about Ukrainian infrastructure, higher LNG import dependence, or colder-than-expected winter conditions could support continuation. In that case, the same zone could turn into support on any retest.
Catalysts:
Short-term drivers include updates on Ukrainian supply risks, European storage commentary, and upcoming weather models. Any shift in these inputs could determine whether resistance holds or gives way.
Takeaway:
The 4.75–5.00 zone is the key decision point. The market either cools off here after a stretched run, or it confirms a more structural shift in sentiment by breaking above it.

Natural Gas: Correction Ahead?Pullback expected after five weeks of growth; key levels 4.283 and 4.194 in focus.
This analysis is based on the Initiative Analysis (IA) method.
Hello, traders and investors!
After five weeks of steady growth, natural gas now appears to be preparing for a correction.
On the daily timeframe, a sideways range has formed, and the seller’s formal target inside this range has already been reached.
On the 4-hour timeframe, we also see a sideways structure, but seller initiative is active. The current seller target is 4.194.
A large volume cluster has formed at the upper boundary of the range, and the price is now breaking downward from that area. This zone becomes a broad seller area at the top of the range.
It’s important to watch how the price reacts around 4.283, which represents 50% of the trading range. For now, the expectation remains the same: a move toward 4.194.
A good area to look for short entries would be around 4.392, if the price gives a pullback into that zone.
Wishing you profitable trades!

Is This the Start of the Next Natural Gas Upswing?💨 Natural Gas (XNG/USD) — “Profit Pathway Setup” 🎯 Swing / Day Trade Edition
📊 Market Overview:
The Energies Market is heating up — and Natural Gas is showing its next potential boom move! After a confirmed Moving Average Breakout, bulls are sneaking back in. 🕵️♂️
This setup blends discipline + creativity, using the Thief-Trader layered entry method — designed to catch price action efficiently while minimizing emotional errors. ⚙️
⚔️ Trade Plan (Bullish Setup):
Entry Zones (Layered Buys):
🟩 3.500
🟩 3.600
🟩 3.700
(You can expand your buy layers depending on your own comfort and risk plan.)
Stop-Loss (Thief SL):
🧯 3.350 — just below the nearest lower-low candle wick.
💬 Dear Ladies & Gentlemen (Thief OG’s) — this SL is a personal style choice, not a fixed rule. Manage your risk your way.
Target (Profit Escape Zone):
🎯 4.100 — a strong resistance + overbought + trap + distribution zone.
💬 Reminder: I’m not forcing my TP; you’re the boss of your own bag — make your profits, then take them! 💰
📈 Why This Setup Works:
🧠 Technical Confirmation: MA breakout = bullish continuation in progress.
🎯 Layering Strategy: Multiple limit orders reduce average cost + improve flexibility.
🏗️ Structural Setup: Clear accumulation → breakout → markup pattern emerging.
🧩 Exit Logic: Resistance + trap-zone = high-probability exit zone for profit capture.
🌍 Related Assets to Watch (Correlation Check):
💹 NYMEX:NG1! — Natural Gas futures benchmark, strong global mirror.
AMEX:UNG — U.S. NatGas ETF; sentiment confirmation.
🛢️ BLACKBULL:WTI / BLACKBULL:BRENT — closely tied to energy flow; when oil strengthens, gas often follows.
⚡ TVC:DXY — dollar strength can inversely impact commodity demand.
💵 FX:EURUSD — macro correlation to risk appetite across energy & FX.
Keep eyes on these pairs — their momentum helps confirm or contradict your NatGas bias. 👀
📌 Key Takeaways:
✅ Trend Bias: Bullish
💪 Setup Type: Swing / Day Trade hybrid
🧮 Risk : Reward: Favorable above 1 : 3
⏳ Holding Window: Short-term → Mid-term (2 – 5 days typical)
🧭 Trade Management: Stick to your plan — don’t chase, layer smart.
⚠️ Pro Tip:
If price breaks below 3.350, it’s a signal to step aside — no hero moves. 🛑
Price structure > emotions. Stay patient, and let the plan do the heavy lifting. 🧘♂️
✨ “If you find value in my analysis, a 👍 and 🚀 boost is much appreciated — it helps me share more setups with the community!”
#NaturalGas #XNGUSD #EnergyTrading #SwingTrading #DayTrading #TechnicalAnalysis #BreakoutStrategy #CommodityTrading #ForexTrading #TradingIdeas #RiskManagement #MarketAnalysis #EnergyMarkets #TradingView #ChartAnalysis

We would buy quite a lot of NATGAS when $2 levels are reachedWe hope the price will go down so we can buy cheaper

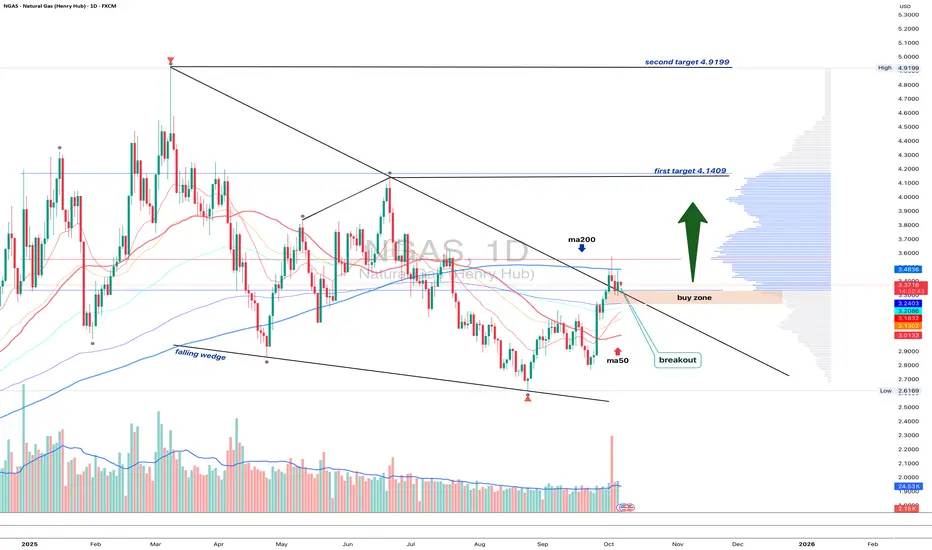
NGAS 1D - bulls waiting for the green lightOn the daily chart, Natural Gas has broken out of a falling wedge, but price remains below the MA200, while EMA still hovers above it - a mixed signal showing short-term hesitation within a longer-term downtrend.
The 3.10–3.20 buy zone remains key - that’s where the retest area aligns with short-term support. If buyers can reclaim the EMA and push above the MA200, the next upside targets are 4.14 and then 4.92.
Volume on the breakout supports growing bullish interest, while fundamentals - like rising seasonal demand - may soon add more fuel to the move.
Tactically , watch how price behaves near MA200. Once EMA flips back on top, momentum could accelerate fast. Until then, the market’s like a gas burner waiting for that click - ignition pending
Naturalgas analysis
📊 NATURAL GAS – 1H (CFD) Analysis
Current price: 4676
The chart shows:
🔹 Key Levels
Type Level
Buy Reversal 4687.6
Break Down 4629.5
Sell Reversal 4804
Breakout 4862.1
🎯 Upside Targets (if price sustains above 4687.6)
• 4930.1
• 4962.3
🎯 Downside Targets (if price breaks & sustains below 4629.5)
• 4561.5
• 4529.3
⸻
📌 Trading Plan Based on Levels
🟢 Bullish Scenario
If 4687.6 breaks & holds
Buy above 4688
SL: 4658
TP1: 4730
TP2: 4800
TP3: 4930
Reason: Trendline support + potential buy reversal zone
🔴 Bearish Scenario
If 4629.5 breaks & closes below
Sell below 4628
SL: 4660
TP1: 4560
TP2: 4530
Reason: Structure breakdown leads to lower zone targets
⸻
🧠 What to Watch
✔ Strong bullish reaction from green trendline support
❗ Still lower highs forming → needs confirmation above 4687.6
⚡ Volatility expected around US session / inventory updates
⸻
