Beearish Double TOP - NATGASHello traders,
NATGAS has completed a Double Top formation.
The neckline has been decisively broken,
confirming bearish momentum in the market.
🎯 TARGET: 2.8450
What traders are saying

XNG Expectation: 1WeekFrom NATURAL GAS is in support zone now 3.0624 point, and it can start the increase, first 3.8256 point and second 4.6148 points, under this point price can decrease near 2.5 point.

Natural Gas - Back to a Key AreaNatural Gas is now retesting the gap, and this is happening right on top of a strong weekly support. That combination matters.
When price comes back to fill a gap and sits on higher-timeframe support, it usually turns into a decision point rather than a random bounce.
As long as this weekly support holds, the plan is clear:
👉 we’ll be looking for longs, patiently, with confirmation.
If buyers defend this zone, upside continuation becomes the higher-probability scenario.
If not, then we step aside and reassess. Simple.
Let the level do the work. 👀📈
⚠️ Disclaimer: This is not financial advice. Always do your own research and manage risk properly.
📚 Stick to your trading plan regarding entries, risk, and management.
Good luck! 🍀
All Strategies Are Good; If Managed Properly!
~Richard Nasr

Why Natural Gas is a Coiled Spring
Accumulation zone within a narrow range after a 25% drop. In technical analysis, this often means that major players are "vacuuming up" the supply from panicked retail traders, forming a bottom.
Following a sharp decline in early February, a massive amount of short positions has accumulated in the market. Any hint of frost forces these traders to buy back gas to close their trades. This creates a landslide-like price increase.
This is a unique technical moment. The price of gas has fallen over the last 3 days, while the "quality" of the weather over the last 2 days has become much more "bullish." This divergence between meteorological reality and price always closes in favor of the weather.

Asymmetric War Trade – $3.90 Anticipatory Entry Targeting $9.901. Revised Technical Analysis
Current Price: $3.82
New Proposed Entry: $3.90
New Stop-Loss: $2.90
A. Logic of the New Entry Scheme
Early Entry: Entering at $3.90 anticipates an earlier confirmation of the rebound, based on:
The active bullish divergence on the CCI
The immediate proximity of the current price ($3.82)
The intent to capture upward movement before the major Fibo resistance
Improved Risk/Reward Ratio: The lower entry and tight stop create a superior R:R.
B. Calculation of the New Risk/Reward Ratio
Risk per unit: $3.90 - $2.90 = $1.00
Reward to TP1 ($8.16): $8.16 - $3.90 = $4.26
Base R:R: 1:4.26 (Extremely favorable)
Reward to TP2 ($9.90): $9.90 - $3.90 = $6.00 → R:R 1:6
C. Required Technical Validation for $3.90
Minimum Condition: Weekly close above $3.85 + CCI maintaining its ascent
Additional Confirmation: Break above $4.50 as a first intermediate signal
2. Revised Scenarios with New Levels
Optimized Bullish Scenario
Entry: $3.90 (buy on current strength)
Stop-Loss: $2.90 (-25.6% from entry)
Targets:
TP1: $5.80 (+48.7%) - First Fibo test
TP2: $6.70 (+71.8%) - Major breakout
TP3: $8.16 (+109.2%)
TP4: $9.90 (+153.8%)
Invalidation Scenario
The stop at $2.90 invalidates the thesis if:
The CCI divergence fails
Price fails to surpass $4.50
Fundamental downward pressure prevails
3. 2026 Geo-Economic Analysis - Impact on Strategy
Impact of the New Scheme on Crisis Management
Lighter Initial Position possible thanks to the favorable R:R
Reduced Capital at Risk: $1.00 initial risk vs. potential $6.00+ move
Increased Flexibility to:
Add on the breakout of $6.70
Fund geopolitical hedges
Recalculated Extreme Price Scenarios
From $3.90:
Moderate crisis scenario ($12): +207%
Major crisis scenario ($20): +412%
Catastrophe scenario ($25): +541%
4. Detailed Execution Plan
Step 1: Initial Entry
Level: $3.90
Size: Core position (50% of planned exposure)
Condition: CCI > -50 and price > $3.85 on daily close
Step 2: Post-Entry Management
First target: $4.50 → Move stop to $3.40
Critical threshold: $5.00 → Technical stop to $4.00
Decision zone: $5.50-$5.80 → Prepare addition or reduction
Step 3: Conditional Additions
Addition 1: On breakout of $5.80 (+33% from TP1)
Addition 2: On confirmation > $6.70
Unified stop after additions: $5.20
5. Trade Dashboard
Metric Value Comment
Entry $3.90 Anticipatory level
Stop-Loss $2.90 -25.6% risk
Unit Risk $1.00
TP1 ($5.80) +48.7% R:R 1:1.9
TP2 ($6.70) +71.8% R:R 1:2.8
TP3 ($8.16) +109.2% R:R 1:4.3
TP4 ($9.90) +153.8% R:R 1:6.0
Crisis Scenario ($15) +284.6% R:R 1:11.1
6. Final Recommendations
Advantages of the New Scheme
Exceptional R:R: Even with 30% success rate, the mathematical expectancy is positive
Early Exposure to geopolitical movements
Tight Stop limiting losses in case of failure
Specific Risks
Stop too tight: Risk of premature exit on normal volatility
Lack of confirmation: Entry without Fibo validation
Adaptation to 2026 Conditions
Allocation: 3-5% of capital on this anticipatory scheme
Complementary Hedge: Call options at $6.00 to cover the intermediate phase
Enhanced Monitoring between $3.50-$4.50 for dynamic adjustment
Strategic Conclusion:
The revision to a $3.90 entry with a $2.90 stop transforms this trade into an asymmetric opportunity:
Limited Risk: $1.00 per unit
Unlimited Potential through geopolitical leverage
Optimal Positioning for the dual contingency:
Slow technical realization towards $5.80-$6.70
Triggering geopolitical event (the true 2026 catalyst)
"This strategy anticipates that the first signal of geopolitical escalation will send natural gas well beyond $4.50, making the $3.90 entry retrospectively very low. The $2.90 stop is the price to pay for this anticipation."

But natural gas for 20% upmove in short timeAccording to wave analysis
natural gas can give 1:4 risk reward

Natural Gas at Decision Zone! Waiting For The Price DirectionNatural Gas at Decision Zone! Waiting For The Price Direction
After a strong impulsive rally, Natural Gas entered a consolidation phase, forming a clear range between 3.40 and 3.70. This zone is now acting as a key decision area for the next major move.
🔼 Bullish Scenario:
If price manages to break and hold above 3.70, bullish momentum could resume. A successful breakout would open the path toward the next resistance targets at 3.93 and 4.21, confirming continuation of the broader uptrend.
🔽 Bearish Scenario:
A breakdown below 3.40 would increase selling pressure, exposing lower targets at 3.23 and potentially 2.96, where stronger demand is expected.
You may find more details in the chart!
Thank you and Good Luck!
❤️PS: Please support with a like or comment if you find this analysis useful for your trading day❤️

Natural Gas at Channel Resistance — Pause or Break?Natural Gas is testing the upper boundary of its ascending channel. Structure remains constructive, but momentum is starting to look a bit stretched into this level. From here, price either pauses and mean-reverts within the channel, or acceptance above opens the door to upside continuation. Reaction here matters.

Natural Gas → XNG/USD Bullish Trading Framework⚡ XNGUSD NATURAL GAS 🔥 Energy Market Capital Flow Blueprint 📊 DAY TRADE
🎯 TRADING PREMISE
Bullish Setup: Triangular Moving Average Breakout with Support Retest Confirmation
Current Market Status (January 26, 2026) 📍
Current Price Range: $6.00 - $6.30 USD/MMBtu (Historic Winter Storm Rally 🌪️)
Market Movement: +20% surge this week | +90% gain since last week
Largest Weekly Advance: Since records began in 1990 📈
Henry Hub Spot Price: $4.98/MMBtu (Up from $3.12 last week)
💡 TECHNICAL BREAKDOWN
Pattern Recognition 🔍
✅ Contracting Triangle Formation - 5-leg consolidation structure complete
✅ Moving Average Support Holds - Dynamic support level providing retest opportunities
✅ Bullish Bias Confirmed - Price action shows sustained strength above key MAs
✅ Resistance Zones Identified - Multiple profit-taking levels established
Key Technical Levels 📍
Support Zone: $5.00 - $5.100 (Primary dynamic support)
Consolidation Range: $5.200 - $5.400 (Thief Entry Layers)
Breakout Target Zone: $5.900 - $6.200 (Aggressive profit capture)
Extended Target: $6.500 - $7.000+ (If production disruptions persist)
🕵️ THIEF STRATEGY - LAYERED ENTRY BLUEPRINT
Entry Strategy: Multi-Layer Limit Order Approach 🎪
The "THIEF" Method uses strategic layering to accumulate positions at optimal price levels, minimizing emotional trading and maximizing efficiency:
Recommended Limit Order Layers:
🥇 Layer 1 @ $5.100 - Initial dip retest entry (First position)
🥈 Layer 2 @ $5.200 - Continued support averaging down (Add position)
🥉 Layer 3 @ $5.300 - Zone confirmation accumulation (Build size)
💎 Layer 4 @ $5.400 - Consolidation break final entry (Complete setup)
Entry Flexibility: You can adjust these layers based on your individual risk tolerance 💰, account capital allocation 💵, market volatility conditions ⚡, and personal trading rules 📋
✅ Pro Tip: Use 15-30 minute timeframe chart for precise layer execution & optimal entry confirmation
🎯 PROFIT TARGET STRATEGY
Primary Target: $5.900 - $6.100 USD/MMBtu
Reasoning:
Strong resistance confluence zone
Overbought warning signals emerging
Technical trap potential at extreme levels
Profit-taking anticipated from institutional players
Secondary Targets (Optional - Aggressive Traders Only) 🚀
Target 2: $6.300 - $6.500 (If momentum sustains)
Target 3: $6.800+ (Only if extreme cold continues)
🛑 STOP LOSS MANAGEMENT
Thief Strategy SL: $5.000 USD/MMBtu
Placement: Just below primary support consolidation
Reasoning: Clean break confirmation of bullish premise failure
📊 FUNDAMENTAL DRIVERS - REAL MARKET DATA 🔥
🌡️ WEATHER IMPACT (PRIMARY CATALYST)
Historic Winter Storm: Arctic blast across USA disrupting supply & boosting heating demand
Production Disruption: ~10% of US natural gas production knocked offline due to freezing
Texas & Louisiana: Production dropped >17 billion cubic feet/day from mid-January peaks
Grid Impact: US power demand expected to reach winter record levels
Temperature Forecast: Frigid conditions continuing through January 26-28, 2026
💨 SUPPLY-DEMAND IMBALANCE
Supply-Side Pressures:
↓ Production fell to 106.9 Bcf/d (down from 109.7 Bcf/d in December)
↓ Daily production hit 2-year low near 92.6 Bcf/d due to weather
↓ LNG export flows fell to lowest level in 1 year (equipment frozen)
↓ 37 LNG vessels departed US ports (139 Bcf carrying capacity stranded)
↓ Freeport terminal nominations cut 41% | Cove Point halved
Demand-Side Surge:
↑ Electric power generation demand surging for heating & cooling
↑ Residential heating demand at seasonal peaks
↑ Industrial fuel switching to gas from displaced alternatives
🏭 STRUCTURAL LONG-TERM FACTORS
LNG Expansion: New capacity additions (Golden Pass, Plaquemines, Corpus Christi Stage 3)
Data Center Boom: AI infrastructure explosion creating sustained power demand
2027 Outlook: EIA forecasts 33% price increase to $4.60/MMBtu average
Storage Status: Working inventory at 3,065 Bcf (+177 Bcf vs 5-year average)
📈 ECONOMIC CALENDAR - KEY UPCOMING FACTORS
This Week (Late January 2026) 🔴
⛈️ Winter Storm Monitoring: Cold snap continues affecting production
📊 EIA Storage Report: Thursday release (expected further draws)
🏛️ NYMEX Funding Flows: COT report showing speculative positioning
💨 Production Rate Tracking: Daily output watching for recovery
Next Month (February 2026) 📅
🌡️ Temperature Normalization: Potential warm-up easing heating demand
🛢️ LNG Terminal Recovery: Equipment repairs bringing export capacity back online
📊 EIA Q1 Forecast Update: February 10 release with fresh projections
📈 Q1 Storage Withdrawal Season End: March signals transition to injection phase
Strategic Considerations 🎯
Geopolitical: Watch Middle East tensions (impacts global LNG flow)
Production Recovery Timeline: Key risk factor for downside
Weather Pattern Shifts: La Niña vs El Niño transition possible
Data Center Power Demand: Sustained long-term upside driver
📍 CORRELATED PAIRS TO MONITOR 👀
Direct Correlation Watches:
1. 🛢️ ICMARKETS:XTIUSD - WTI Crude Oil
Correlation: +0.65 positive (alternative energy pricing)
Why Watch: Oil prices influence natural gas demand & substitute competition
Current Action: Oil weakness could support gas as substitute
Technical Link: Both energy markets tracking geopolitical risk
2. 🌍 ICMARKETS:XBRUSD - Brent Crude Oil
Correlation: +0.60 positive (global energy marker)
Why Watch: International energy benchmark influencing global LNG pricing
Current Action: Brent decline may increase relative gas attractiveness
Technical Link: European gas prices tied to Brent dynamics
3. 💵 THINKMARKETS:USDINDEX - US Dollar Strength
Correlation: -0.45 inverse (commodity pricing relationship)
Why Watch: Stronger USD = lower commodity export values
Key Level: Watch DXY weakness supporting commodity upside
Trading Insight: Weakening dollar = tailwind for XNGUSD rally
4. ⚡ OANDA:XAUUSD - Gold Prices
Correlation: +0.35 positive (risk-on sentiment)
Why Watch: Risk appetite indicator for commodity markets
Current Setup: Gold strength confirms inflation hedge positioning
Broader Signal: Both rallying = risk-on energy environment
5. 📊 AMEX:SPY - S&P 500 Index
Correlation: +0.40 positive (economic health)
Why Watch: Stock market rallies increase overall economic energy demand
Tech Impact: Data center power surge linked to tech stock valuations
Risk Signal: Equity market weakness could signal recession/lower demand
Secondary Watch Pairs:
UKOIL (UK Brent Comparison) - European gas market barometer
TTF European Gas Futures - Global LNG competitor pricing
Asian LNG Spot Prices - International demand signals
Henry Hub Futures Strips - Forward market pricing expectations
🚨 RISK WARNINGS & TRADING NOTES
CRITICAL TRADING RULES ⚠️
✅ DO:
Set YOUR OWN stop losses based on YOUR risk tolerance
Adjust profit targets according to YOUR strategy
Use position sizing appropriate for YOUR account
Trail stops as price moves favorably in your direction
Follow YOUR personal capital management rules
Respect technical support/resistance zones
Wait for confirmation before aggressive entries
❌ DON'T:
Blindly follow ANY trader's targets (including this analysis)
Risk more capital than you can afford to lose
Ignore news events & volatility spikes
Trade against the current trend without confirmation
Use leverage beyond YOUR comfort level
Skip your stop loss to "hope" for recovery
Make emotional decisions based on FOMO
Market Volatility Notice 📢
Natural gas is HIGHLY VOLATILE - expect sharp intraday moves
Winter weather can create GAPS - gaps exceeding 10-15% possible
News events cause LIQUIDITY SHIFTS - spreads may widen
LNG terminal updates are UNPREDICTABLE - monitor hourly for changes
Production data releases DRIVE SPIKES - be cautious around EIA reports
Trading Timeframe Recommendations ⏰
Scalpers: 5-15 minute charts (quick entries/exits)
Day Traders: 15-60 minute charts (intraday momentum)
Swing Traders: 4H-Daily charts (position holds 2-5 days)
Position Traders: Weekly charts (longer-term thesis)
📊 MARKET SENTIMENT & TECHNICALS
Overall Bias: 🟢 BULLISH (Short-term strength | Caution on extremes)
✅ Trend: Strong uptrend continuing
✅ Momentum: Bullish momentum confirmed
⚠️ Overbought: RSI entering extreme levels
⚠️ Volatility: Historic elevation = risk factor
⚠️ Trap Potential: Institutional profit-taking likely at $5.900+
🎓 FINAL THOUGHTS
This is a TECHNICAL + FUNDAMENTAL TRADE blending real economic data with proven price action patterns. The historic winter storm provides legitimate fundamental support, but markets overshoot in both directions.
Your Success Depends On:
Your own technical & fundamental analysis
Proper risk management execution
Emotional discipline during volatile moves
Adherence to YOUR personal trading plan
Continuous market monitoring & adaptability
Remember: Profits come from execution of YOUR strategy, not following someone else's targets blindly.
TRADE SMART 🧠 | TRADE SAFE 🛡️ | TRADE YOUR OWN PLAN 📋
Analysis Date: January 26, 2026 | Real-Time Market Data Verified ✅
👍 If This Analysis Helped You:
FOLLOW for daily market insights
COMMENT with your trade setup & ideas
SHARE with your trading community
Let's build profitable trading decisions together! 🚀💰

Fundamental Market Analysis for February 6, 2026 EURUSDEURUSD:
EUR/USD is hovering around 1.17900 on Friday, February 6, 2026, after the U.S. dollar strengthened notably. Investor caution has increased amid softer equities and higher uncertainty, which supports demand for the U.S. currency.
The Eurozone central bank kept rates unchanged and indicated it remains focused on keeping inflation stable around its target over the medium term. At the same time, January inflation data in the region showed a slowdown to 1.7% year over year, prompting markets to discuss easier financing conditions more actively—an additional headwind for the euro.
Rate expectations still depend heavily on the labor market in the world’s largest economy: some indicators point to cooling, but the key employment report can quickly shift sentiment. If the data proves resilient, the case for keeping rates high strengthens, and EUR/USD may drift lower.
Trading recommendation: SELL 1.17900, SL 1.18200, TP 1.17000

Qatar vs Future Natural GasAll the issues surrounding The Middle East can be explained by the price of gas.
This pattern will finally end and will close the price to rest at about a third of a dollar.
But then I dont envision a situation wherein rich customers find the price attractive to return to trade table for this commodity unless the cost of extracting & processing and transfer would have declined too.

Natural GASFrom NURAL GAS price is in the supply zone 3.8256 point and it can start to decrees to 3.0624 point, but above this point the top side target is 4.6148 level.

Natural gas 50% rally eyes $5.25! Arctic blast, Trump $83b shiftWhile everyone is focused on gold hitting $5,100 and silver approaching $110, natural gas has staged one of the most vertical rallies we've seen in years, surging nearly 50% from the mid-January low of $2.65 to near $4.00 in just 10 days. Is this the start of a sustained bull market?
We analyse the powerful combination of weather-driven demand and structural policy shifts driving natural gas prices higher. We break down the technical setup across multiple timeframes, identifying key resistance zones and two potential scenarios for the next move.
Key topics :
Dual fundamental catalysts :
Arctic blast : The polar vortex hit the US harder than forecasted, spiking heating demand and freezing production in key basins.
Trump's $83 billion shift : The administration cancelled green energy loans and redirected funds specifically to Natural Gas and Nuclear infrastructure, adding a structural tailwind to long-term demand.
Daily analysis :
Golden Cross confirmation : Price broke above the 200MA and is now testing the 50MA, confirming the bullish cross from November.
50% Fibonacci resistance : Currently testing the $3.95 level (50% retracement from $5.24 to $2.65) with RSI at 60—room for another 10 points of upside momentum.
Cluster resistance : The confluence of the 50MA and 50% Fib creates strong resistance, but a break could turn this into powerful support.
4-hour chart :
Scenario 1 (Cup & Handle complete) : If the pattern is finished at the 23.6% Fib, the measured move targets $4.70 (78.6% extension).
Scenario 2 (Double Top at $4.00) : RSI divergence suggests resistance could hold. A pullback to $3.45-$3.65 would form the handle, with the neckline projection targeting $5.25. Trade setup
Entry : Current levels or on pullback to $3.45-$3.65.
Stop Loss : Below the 61.8% Fibonacci (unlikely to break if this is a true impulse).
Target : $5.25 (previous December 2025 peak), with potential extension if $4.25 breaks decisively.
Risk Management : Secure partial profits along the way and trail stops to protect gains.
Are you buying the dip or waiting for confirmation above $4? Let us know in the comments!
This content is not directed to residents of the EU or UK. Any opinions, news, research, analyses, prices or other information contained on this website is provided as general market commentary and does not constitute investment advice. ThinkMarkets will not accept liability for any loss or damage including, without limitation, to any loss of profit which may arise directly or indirectly from use of or reliance on such information.

$NATGAS - Ready for Winter Storms ahead ?PEPPERSTONE:NATGAS
January/2026
Weekly Chart
- East Coast and North-East of United States are about to face a harsh winter ahead
Short-Term Strong Bullish Momentum Fundamentally driven for PEPPERSTONE:NATGAS
High Probability Set-up
Semi-Correction is expected as a Bullish pull-back and profit taking ,
leaving so, some breathing room for new participants to jump on-board,
as well decreasing the risk-reward ratio if not yet entered.
www.youtube.com
TRADE SAFE
*** NOTE THAT THIS IS NOT FINANCIAL ADVICE !
PLEASE DO YOUR OWN RESEARCH BEFORE PARTAKING ON ANY TRADING ACTIVITY BASED SOLY UPON THIS IDEA

Natural Gas Market at a decision pointOur last trade on this pair
Price pulled back after a strong move and is now sitting in an area where buying showed up before.
Selling has slowed down, and price is no longer pushing lower with strength.
If this area holds, price has room to work higher toward the next upside zone.
If it fails, downside pressure stays in play.

Natural Gas Prices Surge as Cold Weather ApproachesNatural Gas Prices Surge as Cold Weather Approaches
According to AccuWeather, a powerful Arctic cold front is expected to sweep across the United States, reaching as far south as the southern states and bringing lower temperatures to more than 150 million people across 24 states.
On Thursday, Texas Governor Abbott declared a state of emergency in more than half of the state’s counties ahead of the cold snap. It is worth noting that Texas is home to key natural gas production facilities, while its infrastructure is less adapted to prolonged cold weather.
As a result, market sentiment is being shaped both by expectations of higher natural gas demand for heating and by the risk of technical disruptions to production.
Consequently, the XNG/USD chart shows a sharp rise in natural gas prices, with the move from last week’s low to the recent high amounting to nearly 40%.
Technical Analysis of the XNG/USD Chart
When analysing gas prices on 15 January, we identified a long-term descending channel, highlighted in red on the chart. At that time, we also:
→ noted that prices were hovering near the 2025 low;
→ suggested that bears might attempt to break below the 2025 low, which could have a psychological impact on the market, prompting short sellers to take profits and encouraging renewed buying interest.
Indeed, following a false bearish break of the 2025 low (as indicated by the arrow), prices surged sharply towards the median of the channel, an area where supply and demand often tend to balance.
Moreover, around the 3.330 level, there was a clear period of imbalance in favour of buyers. Bulls broke through the descending trendline resistance, and XNG/USD rose with minimal pullbacks.
From a technical perspective, it is therefore possible that this area may now act as support. However, the actual path of the natural gas market will largely depend on the severity of the cold weather and its impact on conditions across the country.
This article represents the opinion of the Companies operating under the FXOpen brand only. It is not to be construed as an offer, solicitation, or recommendation with respect to products and services provided by the Companies operating under the FXOpen brand, nor is it to be considered financial advice.

NATGAS Tapped ResistanceNATGAS has been climbing strongly driven by fundamentals, just tapped a key resistance and here we can expect a short term bounce.
The next step is to watch how price behaves at this zone.

Natural Gas - Supply Fears? Natural Gas had one of the largest moves i have ever seen in one day.
Fear has spread into the nat gas market on supply fears since tensions have been rising around NATO / USA / EU....
With tarrifs being threatened one area that the EU remains vulnerable is their energy consumption.
We closed our AMEX:UNG calls today for over 900% locking in extraordinary gains...
We sold our AMEX:BOIL for 31% gain...
Nat Gas equities remain interesting and still a buy if this price holds / consolidates.

NATGAS - BULLISH MOVE!
Hello traders,
on Wednesday, 14 Jan, Natural Gas reached the support level (2.7365 – 2.8419).
The price has broken the recent lower high, signaling a change of character.
Based on this shift in structure, I expect a bullish move.
🎯 TARGET: 3.8800

Natural Gas – Trend Shift in Progress?After being bearish bearish for a while, Natural Gas has broken out of the descending red trendline, signaling a clear shift in momentum from bearish to bullish.
What stands out here is how price reacted after the breakout. Instead of selling off again, it held above the recent support zone and started building higher structure.
As long as this new bullish structure holds, the bias remains to the upside, with room for continuation toward higher levels. Any pullbacks that stay above support are, for me, opportunities to watch.
⚠️ Disclaimer: This is not financial advice. Always do your own research and manage risk properly.
📚 Stick to your trading plan regarding entries, risk, and management.
Good luck! 🍀
All Strategies Are Good; If Managed Properly!
~Richard Nasr

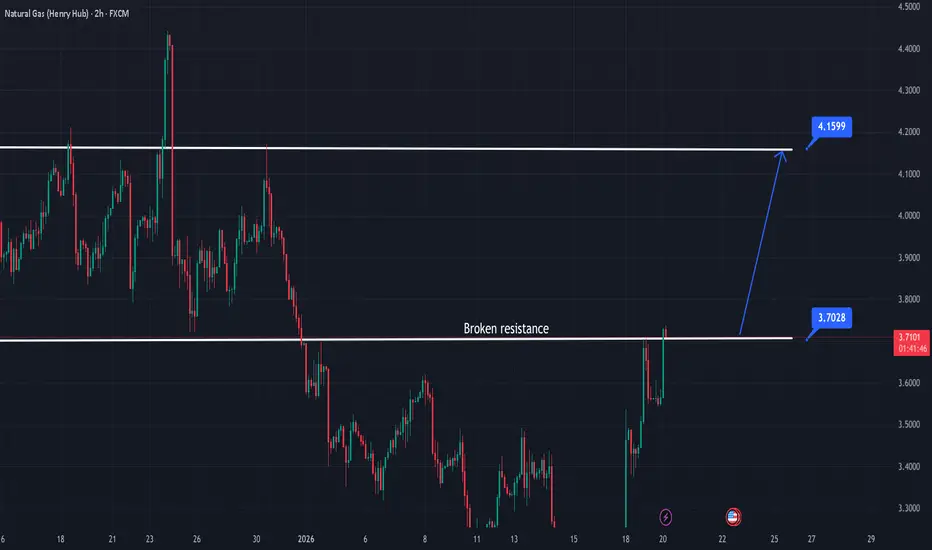
Natural Gas Ready to ExtendOld resistance is now being tested as support.
If it holds, price can push toward 4.15.
The 2026 Gas Crisis: Texas Freezes and Europe Runs Dry
Going long on March Natural Gas futures at 2.95.
1) Weather Current models (ECMWF and GFS) show the formation of a blocking anticyclone. This is not just a short-term frost, but a prolonged cold that will linger in key consumption regions (Midwest, Northeast) at least until February 5–8.
2) Production Current models show the formation of a blocking anticyclone. This is not just a short-term frost, but a prolonged cold that will linger in key consumption regions at least until February 5–8. If the frost lasts for another 48–72 hours (as confirmed by the AO index), production could fall to 105 Bcf/d. Every lost unit (Bcf) under conditions of record demand is a direct driver of growth.
3) Export Corpus Christi (Train 5): Commissioning work began on the 5th line on January 14. This adds a constant demand of ~0.7 Bcf/d to the system (with potential up to 1.5 Bcf/d at full load). Exports will reach record levels in March.
4) Current Status of European UGS (Underground Gas Storage) Fill level: EU average is ~50.4% – 52% (according to GIE AGSI data). For comparison: at the same time in 2025, the level was above 65%. Due to prolonged cold weather and periods of low wind (Dunkelflaute), storage withdrawals in January are proceeding at rates 1.5–2 times higher than the norm. If Europe ends the winter with 20-25% in UGS, it will have to inject 35–40 billion m³ more gas in the summer than last year. This will create massive demand as early as March-April.
Blocking anticyclones (High-pressure blocking) over Greenland and Scandinavia look stable. This means that the cold pattern in Europe will last at least until February 5–10.
A negative AO "locks" heat over the Atlantic and "pushes" Arctic air masses onto the European continent. This leads to temperature anomalies 5–8°C below normal in Germany, France, and the Benelux countries.
The second cold wave (February) may turn out to be drier and frostier, which is critical for wind generation (Dunkelflaute), forcing power engineers to burn more gas.
We are moving along the lower bound of the historical range. At the current withdrawal rate (~607 million cubic meters per day), Europe risks reaching the 30% level as early as mid-February, which is a month earlier than usual. If current withdrawal rates persist, Europe will reach the 22-24% level by March 31 with a probability of 51%.
SUMMARY European UGS (Germany, France) have dropped to ~42%, the lowest figure in 5 years, and withdrawals are occurring at double speed. Total US demand (January 20–21) hit a historical high of 184 Bcf/d. With current production at 107 Bcf/d, the gap is being covered by massive withdrawals from UGS. The surplus of +106 Bcf (relative to the 5-year norm) that existed on Friday will be completely liquidated by the end of this week. The market is shifting from a state of "surplus" to a state of "massive deficit."
March is currently pricing in the risks that gas might not be sufficient for normal UGS filling in the summer of 2026.

NATURAL GAS Epic Short Squeeze? Natural gas on Friday closed near the lows of the session but hitting extreme support.
Over the weekend news hit the tape about colder weather reports and increased snow.
This has sent Nat gas roaring up over double digits.
In our group we swung UNG 10.50 calls which should be up over 1000%
There is a strong thesis that this week the shorts will be caught off guard and forced to cover which could add more fuel to the fire.
The inventory report on Thursday will be interesting to see and price may stay firm into the report.
