Last Chance to Grab AARTI INDUSTRIES @ 370.00 Rs once again reminder its pure Chhota Packet Bada dhamaka Stock.
CMP 370.00 RS
NO stoploss
upper Target up to 1150.00 RS within 2 years
AARTI Industries Ltd
No trades
Market insights


Aarti Industries pure invest call , CMP 382
No stoploss
Target 730- 1050 than 1150
Next bull run Chemical Sector k Name.

Aarti Industries basing and looking for a pre-earnings runupShowing good accumulation with key averages being crossed.

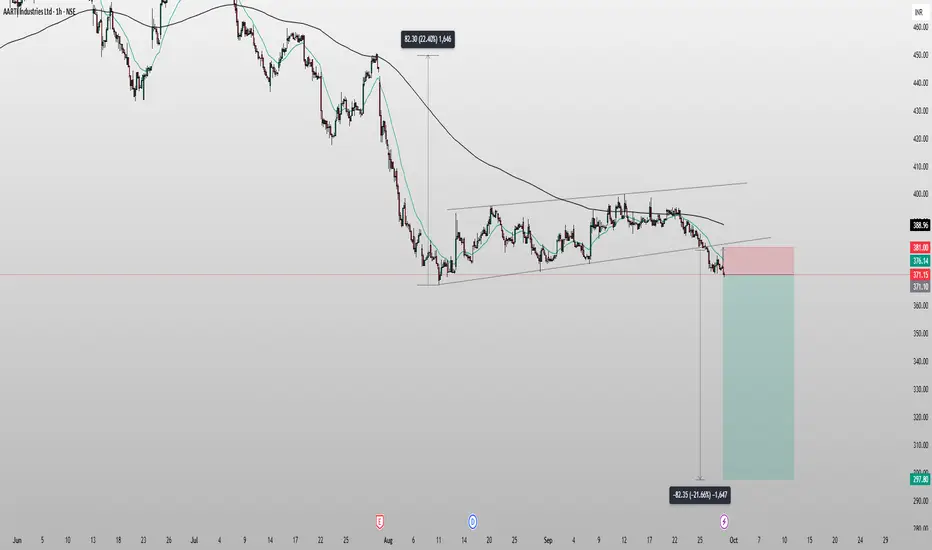
INVERTED FLAG AND POLE - AARTI INDUSTRIESAfter a prolonged consolidation, the price has broken below the support trendline, confirming a bearish breakdown. The structure is showing weakness with lower highs and consistent selling pressure.
Entry: Around 376
Stop Loss (SL): 381
Target: 297
Risk-Reward Ratio (RR): ~3.5
The breakdown is backed by volume and trendline rejection, suggesting further downside potential if momentum continues.
⚠️ Disclaimer: I am not SEBI registered. This analysis is shared for educational purposes only. Please consult your financial advisor before making any investment decisions.
Buy AARTI INDUSTRIES 14/9/25
Buy Price : 387.10
SL : 367.50
Target 1 : 406.70
Target 2 : 426.35
Target 3 : 446

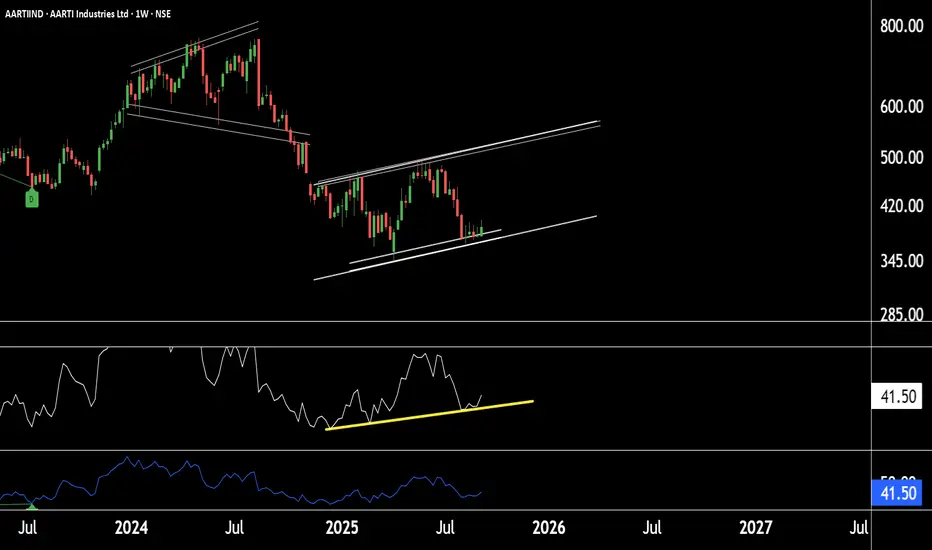
Aarti Industries at Solid Base – Potential Upside Loading!!Aarti Industries – Weekly Chart Update
Chart Pattern: Stock is trading within a shorter-timeframe parallel channel.
Support Zone: Strong support observed near ₹370 – ₹380 levels.
RSI Indicator: RSI is also taking support and moving upward, indicating positive momentum.
Trend Outlook: If this support zone sustains, the stock is likely to move into an uptrend.
Price Projection: Potential for higher levels at 500-521 in Aarti Industries.
Thank you!
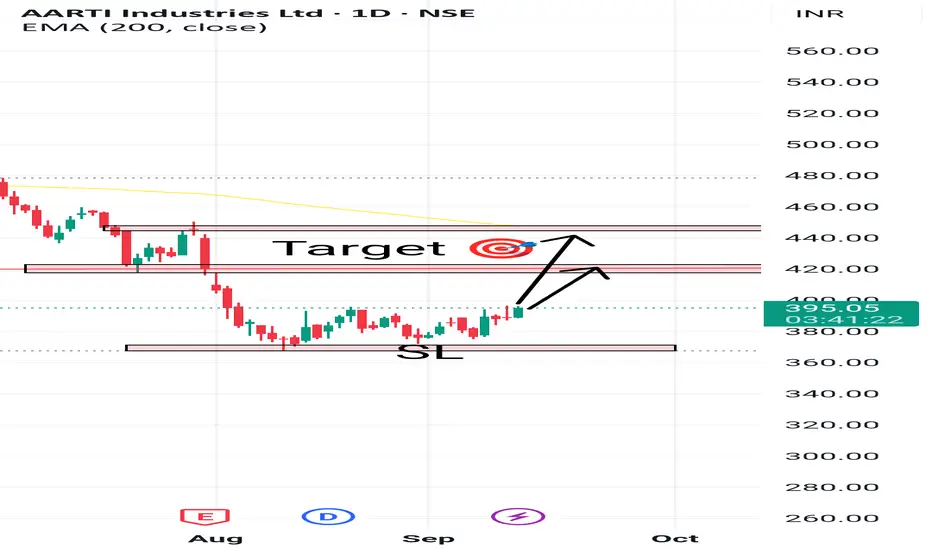
AARTI INDUSTRIES Price at lower end and support also there. So possible that it will move upper side
SL and target 🎯 marked on chart 📈📉
This idea is for Educational purpose and paper trading only. Please consult your financial advisor before investing or making any position. Facts or Data given above may be slightly incorrect. We are not SEBI registered
AARTIIND | Buy above 395 | Strict SL below 370 |Targets 480, 590Disclaimer:
This is not financial advice. Please do your own research or consult with a financial advisor before making any investment decisions. Investments in stocks can be risky and may result in loss of capital.

AARTIIND- Very High RiskPlease follow levels provided on chart.
Please calculate possible losses before entering any suggestion.
AARTIIND | Buy above 460 | Strict SL below 415 | Target 640, 760Disclaimer:
This is not financial advice. Please do your own research or consult with a financial advisor before making any investment decisions. Investments in stocks can be risky and may result in loss of capital.

Aarti Industries: Attempting a Reversal🔄 Aarti Industries: Attempting a Reversal 🔄
📉 CMP: ₹470
🔒 Stop Loss: ₹428
🎯 Targets: ₹554 | ₹604
📊 Technical Setup:
✅ Rounding Bottom Breakout confirmed
✅ Retest completed, providing a low-risk entry zone
✅ Strong base formed after prolonged downtrend
This setup offers a good swing trading opportunity as we preempt a potential reversal.
⚠️ Note: Since this is a reversal attempt, position sizing and stop loss discipline are critical in case the move fails.
📉 Disclaimer: Not SEBI-registered. Please do your own research or consult a financial advisor before investing.
#AartiIndustries #ReversalTrade #TechnicalBreakout #SwingTrading #StockMarketIndia #FibonacciLevels #ChemicalSector

What a beautiful Wave!AARTIIND is showing a potential short-term bullish reversal after a prolonged decline, supported by RSI momentum, moving average crossover, and rising volume. A breakout above ₹486 could give a further rally toward ₹490+ Bullish Bias (If price sustains above ₹454):
Target: ₹486 → ₹492
The push will take place once the price moves above the 50 SMA - ₹474. Two cross overs have been executed. The third should bring smiles. Unless external forces act otherwise this should be an interesting trade. The rising volume speaks volumes.

AARTIIND | Buy @LTP | SL below 340 | 1st Target 566, 2nd 765Disclaimer:
This is not financial advice. Please do your own research or consult with a financial advisor before making any investment decisions. Investments in stocks can be risky and may result in loss of capital.

Aarti Industries BreakoutGood Consolidation Breakout on Weekly TimeFrame.
Breakout has come with Volumes.
Short Term Target 480

AARTIIND | Buy If Weekly RSI close above 45 | SL below 345Disclaimer:
This is not financial advice. Please do your own research or consult with a financial advisor before making any investment decisions. Investments in stocks can be risky and may result in loss of capital.

AARTI INDUSTRIES : Potential Bounce From Long Term Support!!🚀 Aarti Industries: Potential Bounce from Long-Term Support! 🚀
📍 CMP: ₹466
📉 Stop Loss: ₹385
🎯 Target: ₹530 | ₹660
🔹 Key Insights:
✅ Fibonacci Support at 61.8% on the long-term chart.
✅ Sector Strength: Specialty chemicals & CDMO sector showing positive momentum.
✅ Strategy: Staggered entry to manage risk in a volatile market.
✅ Long-Term Swing Trade: Positioning for monthly gains.
⚠️ Risk Management: Stop loss is big—strict discipline is key!
📉 Disclaimer: As a non-SEBI registered analyst, I recommend conducting thorough research or seeking advice from financial professionals before making investment decisions.
#AartiIndustries #TechnicalAnalysis #SwingTrading #InvestmentOpportunities #FibonacciSupport #SpecialtyChemicals


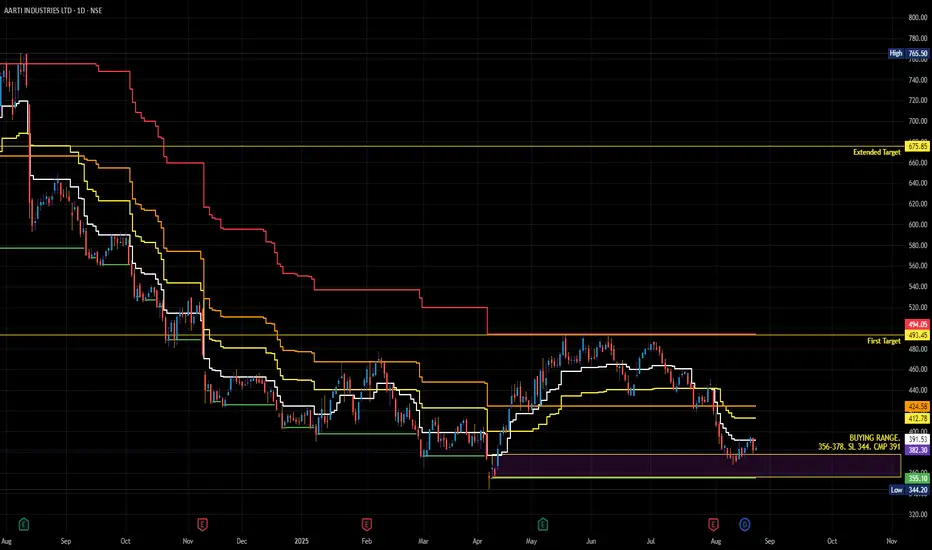
Key Support / Resistance Breakout - Swing TradeDisclaimer: I am not a Sebi registered adviser.
This Idea is publish purely for educational purpose only before investing in any stocks please take advise from your financial adviser.
Key Support & Resistance Breakout. Stock has give Breakout of Resistance level. Keep in watch list. Buy above the high. Suitable for Swing Trade. Stop loss & Target Shown on Chart.
Be Discipline because discipline is the Key to Success in the STOCK Market.
Trade What you see not what you Think.

AARTIIND : Going long for about 1.875% of the net capitalI have taken 3 positions at various levels, bringing my total holding in the scrip to 1.875% of my net capital. I may consider adding to the position if the price falls to the low of the descending channel marked on the chart. However, both macro and microeconomic factors, as well as the momentum of the decline, will be carefully evaluated before making any additional entry. If that position is taken, the net allocation in the scrip will increase to approximately 2.5%, which will be the final position in this scrip.
For now, my targeted move is approximately 49% of the invested capital based on the current average price.
📢📢📢
If my perspective changes or if I gather additional fundamental data that influences my views, I will provide updates accordingly.
Thank you for following along with this journey, and I remain committed to sharing insights and updates as my trading strategy evolves. As always, please feel free to reach out with any questions or comments.
Other posts related to this particular position and scrip, if any, will be attached underneath. Do check those out too.
Disclaimer: The analysis shared here is for informational purposes only and should not be considered as financial advice. Trading in all markets carries inherent risks, and past performance is not indicative of future results. It’s essential to conduct your own research and assess your risk tolerance before making any investment decisions. The views expressed in this analysis are solely mine. It’s important to note that I am not a SEBI registered analyst, so the analysis provided does not constitute formal investment advice under SEBI regulations.

AArti Industries 8 ka weekly funda 100>200AArti Industries 8 ka weekly funda 100>200
1) Super Bearish Pattern at good sale
2) Just broken the All time trendline
3) Let see, Patience needed
@saurav0991

Buy around 350 400. Tgt 1200 plusMay buy around 300 se 400. 3 year horizon 1000 plus as per technical charts. No more retracement downside possible. Stop-loss 300

CHART PATTERN HAS SOMETHING TO SAYAARTI INDUSTRIES:
It appears that Aarti Industries is currently establishing a support level within its present price range, which is likely to hold until it reaches 386. This observation suggests that something positive might be anticipated, possibly due to favorable results or the interest of savvy investors, as accumulation seems to be taking place according to the chart.
Please note, this is not intended as a buy or sell recommendation; it’s important to consult with your financial adviser for tailored advice.
Regards
Happy new year.
