ASTERDM - Ascending Triangle Breakout Breakout from Ascending Triangle in Aster DM Healthcare
NSE:ASTERDM
📈Pattern & Setup:
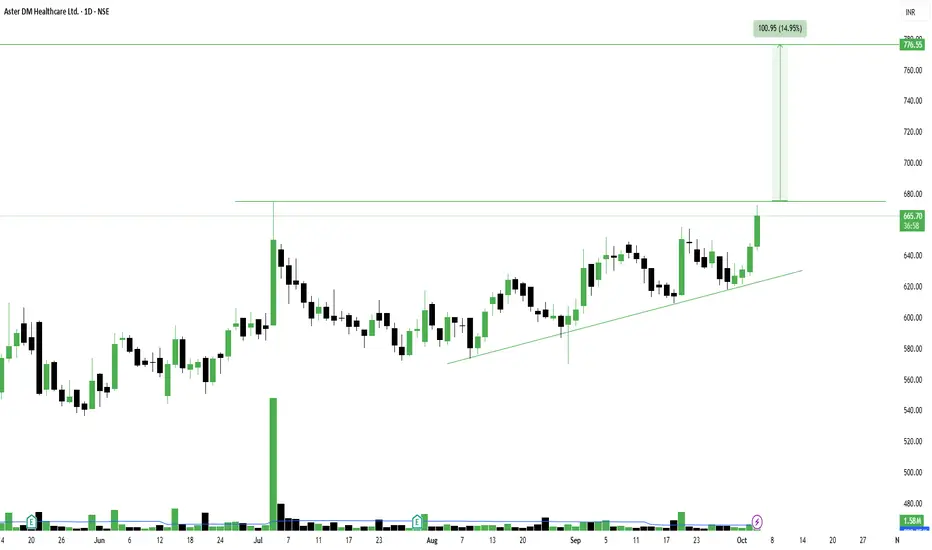
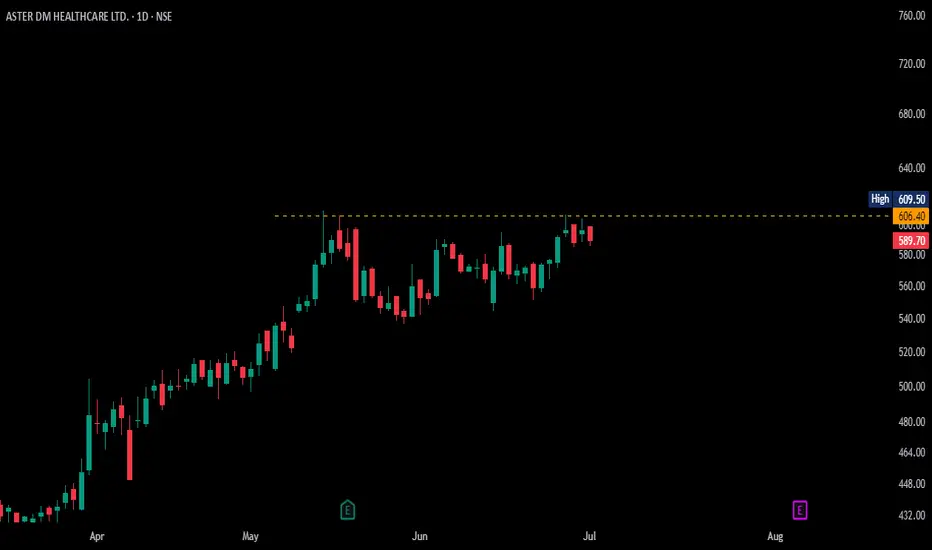
Aster DM Healthcare has given a breakout from an ascending triangle pattern on the daily chart — a strong continuation structure that signals renewed buying interest. The stock has been consolidating tightly between 630–670 zones for several weeks, forming higher lows that highlight bullish pressure building up near resistance.
The breakout candle above 660 is backed by solid volume, confirming strong buyer participation and momentum entry.
📝 Trade Plan:
Entry: Current levels around 665–670 look good for early entry.
🚩Stop-Loss: 635 (below the ascending trendline and recent swing low).
🎯Targets:
Target 1 → 720 (minor resistance zone).
Target 2 → 775 (measured move target, 15% upside).
💡Pyramiding Strategy:
1. Enter first lot around 665–670.
2. Add above 690 if the breakout sustains with volume, trail SL to 650.
3. Add final lot above 720, trail SL to 680.
Ride the trend until it approaches the 770–780 zone.
🧠Logic Behind Selecting this Trade:
The setup is a clean ascending triangle breakout — a classic bullish pattern showing higher lows against a flat resistance. Volume expansion on the breakout day confirms strength, while price structure indicates trend continuation after a healthy consolidation phase. If the stock holds above 660, it can easily push towards 775 in the short term.
Keep Learning. Keep Earning.
Let's grow together 📚🎯
🔴Disclaimer:
This is not an investment advice. Always do your own due diligence before making any trading or investment decision.
Trade ideas
Aster DM Healthcare Limited. (ASTERDM)Friends, this is a time cycle chart showing the maximum highs and lows formed on the cycle date. Candles are formed, and you'll see the cycle complete right here.
Aster DM Healthcare Limited is one of the largest integrated private healthcare service providers operating in GCC (Gulf Cooperation Council) countries and an emerging player in India. With an inherent emphasis on clinical excellence, it is one of the few entities in the world with a strong presence across primary, secondary, tertiary and Quaternary healthcare.

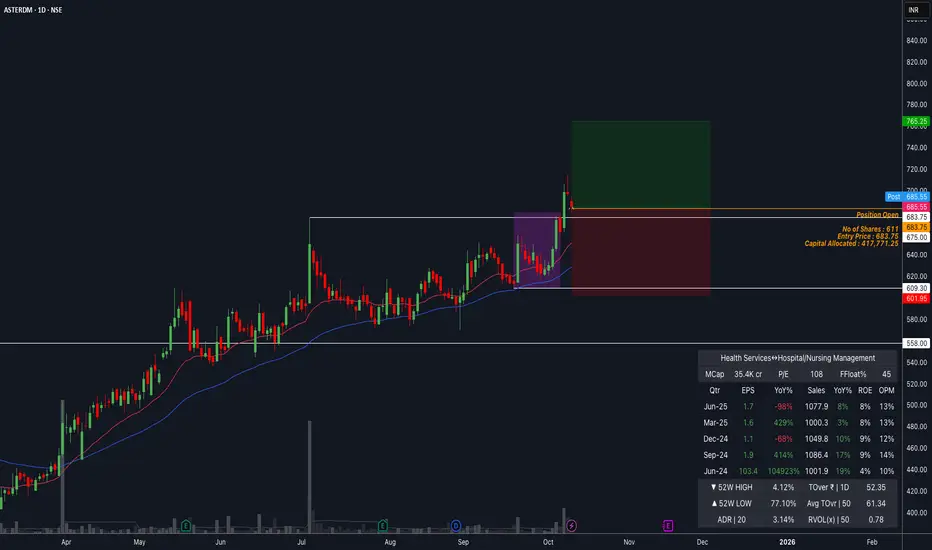
ASTERDM : Breakout Backed by Strong FundamentalsTook a position in Aster DM Healthcare with a 1% risk of the net capital, after spotting a clean VCP (Volatility Contraction Pattern) formation on the daily chart.
The breakout came with solid volume and clear price structure, aligning perfectly with the improving fundamentals and the recent ICRA rating upgrade. Overall market is also showing bullishness.
Technical Snapshot:
Multiple contractions forming a tight base before breakout.
Price breakout above prior resistance with momentum.
Volume expansion confirming institutional participation.
Price holding above all key EMAs, showing trend strength.
Fundamental Tailwinds:
ICRA upgraded ratings to A+ / A1+, citing robust financial profile and expanding operations.
Revenue up 11.9% YoY in FY25; EBITDA margins improved to 19.5% in FY25 and 20% in Q1 FY26.
Upcoming merger with Quality Care India Ltd (QCIL) will create one of India’s top three hospital chains.
Plans to add 2,600 beds across brownfield and greenfield projects.
📢📢📢
If my perspective changes or if I gather additional fundamental data that influences my views, I will provide updates accordingly.
Thank you for following along with this journey, and I remain committed to sharing insights and updates as my trading strategy evolves. As always, please feel free to reach out with any questions or comments.
Other posts related to this particular position and scrip, if any, will be attached underneath. Do check those out too.
Disclaimer : The analysis shared here is for informational purposes only and should not be considered as financial advice. Trading in all markets carries inherent risks, and past performance is not indicative of future results. It’s essential to conduct your own research and assess your risk tolerance before making any investment decisions. The views expressed in this analysis are solely mine. It’s important to note that I am not a SEBI registered analyst, so the analysis provided does not constitute formal investment advice under SEBI regulations.
Aster DM Healthcare 🚀 Aster DM Healthcare – Breakout Swing! 🔥
💰 Deploy: ₹20K
📌 Buy: ₹649
⚡ Breakout: ₹649
🛑 SL: ₹570
🎯 TG: ₹864 / ₹921
⚡ Strong healthcare play + breakout momentum = 🚀 High-upside swing!
RT if you’re catching this move early 📈
#StocksInFocus #StocksToBuy #StocksToTrade #BreakoutStocks #SwingTrading #StockMarketIndia #HealthcareStocks

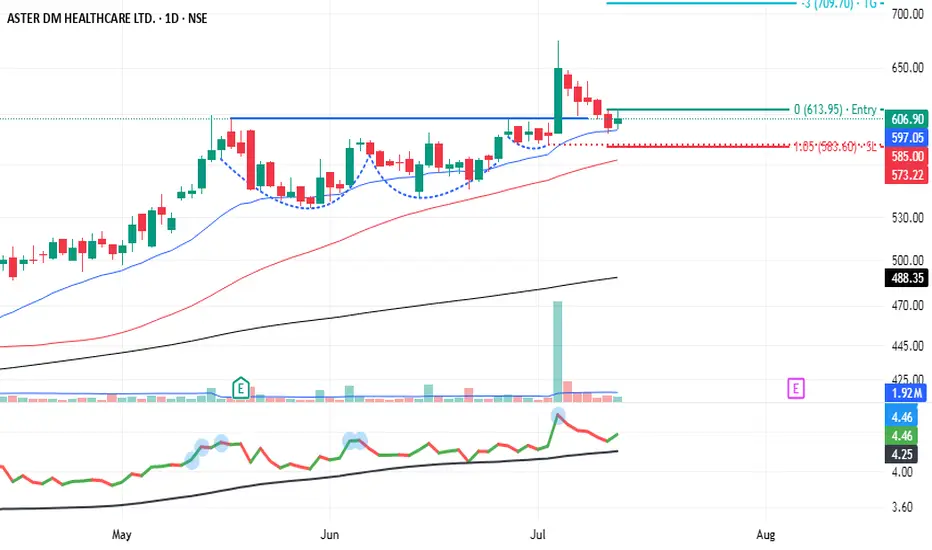
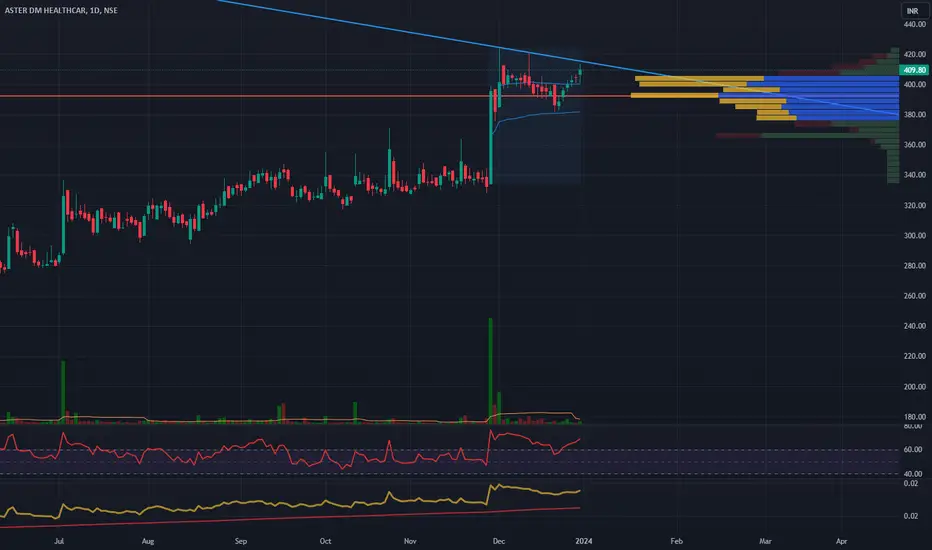
ASTERDM - classic VCP retest - My Pick - No AdviceASTERDM exhibited 3 shrinking pullbacks on its daily with increasingly narrow ranges and diminishing volume followed by a strong upside break. Post-breakout, the ideal setup is a retest: price pulls back to the breakout level (pivot), holding above it.
Fundamentally, Aster DM is a solid healthcare growth story: strong expansion, low debt, cash-rich, with robust ROCE/ROE. But valuation is rich, and earnings are skewed by non-core income.
Technically, VCP setup looks promising—good base, breakout, and retest in place.
ASTERDM Ready to BOASTERDM after touching resistance, the current volume feature shows it is ready to Break Out
Set up : Trendline breakout No need to address more things here; looks simple chart and draw simple trendline,
Market trying to sustain abv level.


50 SMA Rising- Positional TradeDisclaimer: I am not a Sebi registered adviser.
This Idea is publish purely for educational purpose only before investing in any stocks please take advise from your financial adviser.
Its 50 SMA Rising Strategy. Suitable for Positional Trading Initial Stop loss lowest of last 2 candles and keep trailing with 50 days SMA if price close below 50 SMA then Exit or be in the trade some time trade can go for several months.
Be Discipline because discipline is the Key to Success in the STOCK Market.
Trade What you see not what you Think

ASTERDM Ready for All Time High...NSE:ASTERDM trade at 405. You can watch for after brekout at 500-550 level.

50 SMA Rising- Positional TradeDisclaimer: I am not a Sebi registered adviser.
This Idea is publish purely for educational purpose only before investing in any stocks please take advise from your financial adviser.
Its 50 SMA Rising Strategy. Suitable for Positional Trading Initial Stop loss lowest of last 2 candles and keep trailing with 50 days SMA if price close below 50 SMA then Exit or be in the trade some time trade can go for several months.
Be Discipline because discipline is the Key to Success in the STOCK Market.
Trade What you see not what you Think

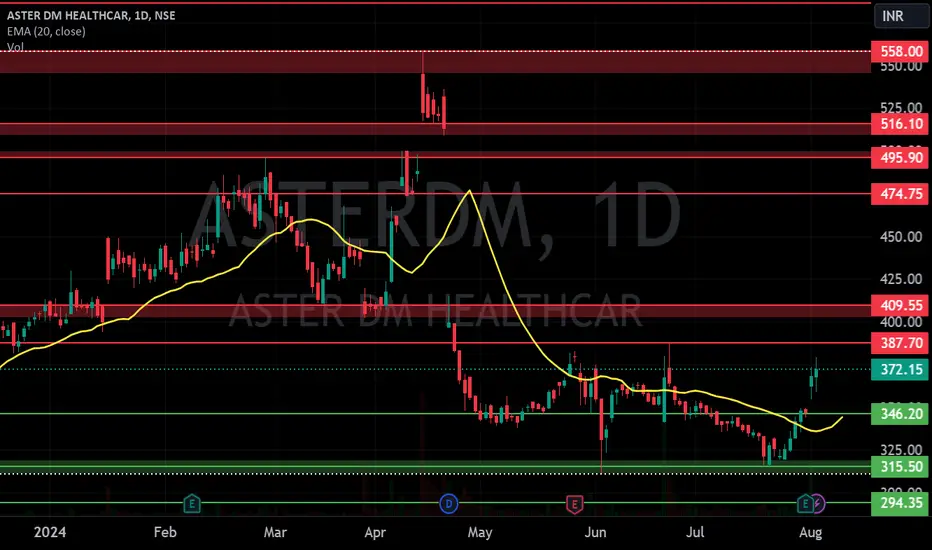
ASTER DM HEALTHCARE S/RSupport and Resistance Levels: In technical analysis, support and resistance levels are significant price levels where buying or selling interest tends to be strong. They are identified based on previous price levels where the price has shown a tendency to reverse or find support.
Support levels are represented by the green line and green shade, indicating areas where buying interest may emerge to prevent further price decline.
Resistance levels are represented by the red line and red shade, indicating areas where selling pressure may arise to prevent further price increases. Traders often consider these levels as potential buying or selling opportunities.
Breakouts: Breakouts occur when the price convincingly moves above a resistance level (red shade) or below a support level (green shade). A bullish breakout above resistance suggests the potential for further price increases, while a bearish breakout below support suggests the potential for further price declines. Traders pay attention to these breakout signals as they may indicate the start of a new trend or significant price movement.
20 EMA: The yellow line denotes 20 EMA, to interpret the 20 EMA, you need to compare it with the prevailing stock price. If the stock price is below the 20 EMA, it signals a possible downtrend. But if the stock price is above the 20 EMA, it signals a possible uptrend.
Disclosure: I am not SEBI registered. The information provided here is for learning purposes only and should not be interpreted as financial advice. It is important to consult with a qualified financial advisor before making any investment decisions. Tweets neither advice nor endorsement.
ASTERDM NSE:ASTERDM
Reversal from lower level.
News
Malabar Institute of Medical Sciences, a subsidiary of Aster DM Healthcare
ASTERDM
, has agreed to acquire an additional 25% stake in Usolar Assetco Two from U-solar Clean Energy Solutions for 78.8 million Indian rupees.
With this, the company's shareholding in Usolar will increase to 51.05%, according to a Friday filing to the stock exchanges.
Under the agreement, USOLAR has agreed to build, operate, manage, and maintain a 10 MWp captive solar power plant at the Malabar Institute's site in Kerala, India.
The transaction is expected to close by Aug. 30.

Aster DM looks good for 370Looks a trend reversal to upside
Crossing 10ema
But after an upmove retest to botom may possible
Need a good volume for an upmove
Health sector is positive.
370 target stop at 340
Risk 10rs reward 30rs+
Cmp352
Aster DM Healthcare Limited is one of the integrated private healthcare service and emerging player in India. With an inherent emphasis on clinical excellence, it is one of the few entities in the world with a strong presence across primary, secondary, tertiary and quaternary healthcare.

#ASTERDM new positionqty 280
entry 350
SL 41.20
target not defined
took big position at once in morning

Low risk opportunities with huge potential Start accumulating at rate and have tight stop 419
Follow risk management

ASTER DM HEALTHCAREBreakout and consolidation in an uptrend. The volume in consolidation is less. After breakout above the slanting trendline, the uptrend is likely to continue.
Aster DM Partial entryHave made a long position in Aster DM.
Took 40% qty of planned trade for this script.
Rest of the quantity will be added on breakout retest area.

ASTER DM HEALTHCARE LTD - Ascending Triangle Breakout📊 Script: ASTERDM (ASTER DM HEALTHCARE LIMITED)
📊 Nifty50 Stock: NO
📊 Sectoral Index: NIFTY 500 / NIFTY SMALLCAP / NIFTY PHARMA
📊 Sector: Healthcare
📊 Industry: Healthcare Services - Hospital
Key highlights: 💡⚡
📈 Script is trading at upper band of Bollinger Bands (BB) and giving breakout of it.
📈 MACD is giving crossover.
📈 Double Moving Averages also giving crossover.
📈 Volume is increasing along with price which is volume breakout.
📈 Script is giving breakout of Ascending Triangle.
📈 Current RSI is around 65.
📈 One can go for Swing Trade.
⏱️ C.M.P 📑💰- 265.55
🟢 Target 🎯🏆 - 304
⚠️ Stoploss ☠️🚫 - 247
⚠️ Important: Always maintain your Risk & Reward Ratio.
⚠️ Purely technical based pick.
✅Like and follow to never miss a new idea!✅
Disclaimer: I am not SEBI Registered Advisor. My posts are purely for training and educational purposes.
Eat🍜 Sleep😴 TradingView📈 Repeat🔁
Happy learning with trading. Cheers!🥂

📉 Alert! Bearish Pattern Spotted! 🐻📊 Pattern: Rising Wedge
📌 Symbol/Asset: Aster DM Healthcare
🔍 Description: Stock can touch lows of ~287 in the coming days
👉 Remember: Technical patterns are just one piece of the puzzle. Consider conducting further research, consulting with a financial advisor, and managing your risks appropriately.

Resistance breakoutPlease look into the chart for a detailed understanding.
Consider these for short-term & swing trades with 2% profit.
For BTST trades consider booking
target for 1% - 2%
For long-term trades look out for resistance drawn above closing.
Please consider these ideas for educational purpose

Aster DM Healthcare-Nice breakoutAster DM Healthcare-Nice breakout.
Capital to be deployed- 20k
Price -295
Stoploss-263
Targets-402
#aster #nifty50 #NiftyBank #investment #StockMarket #StocksToBuy

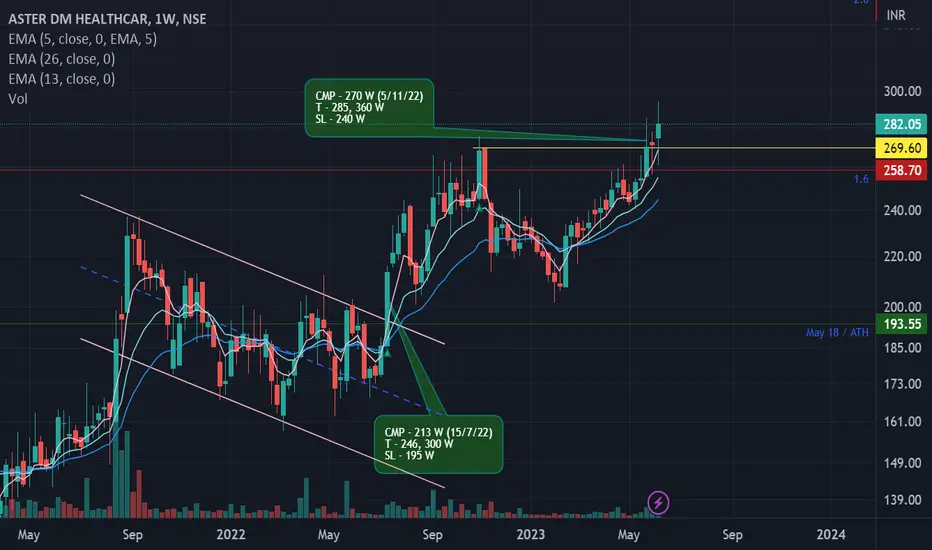
Investment pick!Aster DM came on my chart 2 weeks before, however, this week the breakout is confirmed. This is a MNC and have a very good management. Healthcare sector is in boom and the stock is currently trading in blue sky. Target and SL is amended as per todays weekly close.
CMP - 282 W (5/11/22)
T - 360 W
SL - 255 W