Continuation inverse head & shoulder chart pattern breakoutContinuation inverse head & shoulder chart pattern breakout above multiyear resistance indicating strong upmovement .
Nifty MidCap 100 Index
No trades
Related indices
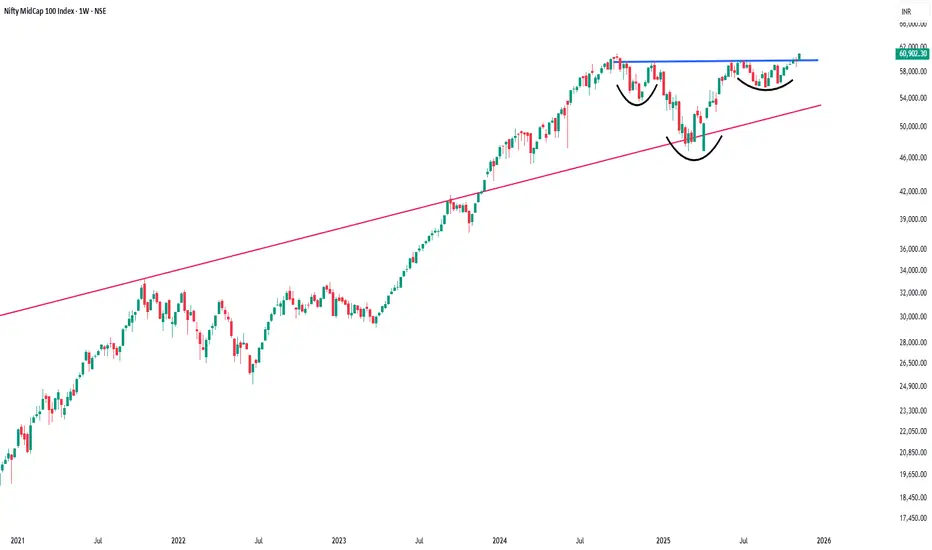
Midcap index. Has formed inverted head and shoulder.Fib . Target 69413 .think bottom has been formed in nifty too.


NIfty Midcap weekly time frameNifty Midcap showing Head & Shoulder's pattern on weekly time frame. NSE:CNXMIDCAP

Nifty Midcap Index getting ready NIFTY MIDCAP
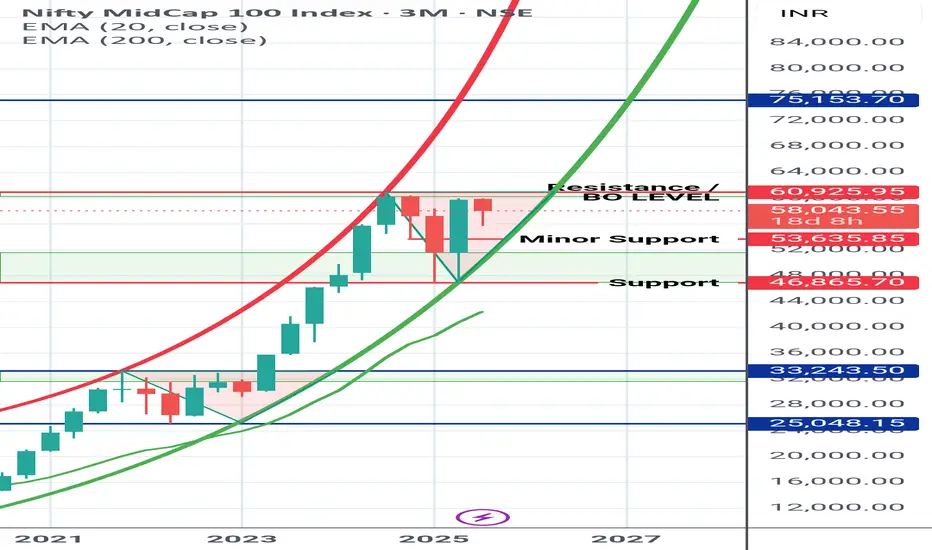
UPDATED MONTHLY TIME FRAME CHART
Any Dip is good buying opportunity for long.
Current Parabolic Support : 53635±
Major Support zone : 46900 - 52000
It is in Parabolic uptrend pattern.
Currently trading in Triangular zone. (Good for accumulation)
Based on the pattern, it is e
It is LET'S GO ALL IN time! 100 WEMA on midcap 100Deep red portfolios, bearish sentiments, uncertainity in geopolitics: Something similar to what happened in previous corrections (2022).
One can bet on smallcap, midcap companies near 100 WEMA - High Risk-Reward Trade

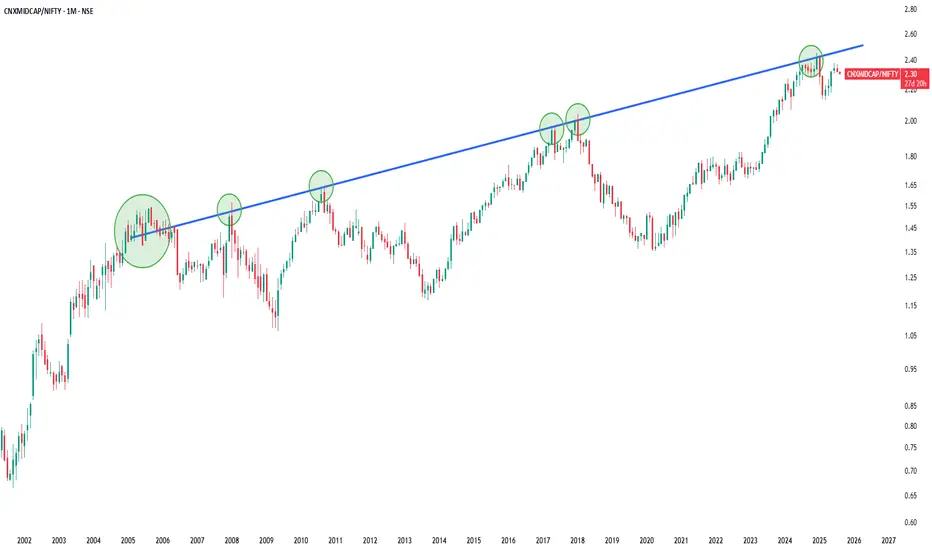
Ratio chart of Nifty Midcap/Nifty in Monthly Time FrameThis is Ratio chart of Nifty Midcap/Nifty in Monthly Time Frame . Indicates in bigger time frame Midcap Under perform Nifty50 .
5th wave pending in midcaps??In this long-term monthly chart, I’ve applied Elliott Wave Theory to map out a classic 5-wave impulse pattern in the Nifty Midcap 100 Index.
✅ Wave 1–2: Initial breakout and healthy correction post-COVID lows.
✅ Wave 3: Strong, extended uptrend—typically the most powerful wave.
✅ Wave 4: Complex si

MIDCAP SMA SUPPORTIndian markets are in severe sell off mode since last September 2024 and February 2025 is actually worse of them all...
Midcap Index as highlighted in chart is now on WEEKLY SMA SUPPORT. I believe we wil have good bounce of 10 to 15% in March & April.
Use this opportunity to avg good stock and use

Evaluating the Future of Midcaps: How Much Pain Is Left....?Midcap Correction: How Much More Pain is Left..?
The midcap sector has experienced a significant correction, currently down approximately 18% amid the broader market downturn. This raises an important question: how much more pain is left for midcaps?
Historical Context and Market Correction :
If

See all ideas
Summarizing what the indicators are suggesting.
Oscillators
Neutral
SellBuy
Strong sellStrong buy
Strong sellSellNeutralBuyStrong buy
Oscillators
Neutral
SellBuy
Strong sellStrong buy
Strong sellSellNeutralBuyStrong buy
Summary
Neutral
SellBuy
Strong sellStrong buy
Strong sellSellNeutralBuyStrong buy
Summary
Neutral
SellBuy
Strong sellStrong buy
Strong sellSellNeutralBuyStrong buy
Summary
Neutral
SellBuy
Strong sellStrong buy
Strong sellSellNeutralBuyStrong buy
Moving Averages
Neutral
SellBuy
Strong sellStrong buy
Strong sellSellNeutralBuyStrong buy
Moving Averages
Neutral
SellBuy
Strong sellStrong buy
Strong sellSellNeutralBuyStrong buy
Displays a symbol's value movements over previous years to identify recurring trends.