Small cap 100 Forming a Leading Diagonal Elliott wave structureNSE:CNXSMALLCAP
Sharing my Elliott wave analysis and work on Nifty small cap 100 index. Tried to best fit the labeling based on the rules and guidelines.
The index has formed an overlapping 3 wave structure called a Leading diagonal from the lows of 2004.
My conclusion now is that we are in the primary wave 5 degree with first up-leg complete in Jan 2022.
We can expect a minimum retracement of 23.6% for a target of 8812.75.
I look forward to know your views on the analysis, Feel free to share any alternate count or point out where I may be violating Elliot wave rules.
CNXSMALLCAP trade ideas

SMLCAP BIG DIP?blood bath is here, 1st point where we can see a reversal is close: a range of 8550 to 8600 is where I am placing a bet, this is not a very strong support but if we will see a reversal that should be from here onwards, other make a large BLOODY marry for me too Cheers :D

NIFTY SMALL CAP INDEXHello & welcome to this analysis on the small cap index
CNX Small Cap Index activated a Bullish Harmonic Deep Crab on 24th Feb at 9350. From there it has now move all the way 10900 and on its way created 4 gap ups which is usually the sign of a strong trend (typical of Elliott Wave 3)
What is most interesting is on 4th April it activated a Bullish Island Reversal as highlighted in the chart suggesting "if this holds" then the index is all set for a v strong up move. We have already seen a similar kind of move in Bank Nifty when it made a Bullish Island Reversal on 10th March at 34500 from where its rallied 4000 pts.
Levels wise a "daily close above 10975" would open the passage for 11700 with strong support in the island region of 10600-500 for now.
Happy Investing!

NIFTY SMLCAP 100 INDEXRetesting of the neck line of head and shoulder pattern in daily time frame.
May be a sharp crash is waiting for us.
Be cautious.
Happy trading.
If you like my analysis please like 🤗


#CNXSMALL CAP one more ATH breakout what next?#CNXSMALL CAP each time index gave a fresh ATH breakout after consolidation there was a good up move for next 3-4 months.
Currently index came out of consolidation zone. We can expect ~30% move from current levels.
Scrap views if index goes below 10350

Midcap Analysis 1. Midcap Sensex Has fallen below the Channel and Taking support at crucial Juncture
2. if it falls below 200 EMA down trend will follow
3. uptill 10 % its said to be correcting , so far fallen around 12 %
4. Its forming a pin Bar candle , Confirmation candle forming above the previous Day closing is a reversal and below will be a down trend
5. Ready with the good fundamental Midcap stocks for accumulation if midcap index reverses.
6. India Vix is rising sharply due to acute fall , if it crosses 25 , downfall is there .

Nifty Smallcap - Key Support The smallcap index has fallen below the 50EMA and closed right at the channel bottom.
Tomorrow it needs to move back above the 50EMA to help keep the index bullish..any more fall could then become a change of trend in small/midcap stocks.
Below 17670 I'd loose to sell stocks from my portfolio which are showing weakness..
Watch the index for hints.

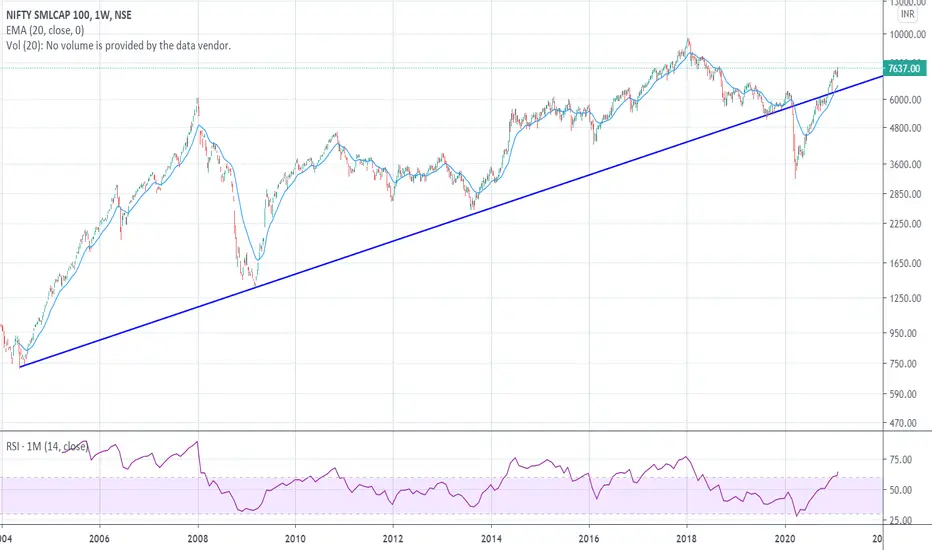
Nifty SmallCap 100 Moving Past 2018 Highs RSI : Weekly and Monthly Above 60 ; Suggesting Momentum to the upside.
Relative Outperformance to Broader Market ( CNX 500)
First Fib Target @ 13700
Stop Loss Trigger: 9550
XXXXXXXXXXXXXXXXXXXXXXXXXXXXXXXXXXXXXXXXXXXXXXXXXXXXXXXXXXXXXXXXXXXXXXXXXXXXXXXXXXXXXXXXXXXXXXXXXXXXXXXXXXXXXXXXXXXXXXXXXXXXXXXXXXXX
Risk Disclosure
DISCLAIMER: Futures , stocks and options trading involves substantial risk of loss and is not suitable for every investor. The valuation of futures , stocks and options may fluctuate, and, as a result, clients may lose more than their original investment. The impact of seasonal and geopolitical events is already factored into market prices. The highly leveraged nature of futures trading means that small market movements will have a great impact on your trading account and this can work against you, leading to large losses or can work for you, leading to large gains.
If the market moves against you, you may sustain a total loss greater than the amount you deposited into your account. You are responsible for all the risks and financial resources you use and for the chosen trading system. You should not engage in trading unless you fully understand the nature of the transactions you are entering into and the extent of your exposure to loss. If you do not fully understand these risks you must seek independent advice from your financial advisor.
All trading strategies are used at your own risk.

NIFTY SMALLCAP SHORT TERM TOPWe can clearly see nifty smallcap has made a short term top in market with high near by previous high and almost divergence on RSI daily chart. we can see meaningful correction from here.

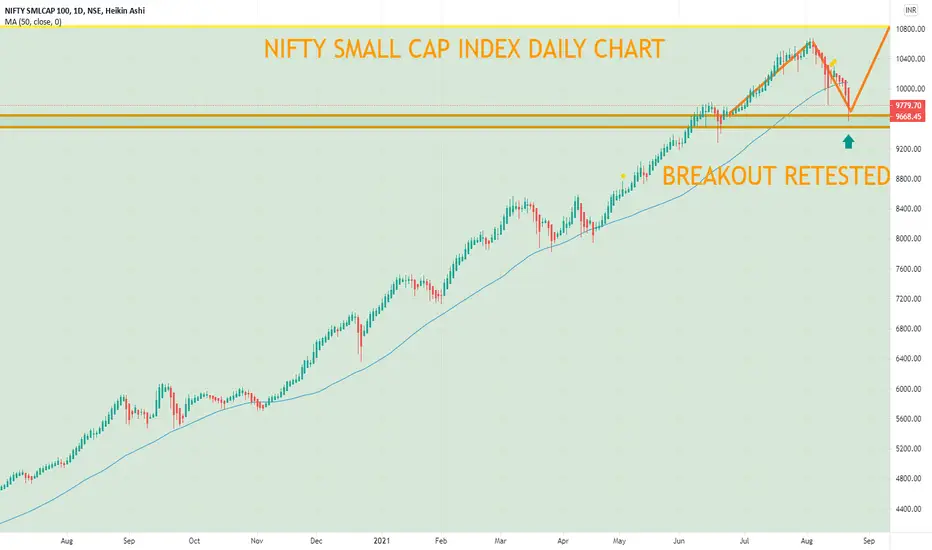
NIFTY SMALLL CAP DAILY CHART Breakout retested , can start accumulating quality stocks in yr portfolio.if 9500-9400 holds then 10800-11000 can come
Breached but did not close below 50EMACNXSMALLCAP went below 50EMA but closed above. Needs to bounce back from these levels otherwise the other major support near 8500 levels. Minor suppports at 9400 and 9200.

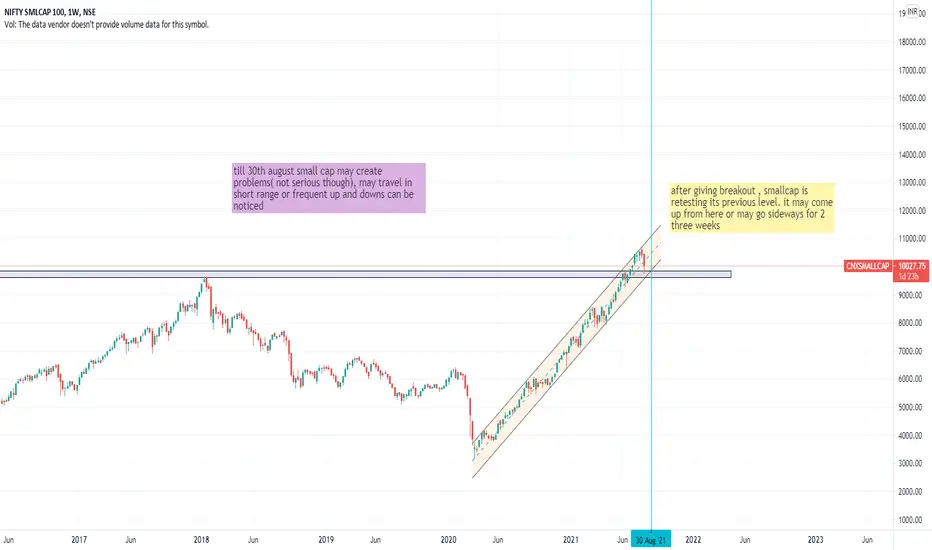
smallcap is retesting small cap gave multiyear breakout now it is testing its breakout level. it may go above or side ways as indicated in picture.
#CNXSMALLCAP verge of giving a fresh breakou#CNXSMALLCAP, Small cap index on verge of giving a fresh breakout over ATH, Weekly closing of index above 9700 shall confirm the breakout. Once done out performance in small cap stocks can be seen. Index has Fibonacci targets of 13500 and 19800 on long term


Nifty Small Cap - Time to not miss this oneSmall Cap - Index rallied big time in last one week. its monthly RSI also closed above 60 last month. It is looking to break out of 7600-7800 resitance zone. If it does this month above it we can see a big dash towards its All Time High. Even if it falls and bounces back from 6600-6800 zone, we still might have our BIG SMALL CAP Rally ON!.
DISC: Not a SEBI Registered. I post charts for my own study.
Nifty Smallcap 100 Index - Breakout - Possible targets 7600/7730Nifty Smallcap 100 Index seems to have broken out based on the above trendline - Possible targets are 7600 and 7730.

Smallcaps remain at riskNifty Smallcap 100 remains at risk, stuck below resistance near 4700 but well above support at 2700. Long-term 4700 is the level that matters. If we’re below that, then downside risk remains elevated.


Nifty Small Cap Update - Be Prepared to SIP MoreNifty Small Cap Index has broken a 11 Year TrendLine. 5100 crucial and if it slips it can go to 4590 also. So be prepared to SIP more in Small Cap Index Fund. Make it Large as once it bounces it will be sharp and will last for another 11-18 months. The Current small cap massacre is the longest period of breakdown.

Small Cap - Down but Not OutSmall cap index is down still below the Mukti year trend line... need another 300 points more to come out and sustain....See the beauty of Dojis reversals at most bottoms...
