Next report date
—
Report period
—
EPS estimate
—
Revenue estimate
—
197.35 INR
10.96 B INR
385.93 B INR
37.02 M
About Dixon Technologies (India) Ltd.
Sector
Industry
CEO
Atul Behari Lall
Website
Headquarters
Noida
Founded
1993
ISIN
INE935N01020
FIGI
BBG00DY9XKS3
Dixon Technologies (India) Ltd. engages in the manufacture and sale of electronic products. The firm offers consumer electronics such as LED television, home appliances such as washing machines and lighting products such as LED bulbs and tube lights, down lighters, and compact fluorescent bulbs and mobile phones. It also provides after sales services. The company was founded by Sunil Vachani and Atul Bihari Lall on January 15, 1993 and is headquartered in Noida, India.
Related stocks

Dixon: After a Buy Signal,rally continues
Dixon : After a Buy Signal ,rally continues
( Not a Buy / Sell Recommendation
Do your own due diligence ,Market is subject to risks, This is my own view and for learning only .)

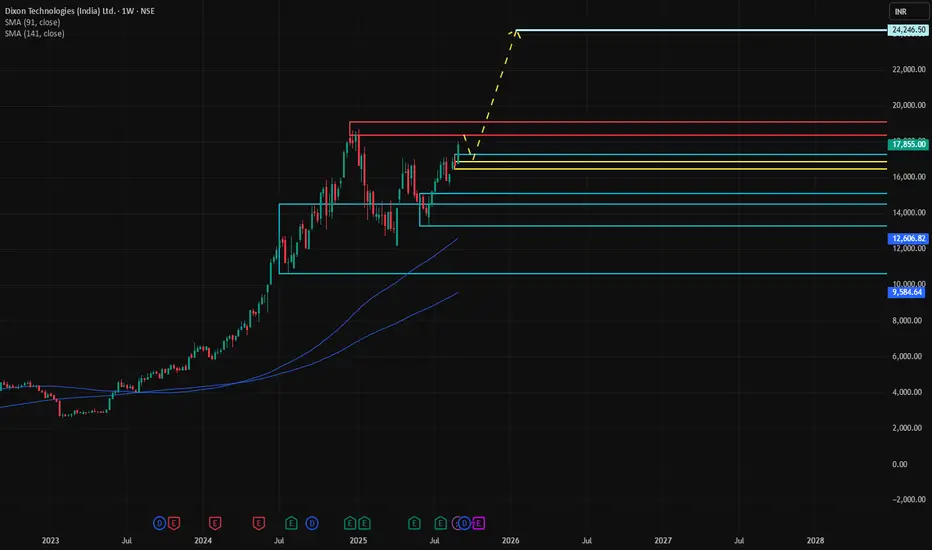
DIXON🔎 Multi-Timeframe (MTF/ITF) Analysis
HTF (Yearly–Quarterly): Strong UP trend, with average demand zone 9,007 – 11,137 (avg ~10,072).
MTF (Monthly–Daily): All UP trends. Current active demand cluster is 16,470 – 17,287.
ITF (Intraday 240m/180m/60m): Confirming demand at 16,470 – 16,878.
📌 Observa
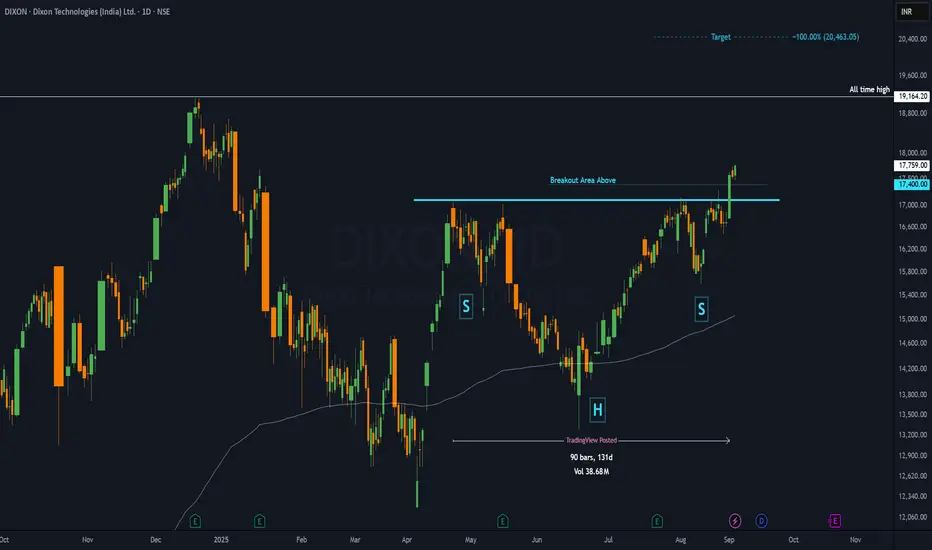
DIXON - 4 months HEAD & SHOULDERS CONTINUATION══════════════════════════════
Since 2014, my markets approach is to spot
trading opportunities based solely on the
development of
CLASSICAL CHART PATTERNS
🤝Let’s learn and grow together 🤝
══════════════════════════════
Hello Traders ✌
After a careful consideration I came to the conclusion that:
-
Dixon Tech Trendline breakout My favorite pattern form here
Risk reward 1:3
Sl be closing below swing
1st tgt LTH
Dixon TechnologiesAs Nifty Consumer Index are above
RSI 60 Level Daily / Weekly / Monthly
Dixon also the same Resistance has been crossed @ 17025
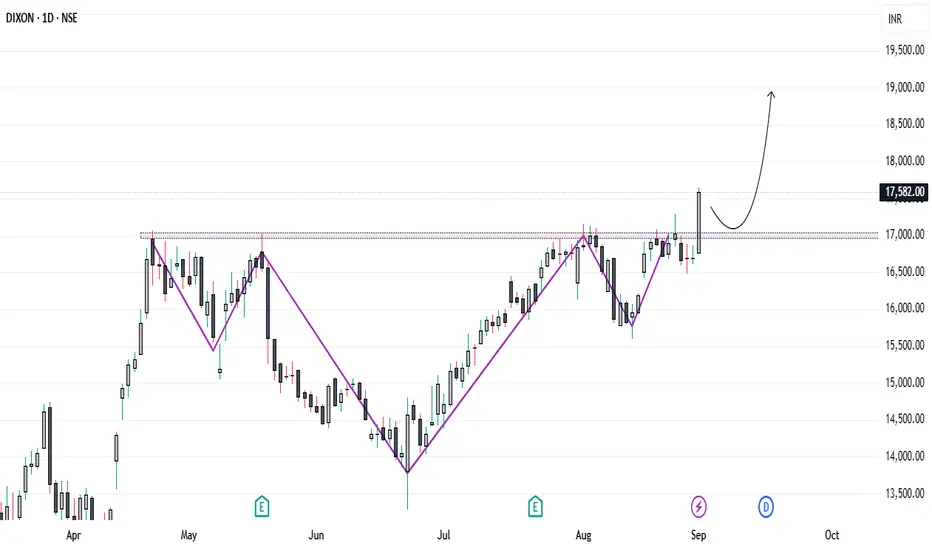
Now formed W pattern,
Expected level 19148

DIXON Clears ₹17,000! Strong GDP Data Fuels Momentum...DIXON has been consolidating in a bullish structure over the past few weeks, forming an Inverted Head & Shoulders pattern on the daily timeframe – a strong reversal signal that often precedes major trend shifts.
📈 Technical Breakout:
Today, the stock broke above the ₹17,000 neckline resistance with
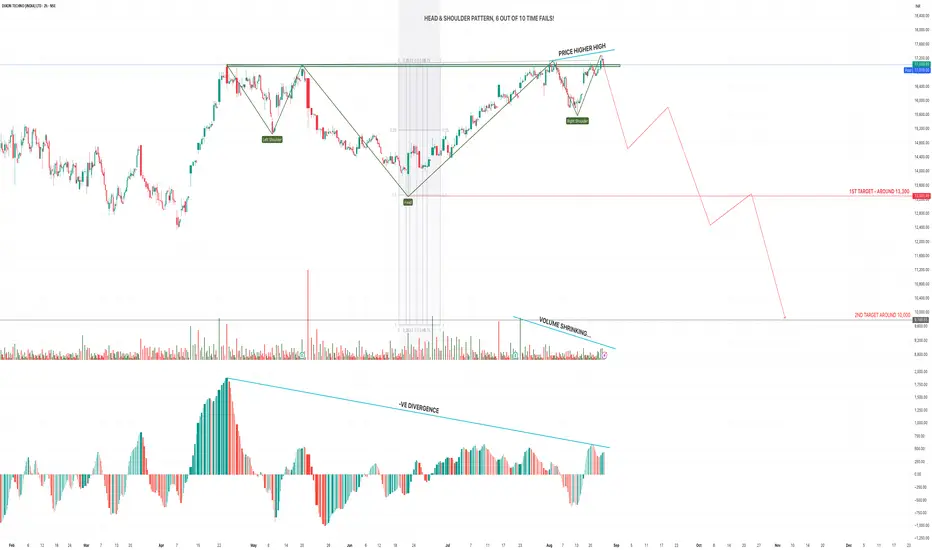
DIXON TECHNO chart with the Head & Shoulder (H&S) PatternPattern Observation
A clear Head & Shoulder structure is visible:
Left Shoulder: Early swing high before correction.
Head: Strong push making the highest peak.
Right Shoulder: Lower momentum retest of highs.
However, you’ve noted correctly on the chart — H&S often fails (6/10 times) in bullish conti
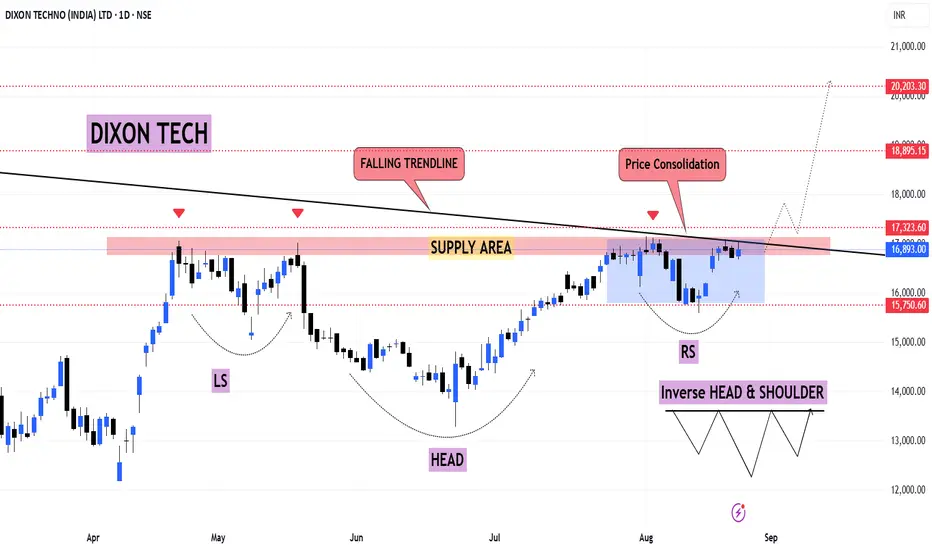
DIXON TECH – Big Move Loading🔎 Inverse Head & Shoulder forming at supply zone!👀
📌 Price consolidation visible
👉 Volume build-up hinting strong breakout possibility
#Breakout above 17,300+ can trigger a strong upside move⚡️
Dixon Technologies Breakout or not?According to my analysis, Price is currently trading above its GANN level which is a good sign, also it is developing a flag and penett type pattern. Once it crosses 18, 500 level, it will go higher and higher. Target would be around 25,000 in a period of 4-5 months. What is your take on this analy

See all ideas
Summarizing what the indicators are suggesting.
Neutral
SellBuy
Strong sellStrong buy
Strong sellSellNeutralBuyStrong buy
Neutral
SellBuy
Strong sellStrong buy
Strong sellSellNeutralBuyStrong buy
Neutral
SellBuy
Strong sellStrong buy
Strong sellSellNeutralBuyStrong buy
An aggregate view of professional's ratings.
Neutral
SellBuy
Strong sellStrong buy
Strong sellSellNeutralBuyStrong buy
Neutral
SellBuy
Strong sellStrong buy
Strong sellSellNeutralBuyStrong buy
Neutral
SellBuy
Strong sellStrong buy
Strong sellSellNeutralBuyStrong buy
Displays a symbol's price movements over previous years to identify recurring trends.
Frequently Asked Questions
The current price of DIXON is 18,161.00 INR — it has increased by 0.25% in the past 24 hours. Watch Dixon Technologies (India) Ltd. stock price performance more closely on the chart.
Depending on the exchange, the stock ticker may vary. For instance, on NSE exchange Dixon Technologies (India) Ltd. stocks are traded under the ticker DIXON.
DIXON stock has fallen by −0.30% compared to the previous week, the month change is a 7.23% rise, over the last year Dixon Technologies (India) Ltd. has showed a 27.00% increase.
We've gathered analysts' opinions on Dixon Technologies (India) Ltd. future price: according to them, DIXON price has a max estimate of 22,300.00 INR and a min estimate of 9,085.00 INR. Watch DIXON chart and read a more detailed Dixon Technologies (India) Ltd. stock forecast: see what analysts think of Dixon Technologies (India) Ltd. and suggest that you do with its stocks.
DIXON reached its all-time high on Dec 17, 2024 with the price of 19,148.90 INR, and its all-time low was 312.00 INR and was reached on Aug 13, 2019. View more price dynamics on DIXON chart.
See other stocks reaching their highest and lowest prices.
See other stocks reaching their highest and lowest prices.
DIXON stock is 0.88% volatile and has beta coefficient of 1.35. Track Dixon Technologies (India) Ltd. stock price on the chart and check out the list of the most volatile stocks — is Dixon Technologies (India) Ltd. there?
Today Dixon Technologies (India) Ltd. has the market capitalization of 1.10 T, it has increased by 0.36% over the last week.
Yes, you can track Dixon Technologies (India) Ltd. financials in yearly and quarterly reports right on TradingView.
Dixon Technologies (India) Ltd. is going to release the next earnings report on Oct 23, 2025. Keep track of upcoming events with our Earnings Calendar.
DIXON earnings for the last quarter are 46.30 INR per share, whereas the estimation was 35.04 INR resulting in a 32.15% surprise. The estimated earnings for the next quarter are 45.15 INR per share. See more details about Dixon Technologies (India) Ltd. earnings.
Dixon Technologies (India) Ltd. revenue for the last quarter amounts to 128.37 B INR, despite the estimated figure of 120.38 B INR. In the next quarter, revenue is expected to reach 151.02 B INR.
DIXON net income for the last quarter is 2.25 B INR, while the quarter before that showed 4.01 B INR of net income which accounts for −43.87% change. Track more Dixon Technologies (India) Ltd. financial stats to get the full picture.
Yes, DIXON dividends are paid annually. The last dividend per share was 8.00 INR. As of today, Dividend Yield (TTM)% is 0.03%. Tracking Dixon Technologies (India) Ltd. dividends might help you take more informed decisions.
Dixon Technologies (India) Ltd. dividend yield was 0.06% in 2024, and payout ratio reached 4.38%. The year before the numbers were 0.07% and 8.11% correspondingly. See high-dividend stocks and find more opportunities for your portfolio.
As of Sep 24, 2025, the company has 8.89 K employees. See our rating of the largest employees — is Dixon Technologies (India) Ltd. on this list?
EBITDA measures a company's operating performance, its growth signifies an improvement in the efficiency of a company. Dixon Technologies (India) Ltd. EBITDA is 17.42 B INR, and current EBITDA margin is 3.36%. See more stats in Dixon Technologies (India) Ltd. financial statements.
Like other stocks, DIXON shares are traded on stock exchanges, e.g. Nasdaq, Nyse, Euronext, and the easiest way to buy them is through an online stock broker. To do this, you need to open an account and follow a broker's procedures, then start trading. You can trade Dixon Technologies (India) Ltd. stock right from TradingView charts — choose your broker and connect to your account.
Investing in stocks requires a comprehensive research: you should carefully study all the available data, e.g. company's financials, related news, and its technical analysis. So Dixon Technologies (India) Ltd. technincal analysis shows the strong buy rating today, and its 1 week rating is buy. Since market conditions are prone to changes, it's worth looking a bit further into the future — according to the 1 month rating Dixon Technologies (India) Ltd. stock shows the buy signal. See more of Dixon Technologies (India) Ltd. technicals for a more comprehensive analysis.
If you're still not sure, try looking for inspiration in our curated watchlists.
If you're still not sure, try looking for inspiration in our curated watchlists.