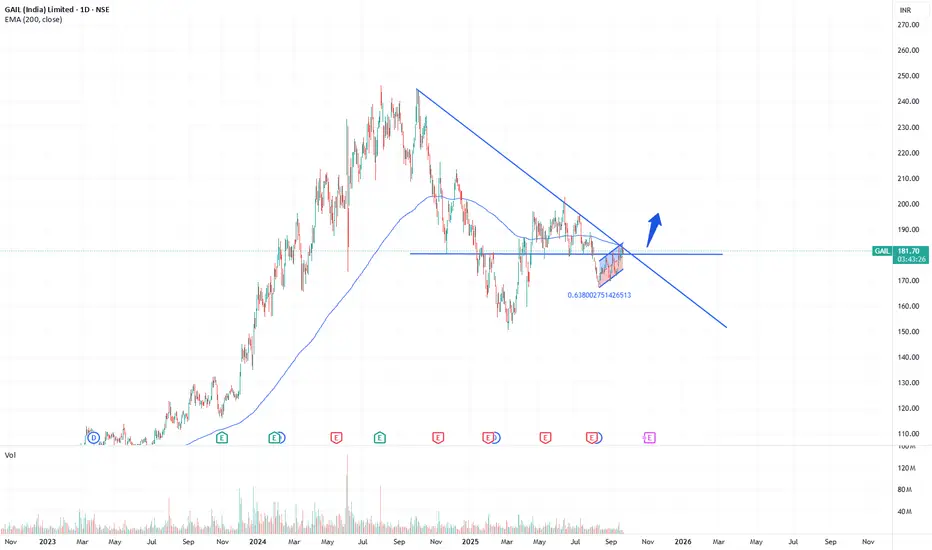
GAIL – Watching Trendline TestTrendline Break: Price is currently testing the long-term descending trendline near 182–185. Watching whether it sustains above this zone or reacts lower. This will be the first sign of buyers regaining control.
Channel Formation: Price is moving inside a rising channel. A move outside this chan
Next report date
—
Report period
—
EPS estimate
—
Revenue estimate
—
17.70 INR
124.50 B INR
1.42 T INR
2.70 B
About GAIL (India) Limited
Sector
Industry
CEO
Sandeep Kumar Gupta
Website
Headquarters
New Delhi
Founded
1984
ISIN
INE129A01019
FIGI
BBG000B9Y4Y4
GAIL (India) Ltd. engages in the exploration, production, processing, transmission, distribution, and marketing of natural gas. It operates through the following business segments: Transmission services, Natural Gas Trading or Marketing, Petrochemicals, LPG and Other Liquid Hydrocarbons, and Other. The Transmission services segment includes natural gas and LPG. The Natural Gas Trading or Marketing segment supplies of natural gas include fuel to power plants, feedstock for gas-based fertilizer plants, LPG extraction, and city gas distribution. The Petrochemicals segment manufactures and markets polymers polypropylene, linear low-density polyethylene, and high-density polyethylene from natural gas. The LPG and Other Liquid Hydrocarbons segment sells gas processing unit products such as LPG, propane, pentane, naphtha, and by-products of polymer plant. The Other segment is involved in GAIL TEL, exploration and production, city gas, and power generation. The company was founded in August 1984 and is headquartered in New Delhi, India.
Related stocks
GAIL Analysis 20-Sep-2025LTP: 181
Supports: 150/83
Resistances: 203/247
As long as the above supports hold, we will see 200 first.
Further,
Normal target: 200-227
251
Ultimate target: 272-300
Extensions: 344-389, 525

GAIL SellGAIL seems to take take resistance at channel top. Sell GAIL @CMP (181.50) with an SL of 184 and target of 175.

Energy Giant on Fire – GAIL Ready for TakeoffThis is the 4-hour timeframe chart of GAIL India Limited.
The stock is currently trading within a well-defined parallel channel and is positioned near its support zone at 165–171.
If this support level sustains, we may witness higher prices in GAIL, with potential targets in the 185–190 range.
Th

Gail Swing Trade Setup 📊 Price Action & Trend Analysis
Analyzing market trends using price action, key support/resistance levels, and candlestick patterns to identify high-probability trade setups.
Always follow the trend and manage risk wisely!
Price Action Analysis Interprets Market Movements Using Patterns And Trend

Gail India: (15 min)Gail India: (15 min)
Getting set for a breakout.
Add to watchlist and wait.
Note: The most important thing for a trader is, to believe what you see! Not to believe what you like to see!

GAIL at Best Support zone !! There are two chart of Gail on Daily timeframe.
On the first chart Gail is moving in well defined parallel channel with support near at 178-180 zone.
Daily RSI is also taking support and bouncing back, indicating a revival in short-term momentum and strengthening the overall bullish setup.
On the

GAIL 1H Chart Analysis (Trendline Breakout Setup)NSE:GAIL GAIL 1H Chart Analysis (Trendline Breakout Setup)
The 1-hour chart of GAIL (India) Ltd shows a clean descending trendline breakout followed by higher lows, indicating strength building up. The price is consolidating just below a horizontal resistance around ₹193, forming a potential ascen

GAIL INDIA - Trying to come out of falling wedge (Bullish)Falling wedge breakout pattern will be valid when the stock is closing above 165 on daily chart. Wait for it to close above the mentioned level. Once the follow through is seen one can enter with the stop loss of 149.
Disclaimer: I'm not a SEBI registered advisor. This is a paper trade idea for edu

Strong uptrend Buying zone (161 -162)
Strong uptrend 💥
Easy target 🎯 187
Final target 🎯 192
Stoploss 159 below close price

See all ideas
Summarizing what the indicators are suggesting.
Neutral
SellBuy
Strong sellStrong buy
Strong sellSellNeutralBuyStrong buy
Neutral
SellBuy
Strong sellStrong buy
Strong sellSellNeutralBuyStrong buy
Neutral
SellBuy
Strong sellStrong buy
Strong sellSellNeutralBuyStrong buy
An aggregate view of professional's ratings.
Neutral
SellBuy
Strong sellStrong buy
Strong sellSellNeutralBuyStrong buy
Neutral
SellBuy
Strong sellStrong buy
Strong sellSellNeutralBuyStrong buy
Neutral
SellBuy
Strong sellStrong buy
Strong sellSellNeutralBuyStrong buy
Displays a symbol's price movements over previous years to identify recurring trends.
Frequently Asked Questions
The current price of GAIL is 176.49 INR — it has decreased by −1.38% in the past 24 hours. Watch GAIL (India) Limited stock price performance more closely on the chart.
Depending on the exchange, the stock ticker may vary. For instance, on NSE exchange GAIL (India) Limited stocks are traded under the ticker GAIL.
GAIL stock has fallen by −5.01% compared to the previous week, the month change is a −1.33% fall, over the last year GAIL (India) Limited has showed a −24.58% decrease.
We've gathered analysts' opinions on GAIL (India) Limited future price: according to them, GAIL price has a max estimate of 270.00 INR and a min estimate of 150.00 INR. Watch GAIL chart and read a more detailed GAIL (India) Limited stock forecast: see what analysts think of GAIL (India) Limited and suggest that you do with its stocks.
GAIL reached its all-time high on Jul 31, 2024 with the price of 246.30 INR, and its all-time low was 5.38 INR and was reached on Sep 17, 2001. View more price dynamics on GAIL chart.
See other stocks reaching their highest and lowest prices.
See other stocks reaching their highest and lowest prices.
GAIL stock is 3.03% volatile and has beta coefficient of 1.58. Track GAIL (India) Limited stock price on the chart and check out the list of the most volatile stocks — is GAIL (India) Limited there?
Today GAIL (India) Limited has the market capitalization of 1.13 T, it has increased by 1.48% over the last week.
Yes, you can track GAIL (India) Limited financials in yearly and quarterly reports right on TradingView.
GAIL (India) Limited is going to release the next earnings report on Nov 6, 2025. Keep track of upcoming events with our Earnings Calendar.
GAIL earnings for the last quarter are 2.90 INR per share, whereas the estimation was 3.20 INR resulting in a −9.39% surprise. The estimated earnings for the next quarter are 3.73 INR per share. See more details about GAIL (India) Limited earnings.
GAIL (India) Limited revenue for the last quarter amounts to 347.69 B INR, despite the estimated figure of 351.29 B INR. In the next quarter, revenue is expected to reach 345.70 B INR.
GAIL net income for the last quarter is 23.69 B INR, while the quarter before that showed 24.92 B INR of net income which accounts for −4.92% change. Track more GAIL (India) Limited financial stats to get the full picture.
GAIL (India) Limited dividend yield was 4.10% in 2024, and payout ratio reached 39.61%. The year before the numbers were 3.04% and 36.53% correspondingly. See high-dividend stocks and find more opportunities for your portfolio.
As of Sep 29, 2025, the company has 27.09 K employees. See our rating of the largest employees — is GAIL (India) Limited on this list?
EBITDA measures a company's operating performance, its growth signifies an improvement in the efficiency of a company. GAIL (India) Limited EBITDA is 143.11 B INR, and current EBITDA margin is 11.17%. See more stats in GAIL (India) Limited financial statements.
Like other stocks, GAIL shares are traded on stock exchanges, e.g. Nasdaq, Nyse, Euronext, and the easiest way to buy them is through an online stock broker. To do this, you need to open an account and follow a broker's procedures, then start trading. You can trade GAIL (India) Limited stock right from TradingView charts — choose your broker and connect to your account.
Investing in stocks requires a comprehensive research: you should carefully study all the available data, e.g. company's financials, related news, and its technical analysis. So GAIL (India) Limited technincal analysis shows the sell today, and its 1 week rating is sell. Since market conditions are prone to changes, it's worth looking a bit further into the future — according to the 1 month rating GAIL (India) Limited stock shows the buy signal. See more of GAIL (India) Limited technicals for a more comprehensive analysis.
If you're still not sure, try looking for inspiration in our curated watchlists.
If you're still not sure, try looking for inspiration in our curated watchlists.