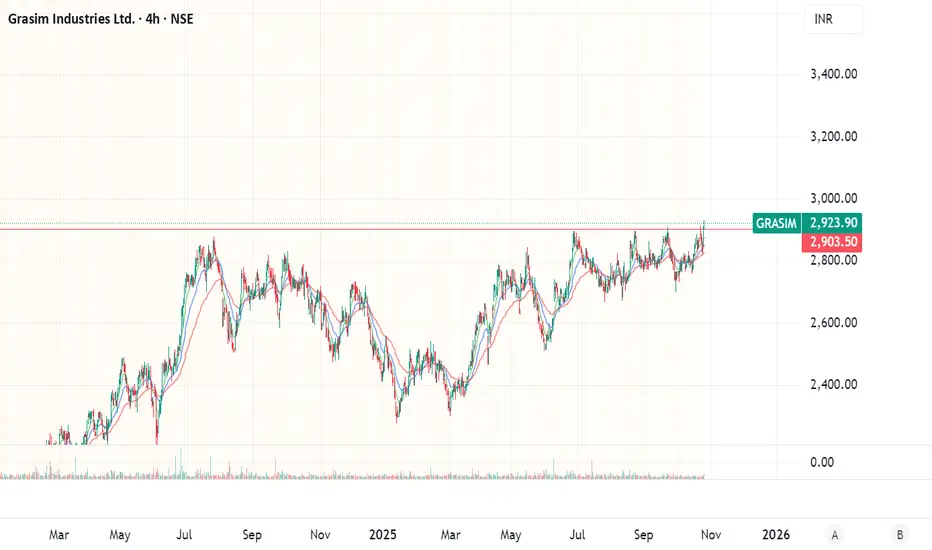
GRASIM – Price Compressing Toward Major Trendline SupportPrice is getting squeezed between a falling trendline and a rising support. This type of compression usually ends with a strong move. A clean descending trendline from the recent swing-high shows short-term selling pressure. A major rising trendline from the bottom still holds the structure.
Pr
Next report date
—
Report period
—
EPS estimate
—
Revenue estimate
—
64.60 INR
37.06 B INR
1.48 T INR
356.91 M
About Grasim Industries Ltd.
Sector
Industry
CEO
Himanshu Kapania
Website
Headquarters
Mumbai
Founded
1947
Identifiers
2
ISININE047A01021
Grasim Industries Ltd. engages in the production of chemicals and cement. It operates through the following segments: Cellulosic Fibres, Chemicals, Building Materials, Financial Services, and Others. The Cellulosic Fibres segment refers to Cellulosic Staple Fibre (CSF) and Cellulosic Fashion Yarn (CFY). The Chemicals segment includes Chlor Alkali, Specialty Chemicals and Chlorine Derivatives. The Building Materials segment pertains to cement, paints and B2B E-Commerce businesses. The Financial Services segment offers Non-Bank Financial Services, Life Insurance Services, Asset Management (AMC), Housing Finance, and Equity Broking. The Others segment represents the remaining businesses of the Group, mainly represents Textiles, Insulators and Renewable Power business. The company was on August 25, 1947 and is headquartered in Mumbai, India.
Related stocks

Grasim|| CMP 2920|| 31.10.2025📊 GRASIM Industries
Price has given a Cup & Handle breakout on the daily chart 💥
✅ Retest successfully done
✅ Sustaining above key EMAs
📈 Looks strong for continuation on the upside from current levels
You can check how Cup with handle pattern works!!

Grasim Industries Ltd for 28th Oct #GRASIM Grasim Industries Ltd for 28th Oct #GRASIM
Resistance 2940-2950 Watching above 2952 for upside momentum.
Support area 2900 Below 2920 gnoring upside momentum for intraday
Watching below 2897 for downside movement...
Above 2930 ignoring downside move for intraday
Charts for Educational purposes

Positional setup and fundamental summary for Grasim Industries.Fundamentals
Market cap: ~ ₹1.9-2.0 lakh Crore.
P/E Ratio: ~ ~45× (recent data).
PB Ratio: ~1.9-2.0×.
ROCE / ROE: Historically modest – ROCE ~5-6% in some published ratios.
Recent performance: It posted ~9% YoY growth in Q4 FY25 PAT (~₹1,496 crore) and declared a dividend.
The Economic T
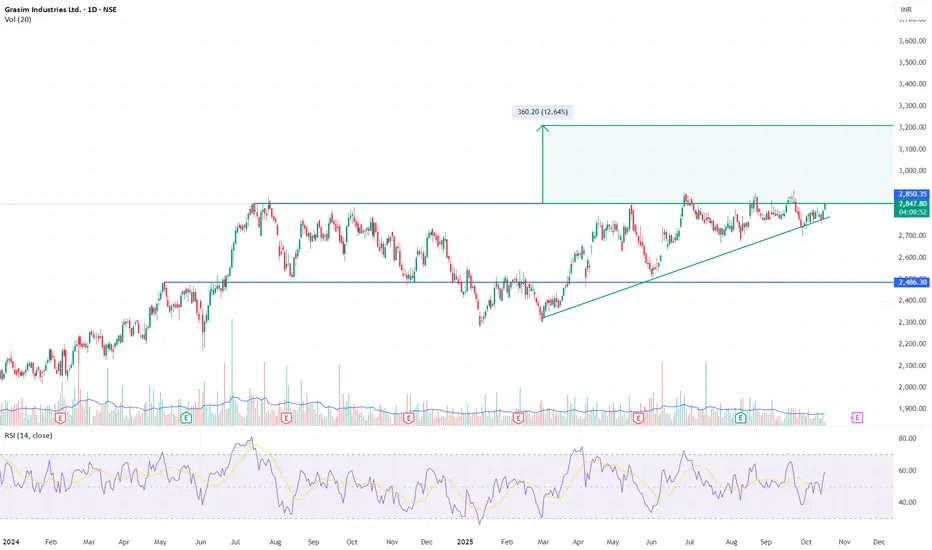
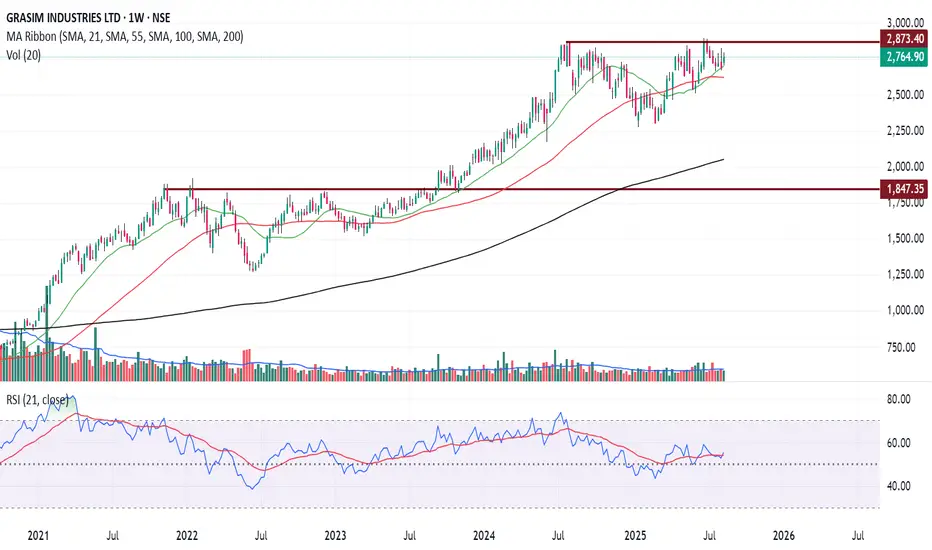
GRASIM - Weekly Breakout?Chart Analysis :
Price sustaining and breaking out above its major resistance of 2895-2910 zone. Price made a long consolidation of 67 weeks/ 15months and now breaking out.
Daily close above 2910-2920 will confirm breakout and can be considered for long.
Key Levels:
Entry level : Above 2920
Targ
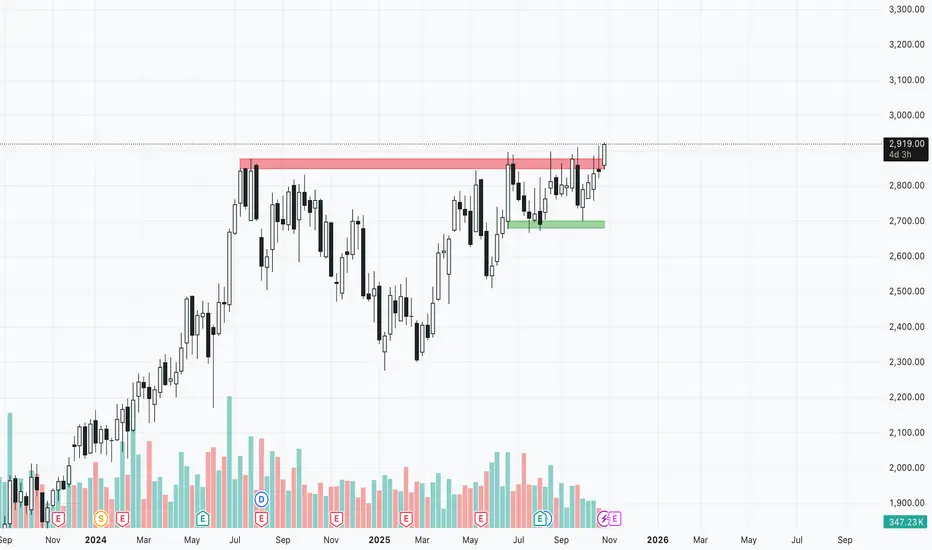
GRASIM – Base Pressure Building for Breakout Above ₹2,850Price has spent almost a year trapped between ₹2,480 and ₹2,850. Each dip since mid-2025 has formed higher lows, compressing against the same horizontal ceiling. Today’s candle closes right at ₹2,850 with RSI rising toward 60 — the structure is tightening for resolution.
A decisive close above ₹2,9
Grasim - Quick 10% move Grasim expected to get rejected from the levels of 2370.
This short term move has produce 9 to 10%.

Grasim - Bullish SetupGood bullish setup shaping up in Grasim. A new consolidation above 2875-2900, will help further with upmove. Trading close to ATH, above MA's, decent RSI, volumes are consistent. I will consider it more as a positional candidate. A well known name from Birla Group. Had a decent Q1 and with India gov
Review and plan for 11th August 2025 Nifty future and banknifty future analysis and intraday plan.
Quarterly results.
This video is for information/education purpose only. you are 100% responsible for any actions you take by reading/viewing this post.
please consult your financial advisor before taking any action.
----Vinaykum

Grasim Long_Support @ 20 DEMAGrasim Long:
- Takes support @ 20/ 50 DEMA
- Enter when prices favorable
- Earnings on Aug 8
- SL Close below 20 DEMA

See all ideas
Summarizing what the indicators are suggesting.
Neutral
SellBuy
Strong sellStrong buy
Strong sellSellNeutralBuyStrong buy
Neutral
SellBuy
Strong sellStrong buy
Strong sellSellNeutralBuyStrong buy
Neutral
SellBuy
Strong sellStrong buy
Strong sellSellNeutralBuyStrong buy
An aggregate view of professional's ratings.
Neutral
SellBuy
Strong sellStrong buy
Strong sellSellNeutralBuyStrong buy
Neutral
SellBuy
Strong sellStrong buy
Strong sellSellNeutralBuyStrong buy
Neutral
SellBuy
Strong sellStrong buy
Strong sellSellNeutralBuyStrong buy
Displays a symbol's price movements over previous years to identify recurring trends.
699GIL31
Grasim Industries Limited 6.99% 04-APR-2031Yield to maturity
—
Maturity date
Apr 4, 2031
721GIL34
Grasim Industries Limited 7.21% 19-DEC-2034Yield to maturity
—
Maturity date
Dec 19, 2034
656GIL30
Grasim Industries Limited 6.56% 06-JUN-2030Yield to maturity
—
Maturity date
Jun 6, 2030
763GIL27
Grasim Industries Limited 7.63% 01-DEC-2027Yield to maturity
—
Maturity date
Dec 1, 2027
750GIL27
Grasim Industries Limited 7.5% 10-JUN-2027Yield to maturity
—
Maturity date
Jun 10, 2027
See all GRASIM bonds
Frequently Asked Questions
The current price of GRASIM is 2,852.00 INR — it has increased by 0.72% in the past 24 hours. Watch Grasim Industries Ltd. stock price performance more closely on the chart.
Depending on the exchange, the stock ticker may vary. For instance, on NSE exchange Grasim Industries Ltd. stocks are traded under the ticker GRASIM.
GRASIM stock has risen by 0.28% compared to the previous week, the month change is a 2.90% rise, over the last year Grasim Industries Ltd. has showed a 13.40% increase.
We've gathered analysts' opinions on Grasim Industries Ltd. future price: according to them, GRASIM price has a max estimate of 3,690.00 INR and a min estimate of 2,960.00 INR. Watch GRASIM chart and read a more detailed Grasim Industries Ltd. stock forecast: see what analysts think of Grasim Industries Ltd. and suggest that you do with its stocks.
GRASIM reached its all-time high on Oct 29, 2025 with the price of 2,977.80 INR, and its all-time low was 16.65 INR and was reached on Apr 28, 1999. View more price dynamics on GRASIM chart.
See other stocks reaching their highest and lowest prices.
See other stocks reaching their highest and lowest prices.
GRASIM stock is 1.37% volatile and has beta coefficient of 1.17. Track Grasim Industries Ltd. stock price on the chart and check out the list of the most volatile stocks — is Grasim Industries Ltd. there?
Today Grasim Industries Ltd. has the market capitalization of 1.91 T, it has decreased by −1.00% over the last week.
Yes, you can track Grasim Industries Ltd. financials in yearly and quarterly reports right on TradingView.
Grasim Industries Ltd. is going to release the next earnings report on Feb 16, 2026. Keep track of upcoming events with our Earnings Calendar.
Grasim Industries Ltd. revenue for the last quarter amounts to 96.10 B INR, despite the estimated figure of 93.69 B INR. In the next quarter, revenue is expected to reach 96.50 B INR.
GRASIM net income for the last quarter is 5.53 B INR, while the quarter before that showed 14.19 B INR of net income which accounts for −60.99% change. Track more Grasim Industries Ltd. financial stats to get the full picture.
Yes, GRASIM dividends are paid annually. The last dividend per share was 10.00 INR. As of today, Dividend Yield (TTM)% is 0.36%. Tracking Grasim Industries Ltd. dividends might help you take more informed decisions.
Grasim Industries Ltd. dividend yield was 0.38% in 2024, and payout ratio reached 18.00%. The year before the numbers were 0.44% and 11.72% correspondingly. See high-dividend stocks and find more opportunities for your portfolio.
As of Dec 24, 2025, the company has 47.02 K employees. See our rating of the largest employees — is Grasim Industries Ltd. on this list?
EBITDA measures a company's operating performance, its growth signifies an improvement in the efficiency of a company. Grasim Industries Ltd. EBITDA is 395.77 B INR, and current EBITDA margin is 24.77%. See more stats in Grasim Industries Ltd. financial statements.
Like other stocks, GRASIM shares are traded on stock exchanges, e.g. Nasdaq, Nyse, Euronext, and the easiest way to buy them is through an online stock broker. To do this, you need to open an account and follow a broker's procedures, then start trading. You can trade Grasim Industries Ltd. stock right from TradingView charts — choose your broker and connect to your account.
Investing in stocks requires a comprehensive research: you should carefully study all the available data, e.g. company's financials, related news, and its technical analysis. So Grasim Industries Ltd. technincal analysis shows the strong buy rating today, and its 1 week rating is strong buy. Since market conditions are prone to changes, it's worth looking a bit further into the future — according to the 1 month rating Grasim Industries Ltd. stock shows the buy signal. See more of Grasim Industries Ltd. technicals for a more comprehensive analysis.
If you're still not sure, try looking for inspiration in our curated watchlists.
If you're still not sure, try looking for inspiration in our curated watchlists.