HCLTECH 3Hour Time frameHCL Technologies (HCLTECH) 3-Hour Snapshot
Current Price: ₹1,470.00
Change: +1.72% from the previous close
Intraday Range: ₹1,432.10 – ₹1,471.90
Volume: 2,495,658 shares traded
Market Cap: ₹3.97 trillion
P/E Ratio: 23.39
Beta: 1.04 (indicating moderate volatility relative to the market)
🔎 Key Levels
Resistance:
R1: ₹1,471.90 (recent high)
R2: ₹1,490.00 (next resistance zone)
Support:
S1: ₹1,432.10 (immediate support)
S2: ₹1,400.00 (next support level)
📈 Technical Indicators
RSI (14): 62.15 — Neutral to slightly bullish
MACD: Positive, indicating upward momentum
Moving Averages:
5-period SMA: ₹1,455.00 — Buy signal
50-period SMA: ₹1,440.00 — Buy signal
200-period SMA: ₹1,400.00 — Buy signal
📌 Market Sentiment
Catalysts: Positive momentum following recent gains and analyst upgrades.
Sector Performance: IT sector showing strength, with HCL Technologies leading gains among peers.
Options Activity: Significant trading in call options at ₹1,470 strike price, indicating bullish sentiment.
📅 Outlook
Bullish Scenario: A breakout above ₹1,471.90 could lead to a push toward ₹1,490.00 and higher.
Bearish Scenario: A drop below ₹1,432.10 may test support around ₹1,400.00.
Overall Bias: Moderately bullish, with positive momentum but facing near-term resistance.
HCLTECH trade ideas

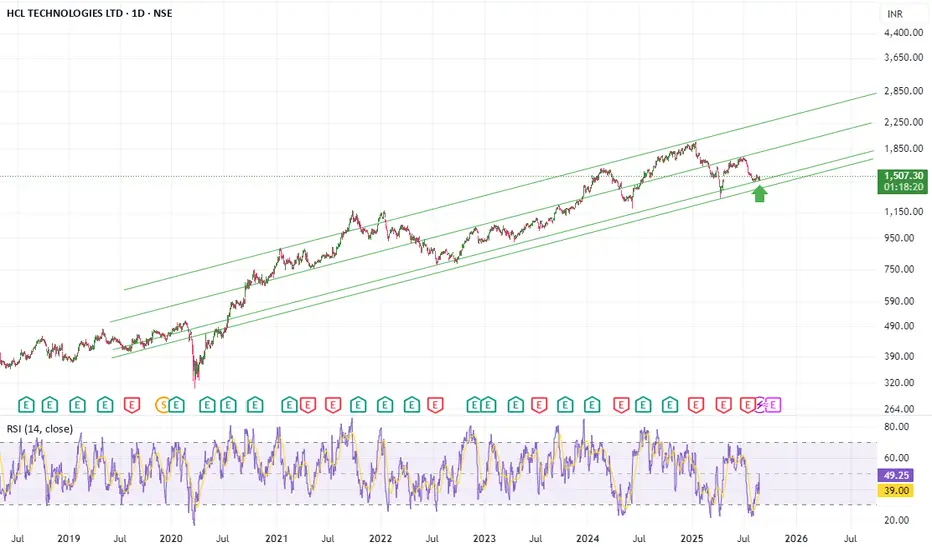
wow stock for long , with easy to understand if we are looking at channel , at trendline , prise have confirmed its double bottom , and another thing you can see is RSI indicator , it have started returning and look at look at high speed jump in rsi , wow stock for long and hold hold hold till far far far expire , if you can hold profit , , i cant , i can analyse chart well
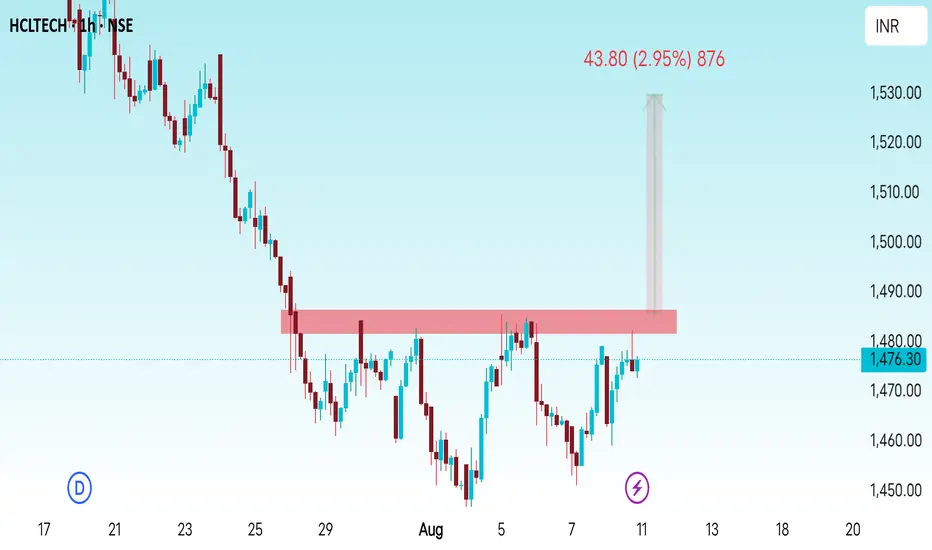
HCLTECH (NSE) – Technical & Fundamental Outlook📌 HCLTECH (NSE) – Technical & Fundamental Outlook
Date: 10 Aug 2025
CMP: ₹1,476.30
🔍 Technical View
HCLTECH is currently testing a key resistance zone near ₹1,476–₹1,480 .
Breakout Potential: A close above this zone with strong volume could push price towards ₹1,494 , and then to ₹1,520–₹1,540 .
Rejection Risk: Failure to sustain above resistance may lead to pullback towards ₹1,460 and ₹1,450 supports.
Trend Note: Price has recovered from recent lows and is pressing into the supply zone. Volume confirmation will be crucial before a breakout trade.
📊 Fundamental Snapshot
Q1 FY26 Results:
• Revenue: ₹30,349 Cr ( +8.1% YoY )
• Net Profit: ₹3,843 Cr ( -9.7% YoY ) – margin pressure remains.
• Guidance: Management upgraded lower-end revenue guidance for the year.
Dividend Yield: ~4.07% with consistent payouts.
Valuation: Trading ~13% above some intrinsic value estimates (~₹1,286) .
📅 Upcoming Catalysts
Aug 18, 2025: Equirus India Conference
Aug 19, 2025: Antique Flagship Investor Conference
Early Oct 2025: Q2 FY26 Results
These events could bring volatility and directional moves depending on management commentary.
📈 Probability Scenarios
Bullish Breakout: ~55% → Targets ₹1,494 → ₹1,520 → ₹1,540
Bearish Rejection: ~35% → Targets ₹1,460 → ₹1,450
Sideways Range: ~10% → ₹1,460–₹1,480 consolidation until a trigger
⚠️ Takeaway
Watch for breakout above ₹1,480 with strong volume for bullish confirmation. Mid-Aug events may set short-term tone. While revenue growth is solid, keep an eye on margins and valuation before long-term entries.
💬 What’s your view? Will HCLTECH break this resistance or face rejection again?
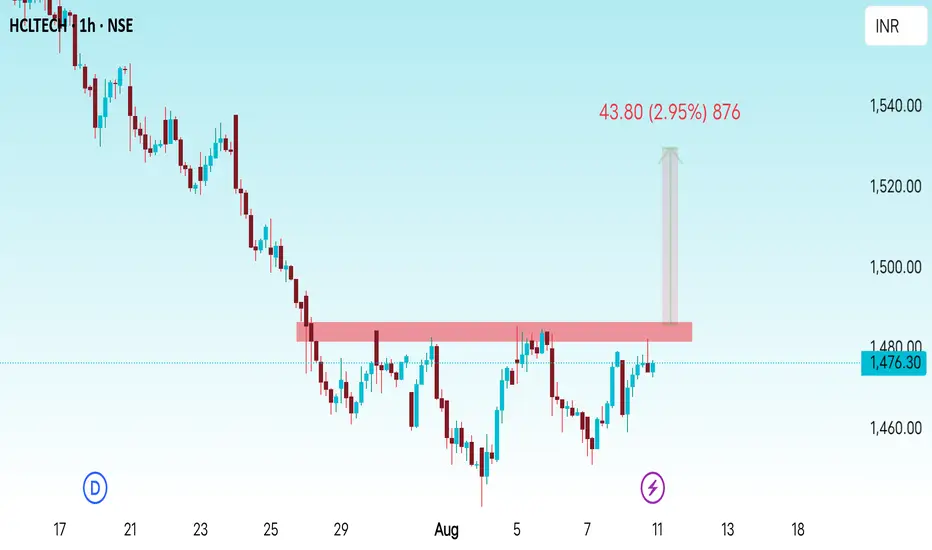
HCLTECH (NSE) – Technical & Fundamental Outlook
📌 HCLTECH (NSE) – Technical & Fundamental Outlook
Date: 10 Aug 2025
CMP: ₹1,476.30
🔍 Technical View
HCLTECH is currently testing a key resistance zone near ₹1,476–₹1,480 .
Breakout Potential: A close above this zone with strong volume could push price towards ₹1,494 , and then to ₹1,520–₹1,540 .
Rejection Risk: Failure to sustain above resistance may lead to pullback towards ₹1,460 and ₹1,450 supports.
Trend Note: Price has recovered from recent lows and is pressing into the supply zone. Volume confirmation will be crucial before a breakout trade.
📊 Fundamental Snapshot
Q1 FY26 Results:
• Revenue: ₹30,349 Cr ( +8.1% YoY )
• Net Profit: ₹3,843 Cr ( -9.7% YoY ) – margin pressure remains.
• Guidance: Management upgraded lower-end revenue guidance for the year.
Dividend Yield: ~4.07% with consistent payouts.
Valuation: Trading ₹1,286) .
📅 Upcoming Catalysts
Aug 18, 2025: Equirus India Conference
Aug 19, 2025: Antique Flagship Investor Conference
Early Oct 2025: Q2 FY26 Results
These events could bring volatility and directional moves depending on management commentary.
📈 Probability Scenarios
Bullish Breakout: ~55% → Targets ₹1,494 → ₹1,520 → ₹1,540
Bearish Rejection: ~35% → Targets ₹1,460 → ₹1,450
Sideways Range: ~10% → ₹1,460–₹1,480 consolidation until a trigger
⚠️ Takeaway
Watch for breakout above ₹1,480 with strong volume for bullish confirmation. Mid-Aug events may set short-term tone. While revenue growth is solid, keep an eye on margins and valuation before long-term entries.
💬 What’s your view? Will HCLTECH break this resistance or face rejection again?
Review and plan for 15th July 2025Nifty future and banknifty future analysis and intraday plan.
Intraday ideas.
This video is for information/education purpose only. you are 100% responsible for any actions you take by reading/viewing this post.
please consult your financial advisor before taking any action.
----Vinaykumar hiremath, CMT

HCL Tech Bullish V-shape head & Shoulder Pattern!If Giant IT company HCL tech come to retest its strong support near 1600 it would be best buying opportunity, I don't know it will come or not but the trade initiation 1600-1653 between 20 and 50 moving averages could become good opportunity to go long for short to medium term.
Buying Below -1653
Stop loss -1605
First target -1741
Second Target -1818
Risk Reward -1:3

HCL_LongPrice breaks out of this resistance with decent volume
Potential target 1833
Tight SL
Enter only if you get good price

HCLTECH | Buy @LTP | SL below 1600 | Target 2100Disclaimer:
This is not financial advice. Please do your own research or consult with a financial advisor before making any investment decisions. Investments in stocks can be risky and may result in loss of capital.

Indian Market - HCL Tech looking for upside from hereDisclaimer : Do your own research before investing. This is just a chart analysis. No recommendation to buy and sell.
Starting of the year HCL Tech was at nearly Rs. 2000 mark. It came down to nearly Rs. 1302. Now getting consolidating at the current level. I can see an inverted Head and Shoulder Pattern in formation.
If the Market continue to support , it will go up.
I have shared the levels in the chart.

HCLTECH ready for all time highHCL TECHNOLOGIES LIMITED ready for all time high target of Rs.2000.00 with a breakout from inverse head and shoulder and the price is testing the breakout point. One can play for 23% upside with a stop loss of 5%


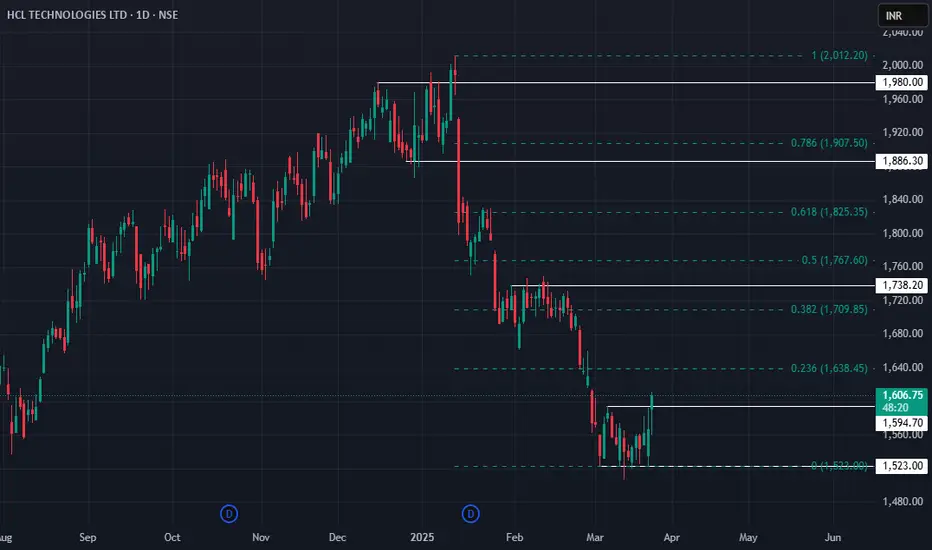
HCL Technologies: Setting Up for a Potential Bounce📈 HCL Technologies: Setting Up for a Potential Bounce
CMP: ₹1,606
Stop Loss: ₹1,490
Target 1: ₹1,738
Target 2: ₹1,825
HCL Technologies is showing signs of a potential rebound, closely mirroring the NIFTY IT index. The stock has formed a base on the daily chart and recently breached a small resistance, indicating bullish momentum may follow.
💡 Why This Matters:
With April’s quarterly results around the corner, increased market activity in HCL and the broader IT sector could present an attractive short-term trading opportunity.
⚠️ Caution:
The market remains volatile—smart position sizing and strict risk management are essential.
📌 Disclaimer: Not a SEBI-registered advisor. Always conduct your own research before making investment decisions.
#StockMarket #HCL #NIFTYIT #TechnicalAnalysis #TradingOpportunity
HCL Technologies Ltd view for Intraday 24th April #HCLTECH HCL Technologies Ltd view for Intraday 24th April #HCLTECH
Resistance 1600-1606 Watching above 1610 for upside movement...
Support area 1580 Below 1590 ignoring upside momentum for intraday
Watching below 1575 for downside movement...
Above 1590 ignoring downside move for intraday
Charts for Educational purposes only.
Please follow strict stop loss and risk reward if you follow the level.
Thanks,
V Trade Point

HCLTech 1438 trend directionHCLtech 1438 has broke down from long trend support and passed pullback test. Currently It is holding on its neckline support 1425 and expect to test 1530 and/or continue its downward journey to 960.

HCLTECH 1W 200EMA TOUCH AND BOUNCEHCLTECH on weekly touched 200EMA, by falling more than 30%.
Making higher high now.
To improve RR ratio; SL needs to be adjusted after price sustains the breakout and moves above 100EMA.
Thesis: Price should try and push towards DAILY 200EMA, i.e, returning to the mean.

Is HCLTECH done?
HCLTECH has had a phenomenal run from ₹12.9 in September 2001 to ₹2,012.2 earlier this month, a growth of ~15,500% in 279 months, averaging 40% annually.
But is it all about to end? 5/35 MACD, which I love to use to validate my EW count is showing a massive divergence on the weekly charts combined with a big high-volume engulfing bar concurrently taking shape. I can also count clear 5 waves on the monthly charts.
Based on my calculations, I can see two targets on the downside: 1418 and 970 .
Do share your opinions below.
Best!

levels to watch There are no exceptions and HCL is also part of the game. As corrections were expected, and the stock has the potential to create substantial wealth in the long run if approached with proper timing. Rather than focusing on short-term speculation, investors should shift their focus towards wealth creation by strategically building a well-rounded portfolio.
The levels mentioned here represent optimal entry points for gradually accumulating HCL shares, with the expectation that the markets will rally past previous highs in the coming months.
This approach hinges on the belief that, with patience and a long-term outlook, investors can benefit from the stock's potential upside as market conditions improve and HCL's performance strengthens.

the vwap selling Standard Deviation Explained
Standard deviation (SD) is a statistical measure of volatility, dispersion, or risk in a data set. In trading and investing, standard deviation helps traders understand how much an asset’s price fluctuates relative to its average price over a given period.
Key Concepts of Standard Deviation:
1. Measures Volatility: A high standard deviation means greater price fluctuations, while a low standard deviation indicates stable price movements.
2. Deviation from the Mean: It tells us how far individual data points (e.g., prices) deviate from the average (mean).
3. Used in Trading Indicators: Standard deviation is used in Bollin

HCLTECH - Overreaction to results?HCLTECH just got beat down hard after reporting pretty decent Q3 results, I believe that this is a gross overreaction and there's probably some fund selling or something else happenning here.
In any case, this is an oppurtunity for us to buy at a great stock at a great price.
Buy @1822 with a Stoploss @1775. Trail stoplosses as it recovers and sell only at around 2000.

HCLTECH | Based on RSI, consider shorting with a small SL.Disclaimer:
This is not financial advice. Please do your own research or consult with a financial advisor before making any investment decisions. Investments in stocks can be risky and may result in loss of capital.

IT sector is prepped for take off!! IT sector result season kicks off with TCS tomorrow. All the large players and IT at an index level seem to be operating in a channel and.....all of them are at the bottom of the channel!
Expecting TCS to give expectation beating results and handsomely march towards the mid and then may be to the top of the channel!! same for HCL, Wipro and Persistent. All of these seem to be headed to beat recent highs!!
Infosys seems less prepped may be it has in line results and sees more consolidation in the same range sub 2k
Fingers crossed but the party is about to start
#infosys #tcs #wipro #HCL #IT

HCL Tech Swing TradeHello,
Trend-Based Analysis. Buy the Dips, Sell The Rallies, Also Following the Trend. Let's see where the Price Action takes us, Riding the wave. Potential trade setups based on trend momentum.
Technical analysis based on trend identification and momentum, Looking for high-probability setups within the prevailing trend.
Analyzing the current market trend and potential future price movement. Focusing on risk management and reward-to-risk ratios.
Details is Mentioned in Chart, Read carefully.. .
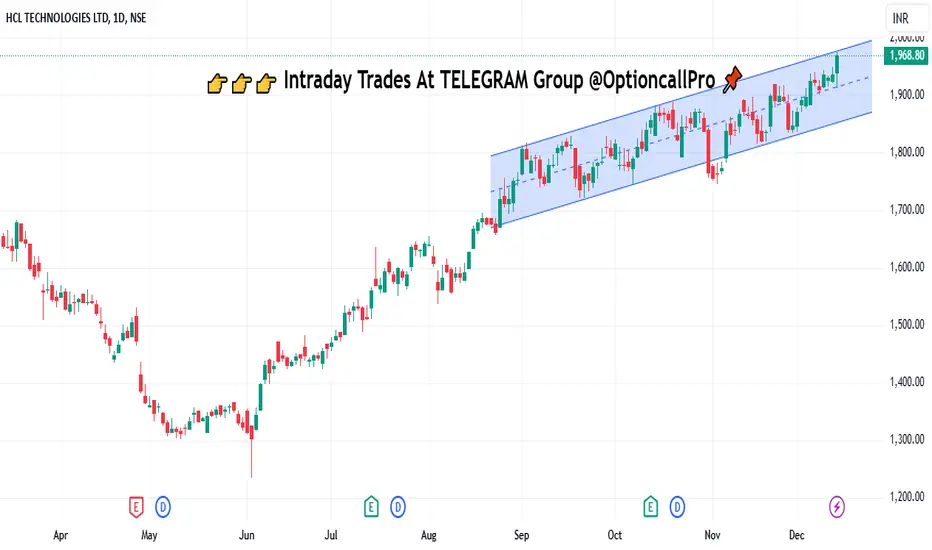
Rising parallel channel after cross 1700 decisively on 26 Aug 24. the HCL is continuing its rising and following parallel channel.
