HDFCLIFE is near support line of channel patternNSE:HDFCLIFE large cap stock trading at 30% below it all time high formed a year ago (2021-09-02) is near the support of channel pattern formed from its inception in 2017.
Fundamentally strong company with good PE ratio, Dept to asset ratio, financially good revenue and profits, holdings wise no major sell off, consistent dividend payer.
Short term : For short term gains, buy at channel bounce around 530 and above and exit at 15% gains.
Long term : Since the channel is formed from 2017, higher gains can be obtained in long term by accumulating more at lower levels. Buy around 530 (optional) and average around 450, more at lower levels. Exit can be near the resistance reversal or after breakout (if any). This can nearly provide 70% for full up move.
Key note : Always follow proper risk management to avoid losing capital from false breakouts as this is common.
Caution : This is a knowledge sharing analysis, not a call.
Profits are not made from following ideas, but by following Risk Management .
HDFCLIFE trade ideas

HDFCLIFE sell for intraday tradingHDFCLIFE sell for intraday trading if stock break the given Support level.........

HDFCLIFE - BTSTwe are looking HDFCLIFE bullish move.
Disclaimer:
Kind regards to all friends and members ,
Stock market investment is subject to 100% market risks. Our company is not a SEBI registered company. Please consult your financial advisor before investing. This is for learning and training purposes only. Market Traps administrators are not responsible for any financial gains or losses resulting from your decisions. You acknowledge that stock market investments are highly risky and that you understand the market risks involved. Hence any legal action is void.

HDFC Life - Momentum theme worked; waiting for final breakoutHDFC Life - Momentum theme worked; waiting for final breakout
Momentum : bought at 540 rs based on Momentum. today Target of 5 % is achieved.
Yet to sell as it is close to final breakout of 572. once it breaks out SL will be 570

HDFCLIFE is testing the trendline HDFCLIFE is testing the trendline u can go LONG (BUY) and do swing trade...and stoploss at ₹547 target at ₹617

HDFCLIFE Golden CrossoverMoving average shows SL @548 i.e. 50 ema
target would be @585 golden crossover

HDFCLIFE Buy for intraday tradingHDFCLIFE Buy for intraday trading if stock break the given resistance zone .........

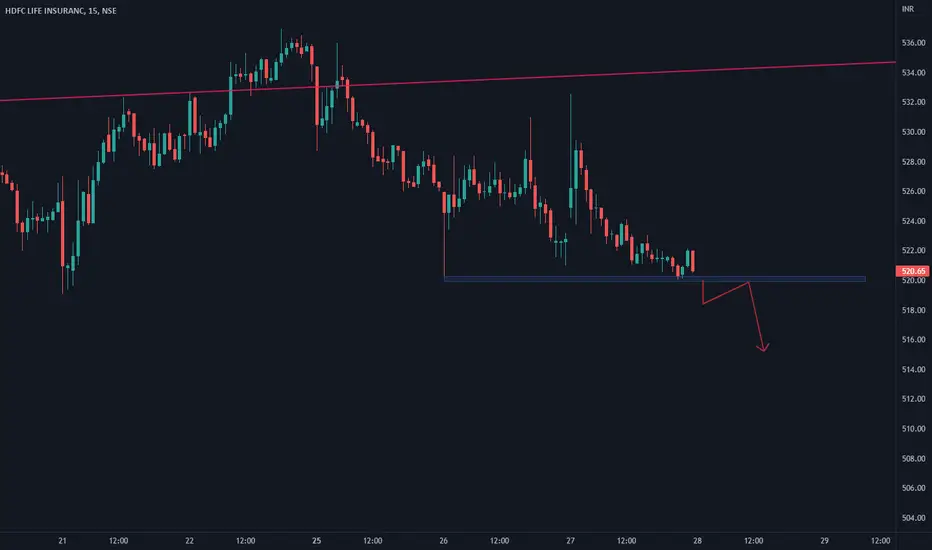
hdfc life breakout HDFC LIFE is gonna give a huge breakout here keep in watchlist or 520 is the right price to enter here preps in order cmp is 523
NSE:HDFCLIFE

HDFCLIFE sell for intraday tradingHDFCLIFE sell for intraday trading if stock break the previous 2 days low then we will short the stock........
HDFCLIFE sell for intraday tradingHDFCLIFE sell for intraday trading if stock break the given support level then we will short the trade....

HDFC LIFE HDFC LIFE - A mean reversion set up here
Go long with a SL of 515 for the targets 446 & 557

HDFCLIFE sell for intraday tradingHDFCLIFE sell for intraday trading if stock break the previous days law then we will short the trade.......

Good time to buy HDFC Life Insurance Good time to collect HDFCLIFE shares, as it is near the trend line. Additionally parent company HDFC and HDFC Bank are near support.

HDFC LIFE INSURANCE DILY TFHDFC LIFE Insurance was made head and shoulder pattern on daily timeframe... wait for breakdown.....

HDFC LIFE : Pullback tradeHDFCLIFE witnessed a breakout from a horizontal trendline and extended gains to a high of 581.
Due to the sharp rise, there was a profit booking, and the price might retrace to the breakout levels , which would now act as a support zone (565-568).
This retracement can be a good opportunity to long in the stock with a good risk reward.

HDFC LIfeHDFCLife is currently following range bound fibonacci levels. If it closes above the baseline (Greenline) 572 next week for couple of sessions with green candle, it is likely to reach 610 -615 and expected to come down. 525-530 levels.
Being first week of month, it can be supported by put options of 540 level.
Suggested potential opportunity (subject to market risk).
buy HDFCLife if closes above 572 supported by 540-560 put. Nearest one with premium not extending beyond (2-3%) which is below. 1SD Currently 1SD is about 3-4%. Based on ongoing volatility one can expect2-5% return. Expected holding period 10-15 trading sessions.
NSE:HDFCLIFE
use stop loss and % profit to book according to individual risk taking and management capabilities.
Example trade taken as of 30jun:
HDFCLife 1 lot (1100 shares) @ 552Rs
HDFCLife 540 put @ 15 Rs.
Unrealised gain/loss - 5*1100 = 5500 gain.
Investment: 16500 for put + about 150K for margin.
Expected holding period: 18 to 22 July.
Note: Above idea is for knowledge sharing and not a recommendation to buy or sell. It is upto each individual to make that decision. Writer of above idea does not take any responsibilities for profit or losses and not liable for any losses made by others based on above idea .

#HDFCLIFE #Priceaction #FlagHDFC Life 1W: It is observed generally this script respects pattern and moves accordingly. Presently it formed a Pole & Flag pattern and hence good to position before it gives a BD. Hence any rise towards 580 can be used as selling opportunity with a SL 620 on closing basis, keeping 10-15% downside from level mentioned.

HDFC Life insuranceLooking nice on that point, at this level after retracement, risk reward ration is very nice so that's why I posted this idea.

hdfc life longhdfc life gave a nice breakout and a retest and trading near 200 moving avarage we gan take a long positionb after the moving avrage break out sl below the support
plan ur trade with good risk reward
just an another educational content


HDFC LIFE HDFC LIFE - Repost
Earlier posted at 530 levels
Now at 608.
The stock stood strong against the market downside.
Targets - 700 & 775
SL - 585 (For conservative buyers)

HDFCLIFE showing strength from here.Expecting some good moves from here in #HDFCLIFE
After long time coming out of Bearish channel.

Go long.. Relative trend positiveBullish on HDFC Life
Both Weekly and Daily trends on RSI relative to NIFTY is +ve
Strong Volumes accompanying the weekly breakouts.
Targets in line with the previous Resistance levels marked.
