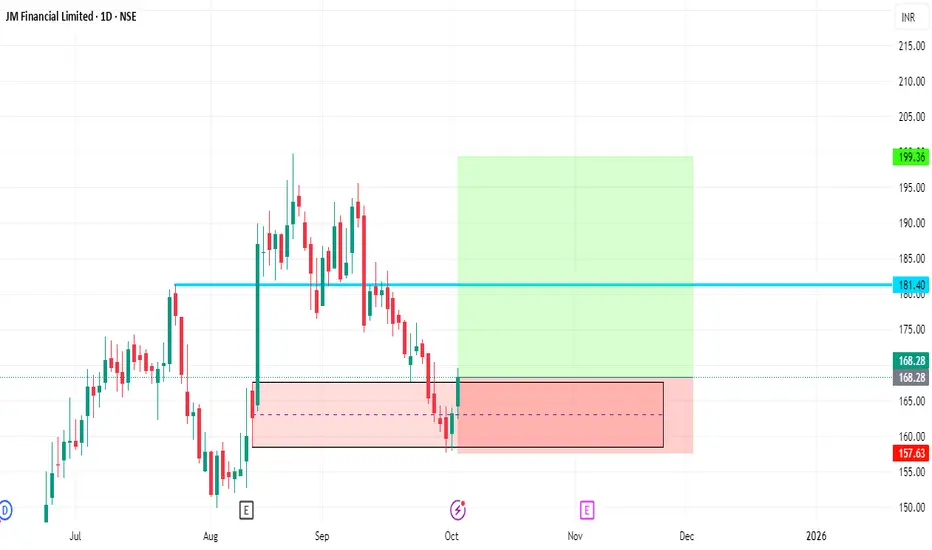
JM Financial Bullish Reversal SetupSharing a fresh daily chart setup for JM Financial Limited (NSE:JMFINANCIL). The price has recently bounced from a strong support zone in the ₹162–₹168 range, showing signs of strength after a prolonged decline. Increased volume at this level indicates renewed buyer interest.
Trade Plan
Entry Zone: ₹162–₹168 (Demand area recently respected)
Stop Loss: ₹157 (Below recent swing low)
Primary Targets: ₹181 (short-term), ₹199 (medium-term)
Chart Observations
Price pulled back to an accumulation zone with marked demand.
Bullish reversal candlestick formation observed near support.
Attractive risk-reward setup with well-defined invalidation and multiple upside targets.
Watch for confirmation above ₹181, which may bring further buying momentum.
Notes
This setup uses technical support/resistance, volume spike, and price action for a disciplined trade approach.
Strong risk management is recommended, as structure may shift quickly; monitor stops and trail profits as price approaches resistance targets.
Disclaimer
This idea is for educational sharing only and not investment advice. Please conduct your own research before entering any positions
JMFINANCIL trade ideas
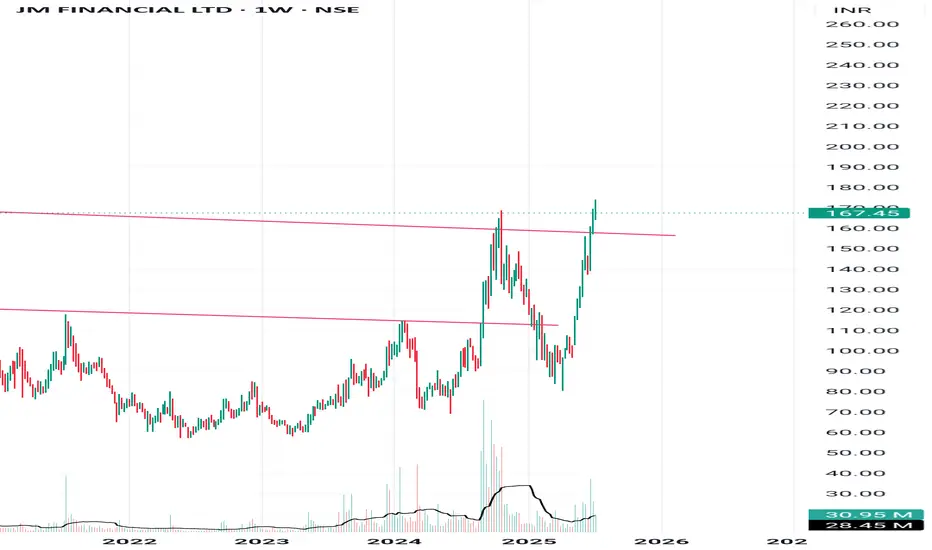
JMFINANCILJMFINANCIL has given multiyear breakout, after breakout is sustaining above near breakout. its a good stock which can rewards us a lot. review this and plan according to your risk management.

JM FINANCIAL LTD S/RSupport and Resistance Levels:
Support Levels: These are price points (green line/shade) where a downward trend may be halted due to a concentration of buying interest. Imagine them as a safety net where buyers step in, preventing further decline.
Resistance Levels: Conversely, resistance levels (red line/shade) are where upward trends might stall due to increased selling interest. They act like a ceiling where sellers come in to push prices down.
Breakouts:
Bullish Breakout: When the price moves above resistance, it often indicates strong buying interest and the potential for a continued uptrend. Traders may view this as a signal to buy or hold.
Bearish Breakout: When the price falls below support, it can signal strong selling interest and the potential for a continued downtrend. Traders might see this as a cue to sell or avoid buying.
MA Ribbon (EMA 20, EMA 50, EMA 100, EMA 200) :
Above EMA: If the stock price is above the EMA, it suggests a potential uptrend or bullish momentum.
Below EMA: If the stock price is below the EMA, it indicates a potential downtrend or bearish momentum.
Trendline: A trendline is a straight line drawn on a chart to represent the general direction of a data point set.
Uptrend Line: Drawn by connecting the lows in an upward trend. Indicates that the price is moving higher over time. Acts as a support level, where prices tend to bounce upward.
Downtrend Line: Drawn by connecting the highs in a downward trend. Indicates that the price is moving lower over time. It acts as a resistance level, where prices tend to drop.
Disclaimer:
I am not SEBI registered. The information provided here is for learning purposes only and should not be interpreted as financial advice. Consider the broader market context and consult with a qualified financial advisor before making investment decisions.

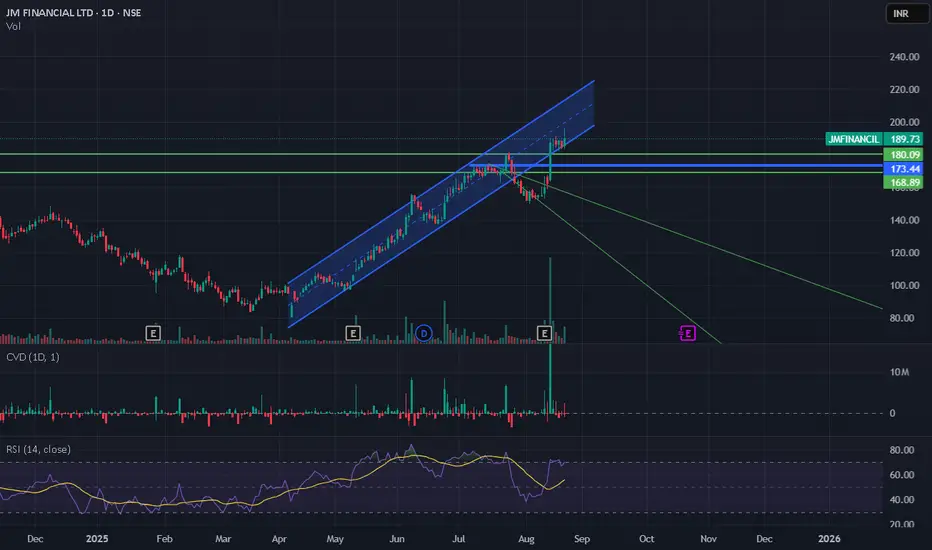
JM FINANCIAL - A PURE BUSINESS TURNAROUND STORYThis is a Pure Techno funda pick. The rational behind picking this support is the stock is on a rising channel on a daily time frame, as indicated in the chart. Secondly, Results were outstanding which came few days back, someone may argue why now, because stock is already doubled from march lows, here comes the fundamental part -
1.Management in the past concall after march results mentioned about change in the product mix shifting towards wealth management (fee based) revenue , which is very optimistic from a business stand point of view because of higher margins better markets.
2. AMC business is doubled in the last quarter meaning thereby clear shift in the product mix thereby management indicating 'walking the talk'.
3.Now, most important where the price action could go, following Fibonacci levels on a longer term time frame the next level which is achievable is around 250. someone may still argue why now, because of the latest quarterly results and it seems management has exceeded the expectations of investors.
Lastly, on a pure longterm view and considering success of business it can grow 4X to 5x from current levels , the indicators of operating leverage are already into play making the bottom line of the company strong.
Disclaimer- This is not a Financial Recommendation, this is for the love of techno funda knowledge, please consult your financial advisor before acting.

JM Financial Limited
JM Financial Limited is an integrated and diversified financial services company in India, primarily involved in mortgage lending, distressed credit, asset management, investment banking, and private equity management.
Latest Share Price & Performance (as of August 14, 2025)
Current Price: ₹185.89
Previous Close: ₹187.07
52-Week High/Low: ₹190.00 / ₹80.20
Market Cap: ₹17,774 crore
P/E Ratio: 16.09
PEG Ratio: Not available
Dividend Yield: 1.45%
Book Value per Share: ₹106.99
Return on Equity (ROE): 8.49%
Face Value: ₹1.00
Beta: 1.75 (indicates stock volatility)
Recent Returns
1 Week: +19.71%
3 Months: +61.73%
12 Months: +104.43%
3 Years: +182.94%
5 Years Stock CAGR: 18%
Financial Highlights
Sales Growth (5 years): 5.06% (considered poor)
Dividend Payout Ratio: 35.6%
Operating Profit Margin: 57% (TTM)
ROCE: 9.39%

JMFINANCIL | Buy @180 | SL below 145 | Target 280Disclaimer:
This is not financial advice. Please do your own research or consult with a financial advisor before making any investment decisions. Investments in stocks can be risky and may result in loss of capital.
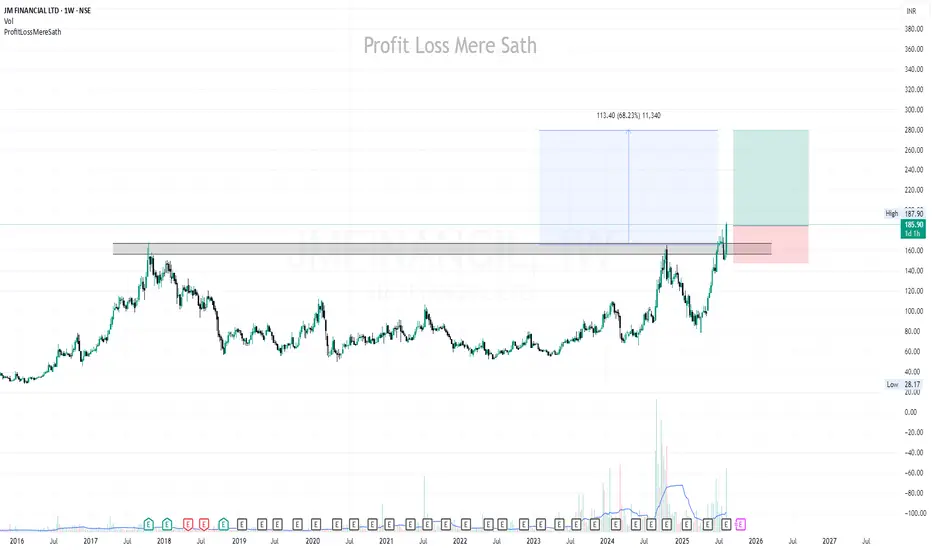
Clear breakout Clear trendline breakout and good to go long. Check volume and do your own analysis too. This is only for educational purposes.

JM FINANCIL Long consolidation BOLooks like a big cup & handle but not accurate.
The stock gave a long consolidation breakout, and volumes are also shooting up.

JM Financial: 6-Year Breakout with Huge Weekly Volume!🚀 JM Financial: 6-Year Breakout with Huge Weekly Volume! 🚀
Current Market Price: 119
Stop Loss: 85
Target: 170
JM Financial has achieved a major breakout after 6 years, with substantial weekly volume. The stock recently completed a box breakout above 112 and is now standing above the key neckline at 118, which it broke in September 2018 due to a head and shoulder pattern breakdown.
📈 Strategy: Consider pyramiding as the stock crosses 129 for potential gains.
📉 Risk Management: Use a stop loss at 85 to manage risk effectively.
📊 Disclaimer: As a non-SEBI registered analyst, I recommend conducting thorough research or seeking advice from financial professionals before making investment decisions. Exciting times ahead!
#MarketAnalysis #JMFinancial #TechnicalAnalysis #Breakout #InvestmentOpportunities #StockMarket

SWING IDEA - JMFINANCIALJM Financial , a diversified financial services group offering services in investment banking, brokerage, and asset management, is currently presenting a potential swing trade setup.
Reasons are listed below :
120 Zone Resistance Break : The 120 level has acted as a strong resistance since 2018. The price is now attempting to break through this zone, indicating possible continued upward movement.
Bullish Marubozu Candle on Weekly Timeframe : The formation of a bullish Marubozu candle on the weekly chart suggests strong buying pressure and a potential shift towards higher levels.
Massive Volume Increase : The surge in trading volumes supports the price movement, indicating strong market participation.
Constant Higher Lows : The formation of higher lows signals a consistent upward trend, reflecting increasing bullish sentiment.
Trading Above 50 and 200 EMA : The stock is trading above both the 50 and 200 exponential moving averages, which supports the overall bullish trend and indicates long-term strength.
Target - 150 // 170 // 190
Stoploss - weekly close below 105
DISCLAIMER -
Decisions to buy, sell, hold or trade in securities, commodities and other investments involve risk and are best made based on the advice of qualified financial professionals. Any trading in securities or other investments involves a risk of substantial losses. The practice of "Day Trading" involves particularly high risks and can cause you to lose substantial sums of money. Before undertaking any trading program, you should consult a qualified financial professional. Please consider carefully whether such trading is suitable for you in light of your financial condition and ability to bear financial risks. Under no circumstances shall we be liable for any loss or damage you or anyone else incurs as a result of any trading or investment activity that you or anyone else engages in based on any information or material you receive through TradingView or our services.
@visionary.growth.insights

JM Financial Near Key Breakout Level➡️ Bullish breakout above ₹129.63
➡️ Next resistance levels: ₹150.00 and ₹171.50

JM FINANCIAL LTD LONG6 year range breakout with ATH in volume. should buy here or wait for range high retest.. if fomo one should start building position here. looks really strong as does the whole finance sector on the whole.

JMFINANCIALHi guys,
In this chart i Found a Demand Zone in JMFINANCIAL CHART for Positional entry,
Observed these Levels based on price action and Demand & Supply.
*Don't Take any trades based on this Picture.
... because this chart is for educational purpose only not for Buy or Sell Recommendation..
Thank you

Trendline Breakout in JM FinancialJM Financial has given Breakout with Volume, this could be a possible swing trade. My Target could be 160 in 6-8 weeks.

Bullish in JM FinanceSee in Chart,
2 times W pattern in last few months.
As per my view,
If JM Finance close above 115 on weekly base.
Try to touch upside around 140-185
Not a Recommendation,
I only share my view.
Consult your financial adviser

Took position in JMJM Financial looks good here.
Added it positionally at 106.
SL is 100.
Target 2 x of SL
Do you own analysis before entering.

Weekly breakout in JM FinancialWeekly breakout in JM Financial.
A channel pattern breakout and limited stoploss.

JM Financial Weekly breakout possibleJM financial looking good for short term
concentrate if price sustain above 105
Weekly breakout possible..
Note*- The views expressed are based on personal observations/opinions. Please do you own research before making any trading decisions.


JM Financial - Long (17-12-2023)JM Financial
Buy @ CMP
For Target : 117-126-140-155
SL 60
Swing Trade
Holding Duration - Few days
Please consult your financial advisor before investing
All research for educational purposes only.
