JMFINANCIAL trading near trend line in weekly timeframeJMFINANCIAL trading near trend line in weekly timeframe, it is near to breakout keep in watchlist
JMFINANCIL trade ideas

#JMFINANCIL Underperformer for more than a decadeUnderperformer since more than a decade. Is it gearing up to shine now?

JM Financial Long Term View JM Financial is forming a Symmetrical Triangle and has also given Breakout.
Entry is at 85.50
Target is 192.30
Stop Loss is at 60.50
(Note:- This View is purely based on Technical Analysis and is for educational purposes only, please consult with your financial advisor before taking any trade).

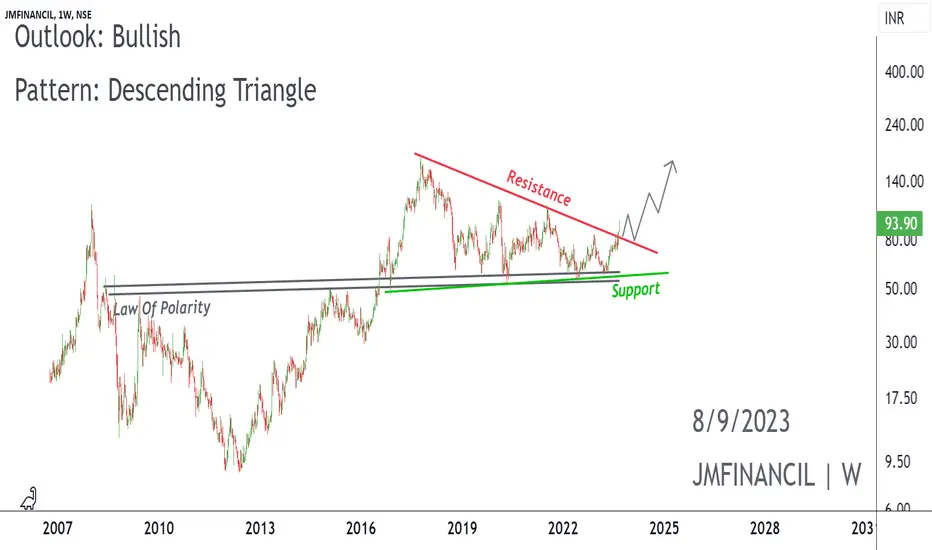
📈 Exciting Bullish Pattern Alert! 🐂📊 Pattern: Descending Triangle
📌 Symbol/Asset: JMF Financial
🔍 Description: Multi-year break out of pattern.
👉 Remember: Technical patterns are just one piece of the puzzle. Consider conducting further research, consulting with a financial advisor, and managing your risks appropriately.
Cup and Handle Pattern BreakoutPlease look into the chart for a detailed understanding.
Consider these for short-term & swing trades with 2% profit.
For BTST trades consider booking
target for 1% - 2%
For long-term trades look out for resistance drawn above closing.
Please consider these ideas for educational purpose

Jm Financial Services stock On bullishJm Financial Services stock On bullish… Chart Structure..
Double Bottom Pattern…. Target 116…. Very bullish…


JM FINANCIAL FORMED INVERSE HEAD AND SHOULDER PATTERN
Trading ABOVE 10 , 21,63,100 , 2000 EMA
Targets as mentioned in the chart , WITH STRICT STOP LOSS - THIS IS PURELY TECHNICAL

Jm financial head n shoulder breakout Jm financial has given weekly breakout. After a long consolidation GM financial has given a weekly break out so the next target should be 100-120.

JM FINANCIAL LTD.Monthly Chart Looks Good.
SL - 70
INITIAL TGT - 91
Basis some minute observations, chart analysis is made, target and SL is given to understand the core of the subject for learning purpose only.


Long on JM financialThe financial sector doing good with credit cycle turning up. JM financial looks good on chart for long term. Stop loss 60. Might touch 90 and 125.
Disclaimer: The stock/index/currency discussed do not constitute Investment/trading advise and is merely an effort towards enhancing learning, knowledge and book keeping. Kindly do your own due diligence and/or consult investment advisor before making any investment/trading decisions

jm financialJM Financial private equity set to raise Rs 1,500 cr in third fund.
Sonia Dasgupta to head investment banking of JM Financial


JM FINANCIALLokks good buying zone
Do your own analysis before investing
IN BEAR MARKET BULL ARE ALSO AVAILABLE

JMFINANCILCan anyone explain JMFINANCIL in daily chart on 3rd Sep 2021? 3rd Sep daily candle close at 0.00!!!!!

Buy for 2 monthsAt a trend support zone. BO of downtrend nd reversed, good thing is that downtrend didnt hv big vol compare to the buying vol. I believe its can give 20% up move for a month or 2,, what u people think,, share with me in comment sec.

A DIAMOND top formation on WEEKLY CHART...A diamond top formation is a technical analysis pattern that often occurs at, or near, market tops and can signal a reversal of an uptrend. It is so named because the trendlines connecting the peaks and troughs carved out by the security's price action form the shape of a diamond.
Targets: To calculate the breakout potential for a diamond formation, take the distance between the highest and lowest point in the diamond formation and add it to the breakout point.

JM FINANCIALStock now change its trend
Buy this stock for 6month to 1 year having potential to go upside
Target mentioned in chart
*Do your own analysis

4 Year Downtrend BrokenStock has broken a 4 year downtrend with 4X voumes from 48M to 180M. After Breakout it has come back to retracement levels. Buy at 95.5 for a target of 122

JM FINANCIALHello friends,
Finally Jm financial gives breakout on weekly and dailt chart frame. it looks bullish and can go upto 120 in near future.
One can make long position in it with strict stoploss. Entry above 106. SL - 105. T - 1 = 119 and T2 = approx 150 but it will take time.
Make position as per your risk reward ratio.
This is only for educational purpose, take advice from your financial advisor before taking any position.
Thank you.

JM FINANCIAL BUY CALL JM FINANCIALS looks strong on daily charts. Forming cup and handle pattern in between of channel. BO done at 102 levels. Target 122.9🚀🔥MACD crossover can also be seen.

