Laurus labs Uptrend will continue till the levels of 530Laurus labs will first taret is 440 after breakout of 415 level and after achieving 440 levels it may retrace to the levels of 380-400 and after completing this retracement or consolidation if will take off for the levels of 530.
Trade ideas

LAURUS LAB - UPDATEInitiated buy call at 304 in previous idea. Just following up on chart with revised Stoploss...
370 375 will be crucial levels now for Long position....
Stock has potential to touch 600 before January 2024...

Swing Buy opportunity in Laurus LabsEntry: 389
Target: 417
SL: 378
NOTE: This trade is only for Equity Swing buy and not to be considered for options trading.
Please do follow Position Sizing and Risk Reward Ratio while planning any trades.
Note: This information is for education purpose only and please do your own research and consult your financial advisor prior to taking any action.
TO CONNECT WITH ME CHECK OUT MY BIO.
If you like this Idea, Please do like my ideas and share it with your friends. check my bio.
Please boost my ideas and send cheers as it acts as a motivation to keep posting my analysis.
Thank you

looks bright future lauras lab ascending triangle breakout with flag & pole and volume support on daily chart hiher lows in making

LAURUSLABS : Closed the position at a small lossI initiated my position in the stock on November 17th, 2022. Subsequently, I added to the position on December 2nd and December 20th of the same year. With these additions, the total position accounted for about 2.5% of my capital.
However, the market crash persisted, leading me to close the position for tax loss harvesting on March 31st, 2023, at around 296.30. I then re-entered on April 25th at 295.80, a price lower than my exit point.
Now, I'm selling it off at 398.91, which is 5.88% lower than the average holding value. This trade results in a loss of 5.88%, despite holding the position for approximately 9 months.
Nonetheless, this entire experience provided valuable insights, and I successfully executed tax loss harvesting, making the loss worthwhile.
Currently, I don't plan to re-enter this particular stock in the near future, unless I develop a clear conviction regarding its growth prospects at a more favorable valuation.
During this time, I intend to utilize the capital to engage in better opportunities that I have stronger confidence in, as they arise.

looking for a re entry have took one trade already and now it is again in the range of buying from 350 to 380 for a big target as it has taken bounce from .618 ratio on a longer time frame chart it is now supposed to shake all buyers with wild and sharp down moves until 300 is safe no worries will add on all dips but this will give good up move in my sense in 6/8 months after moving in a range from 320 to 420 for sometime

Laurus Lab is in uptrend but correction till 375 -370 possible. Lauras lab is in uptrend at this point of time correction till 375-370 is possible. Exit will be weekly close below 370. Also, one should check weekly close on Friday after 3 PM when weekly candle is about to complete. After correction next target is 442.

LAURAS LAB - Buying Opportunity After giving sell call between 460 to 490 in December 2022...Now looks like Buying is emerging and stock has potentially bottomed out.
Rounding bottom seems to be in progress now with weekly MACD giving buy signal and daily chart is now moving above short term moving averages...
Buy once closes above 310 with closing basis Stoploss of 280 for medium term target of 450 600 by year end...

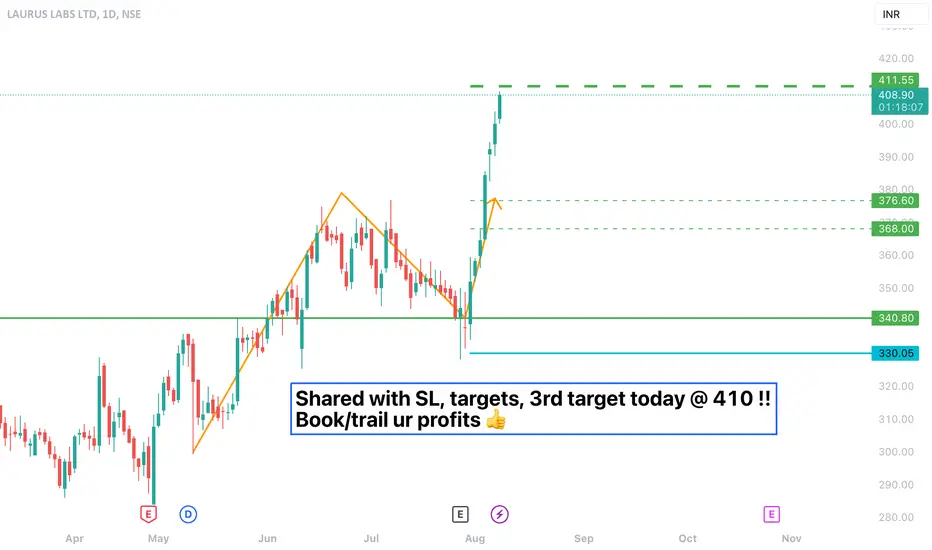
LAURUSLABS 3rd target !!!NSE:LAURUSLABS shared with all the potential levels including SL,
Now trading @ 3rd target today, Enjoy your profits by book or trail ur SL....
lauruslabs expecting up in coming days.LAURUSLABS are already break of 50ema (weekly candle) in uptrendand i think it going towards 450 range nearly 15% up from current point.

Laurus Labs - Swing trade for 10 to 20% upmove.1) Monthly is reversing from major bottom. 61.8% Fibonacci Retracement of the Previous swing.
2) Weekly has just got into an uptrend with 200 EMA close above weekly candle.
3) Daily is also in an uptrend.
Looks good for a target of 440-450, the demand and supply zones are marked, demand zones are good to buy prices and Supply zones are good to sell prices.

Resistance BreakoutPlease look into the chart for a detailed understanding.
Consider these for short-term & swing trades with 2% profit.
For BTST trades consider booking
target for 1% - 2%
For long-term trades look out for resistance drawn above closing.
Please consider these ideas for educational purpose

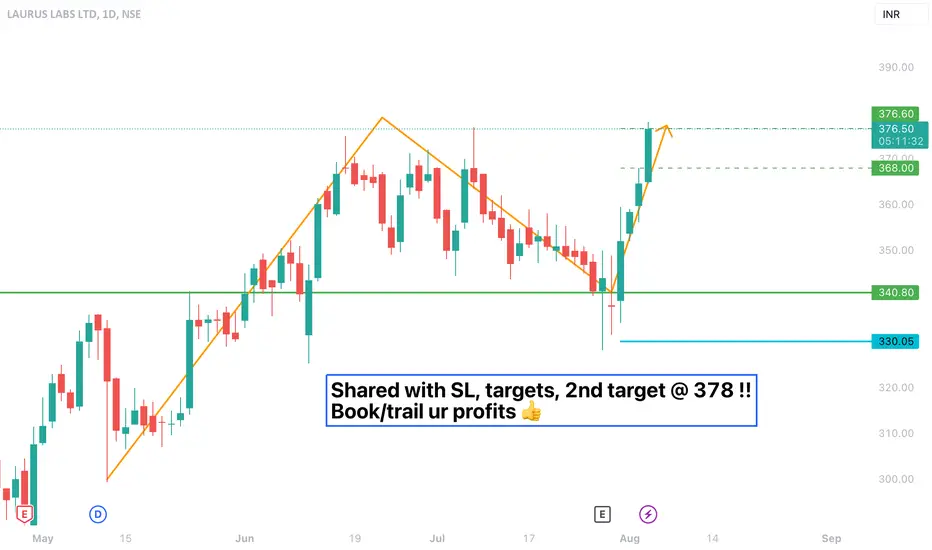
LAURUSLABS 2nd Target 🎯🎯NSE:LAURUSLABS shared @ 350 levels including SL and targets....
now trading @ 2nd target 378 !!
Book your profits and enjoy !!
Attached the previous chart for your easy reference !
Lauruslabs share Big Target 440Laurslabs share plot elliot wave analysis .this stock complete 5 wave upside . 5 wave = 1 wave of impulse big time frame . price start downside 2 wave big time frame . 2 wave internal wave a,b,c complete down side . price again go upside wave 3

$NSE:LAURUSLABS BO retested stock !!NSE:LAURUSLABS successfully given BO and retested, showing very good volumes @ Support zone and running towards target.
Potential targets and SL marked for paper trades !!

LAURUS LAB BUY TRADE FOR JULY FUT
Source : Weekly Demand
Destination : Weekly Supply
Confirmation : Daily
Trade : Daily Demand

Laurus Labs LTd.Laurus Labs Ltd. is in making of rounding bottom (or cup&handle pattern), already crossed 200EMA. Volume is good and RSI is also in positive mood. lets see what happens next. The content provided is for educational and informational purposes only.
PS: It increased during the time I wrote this idea.

📈 Exciting Bullish Pattern Alert! 🐂📊 Pattern: Rising Channel
📌 Symbol/Asset: LAURUS LAB
🔍 Description: Moment Stock with Strong Support
👉 Remember: Technical patterns are just one piece of the puzzle. Consider conducting further research, consulting with a financial advisor, and managing your risks appropriately.

LAURUSLABS Trend line testing on DAILY time frame on LAURUSLABS.
As long as 355 holds, possible to see 365/370 by end of July
#LAURUSLABS

Lauruslab : Good Short and Positional TradeLauruslab : Good Short and Positional Trade
Follow strict SL
PS : Only for learning purpose


LAURUSLABS viewsThis script as disclosed in the chart drawing, seems to have given a good breakout.
Should remain positively biased if breakout sustains above or within the zone.
Important to watch for study.

laurus lab trying to complete bottomsome risk is still there so wait and watch.
need patience to see more development till august.
