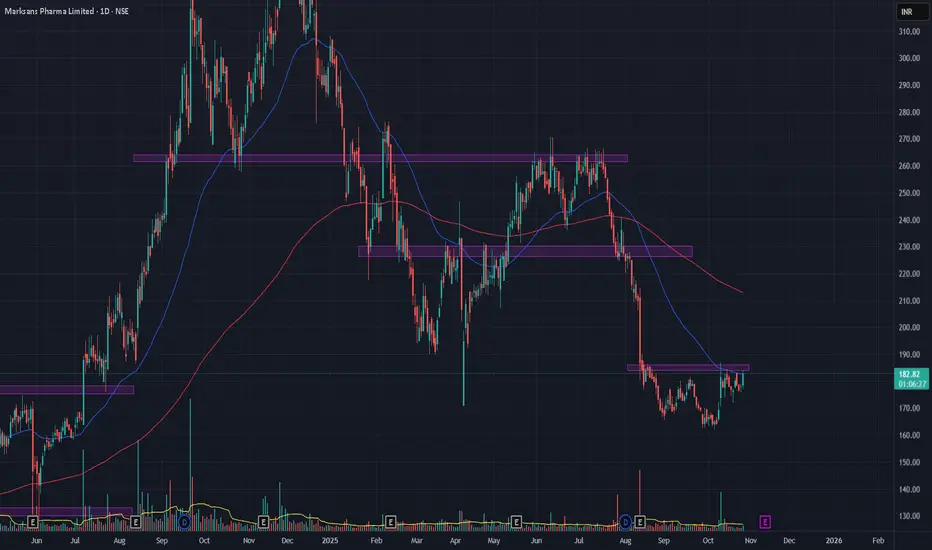
Momentum Building for a Break Above 183This month is about to close with a Bullish Engulfing candle. On the weekly timeframe, a clear W pattern has formed, supported by a bullish RSI divergence, strengthening the bullish outlook. The daily timeframe also reflects a W pattern, and price action is now shaping a pole and flag pattern near t
Marksans Pharma Limited
No trades
Next report date
—
Report period
—
EPS estimate
—
Revenue estimate
—
7.76 INR
3.81 B INR
26.17 B INR
214.46 M
About Marksans Pharma Limited
Sector
Industry
CEO
Mark Bosco Saldanha
Website
Headquarters
Mumbai
Founded
1992
Identifiers
2
ISININE750C01026
Marksans Pharma Ltd. engages in the research, manufacture, marketing, and sale of pharmaceutical formulations. Its product portfolio includes tablets, hard capsules, soft gelatin capsules, oral liquids, and ointments. It operates through the following geographical segments: US and North America, Europe and UK, Australia and New Zealand, India, and Rest of World. The company was founded by Mark Bosco Saldanha on April 16, 1992 and is headquartered in Mumbai, India.
Related stocks
MARKSANS LONG TERM ANALYSISThanks for stopping by.
All analysis here is done strictly from an investor’s perspective — focusing on risk, return, valuation, and potential upside.
The notes cover key details. I’ve backed every thesis with my own analysis — no fluff, just what matters to investors.
If you find the idea useful

MarksansMarksans bounced from longterm support zone. Good fr a positional hold. Expecting ath levels.

50 SMA Rising - Swing TradeDisclaimer: I am not a Sebi registered adviser.
This Idea is publish purely for educational purpose only before investing in any stocks please take advise from your financial adviser.
50 SMA Rising strategy. Suitable for Swing Trading Initial Stop loss lowest of last 2 candles and keep trailing wi

MARKSANS PHARMA LTD S/R Support and Resistance Levels:
Support Levels: These are price points (green line/shade) where a downward trend may be halted due to a concentration of buying interest. Imagine them as a safety net where buyers step in, preventing further decline.
Resistance Levels: Conversely, resistance levels (re

Volume Breakout - Swing TradeDisclaimer: I am not a Sebi registered adviser.
This Idea is publish purely for educational purpose only before investing in any stocks please take advise from your financial adviser.
Volume Breakout. Stock has give Breakout with Volume. Keep in watch list. Buy above the high. Suitable for Swing Tr

Simple trade in marksans!This stock given BO
Pharma presently bullish
Can do swing trade intra as well
Tgt and SL are given for swing trade
this stock is good for swing as far it is above the breakout bar.

Cup And Handle formation in Marksans Pharma on Monthly CandlesA Cup and Handle Pattern seems to be forming in Marksans Pharma on Monthly basis which explains the recent up move.
Good Buying Price would be at 166 (If Someone has bought it at this price can hold it)
Other Buying Opportunity can be Below 260
SL can be marked at 106
Targets Can be
Targe

Trending up!The stock continues to go up, hoping to see new highs given that the company has got approvals from UK/US regulatory. I'm in for a swing 8 to 12% gain in the short term.
I'm not SEBI certified advisor, my posts are just my ideas or my trades I entered in. It may or may not work, I trade with a stri

MARKSANSWeekly Breakout Done.
Accumulation Done.
Huge Volumes.
Good for Short Term.
Do Like ,Comment , Follow for regular Updates...
Keep Learning ,Keep Earning...
Disclaimer : This is not a Buy or Sell recommendation. I am not SEBI Registered. Please consult your financial advisor before making any inv

See all ideas
Summarizing what the indicators are suggesting.
Neutral
SellBuy
Strong sellStrong buy
Strong sellSellNeutralBuyStrong buy
Neutral
SellBuy
Strong sellStrong buy
Strong sellSellNeutralBuyStrong buy
Neutral
SellBuy
Strong sellStrong buy
Strong sellSellNeutralBuyStrong buy
An aggregate view of professional's ratings.
Neutral
SellBuy
Strong sellStrong buy
Strong sellSellNeutralBuyStrong buy
Neutral
SellBuy
Strong sellStrong buy
Strong sellSellNeutralBuyStrong buy
Neutral
SellBuy
Strong sellStrong buy
Strong sellSellNeutralBuyStrong buy
Displays a symbol's price movements over previous years to identify recurring trends.
Frequently Asked Questions
The current price of MARKSANS is 182.00 INR — it has decreased by −2.45% in the past 24 hours. Watch Marksans Pharma Limited stock price performance more closely on the chart.
Depending on the exchange, the stock ticker may vary. For instance, on NSE exchange Marksans Pharma Limited stocks are traded under the ticker MARKSANS.
MARKSANS stock has fallen by −4.05% compared to the previous week, the month change is a −5.32% fall, over the last year Marksans Pharma Limited has showed a −38.04% decrease.
We've gathered analysts' opinions on Marksans Pharma Limited future price: according to them, MARKSANS price has a max estimate of 246.00 INR and a min estimate of 210.00 INR. Watch MARKSANS chart and read a more detailed Marksans Pharma Limited stock forecast: see what analysts think of Marksans Pharma Limited and suggest that you do with its stocks.
MARKSANS reached its all-time high on Dec 2, 2024 with the price of 358.70 INR, and its all-time low was 1.30 INR and was reached on May 18, 2012. View more price dynamics on MARKSANS chart.
See other stocks reaching their highest and lowest prices.
See other stocks reaching their highest and lowest prices.
MARKSANS stock is 2.14% volatile and has beta coefficient of 1.99. Track Marksans Pharma Limited stock price on the chart and check out the list of the most volatile stocks — is Marksans Pharma Limited there?
Today Marksans Pharma Limited has the market capitalization of 84.90 B, it has decreased by −6.42% over the last week.
Yes, you can track Marksans Pharma Limited financials in yearly and quarterly reports right on TradingView.
Marksans Pharma Limited is going to release the next earnings report on Feb 17, 2026. Keep track of upcoming events with our Earnings Calendar.
MARKSANS net income for the last quarter is 982.50 M INR, while the quarter before that showed 583.17 M INR of net income which accounts for 68.48% change. Track more Marksans Pharma Limited financial stats to get the full picture.
Yes, MARKSANS dividends are paid annually. The last dividend per share was 0.80 INR. As of today, Dividend Yield (TTM)% is 0.43%. Tracking Marksans Pharma Limited dividends might help you take more informed decisions.
Marksans Pharma Limited dividend yield was 0.36% in 2024, and payout ratio reached 9.53%. The year before the numbers were 0.40% and 8.67% correspondingly. See high-dividend stocks and find more opportunities for your portfolio.
As of Dec 24, 2025, the company has 1.35 K employees. See our rating of the largest employees — is Marksans Pharma Limited on this list?
EBITDA measures a company's operating performance, its growth signifies an improvement in the efficiency of a company. Marksans Pharma Limited EBITDA is 5.09 B INR, and current EBITDA margin is 20.25%. See more stats in Marksans Pharma Limited financial statements.
Like other stocks, MARKSANS shares are traded on stock exchanges, e.g. Nasdaq, Nyse, Euronext, and the easiest way to buy them is through an online stock broker. To do this, you need to open an account and follow a broker's procedures, then start trading. You can trade Marksans Pharma Limited stock right from TradingView charts — choose your broker and connect to your account.
Investing in stocks requires a comprehensive research: you should carefully study all the available data, e.g. company's financials, related news, and its technical analysis. So Marksans Pharma Limited technincal analysis shows the strong sell today, and its 1 week rating is sell. Since market conditions are prone to changes, it's worth looking a bit further into the future — according to the 1 month rating Marksans Pharma Limited stock shows the neutral signal. See more of Marksans Pharma Limited technicals for a more comprehensive analysis.
If you're still not sure, try looking for inspiration in our curated watchlists.
If you're still not sure, try looking for inspiration in our curated watchlists.