Max Financial Services (MFSL)📈 Technical Analysis Overview:
MFSL witnessed its highest delivery % volume on 09-11-2023, indicating strong market interest. The chart also suggests a breakout based on pattern formation.
📊 Price Levels:
- *Buy Signal:* Initiate a long position on MFSL if it closes above ₹940.25.
- *Stoploss:* Set a stoploss at ₹918.10 (closing basis).
🎯 Profit Targets:
- *1st Target:* Consider booking profits in 50% of the quantity at ₹961.
- *2nd Target:* For the remaining quantity, aim for ₹993.60.
💡 Profit Management Strategy:
Always adapt to price action for profit-taking and safeguarding profits. Be vigilant and consider trailing profits based on market movements.
🚨 Disclaimer:
This analysis is for educational purposes only. I am not SEBI registered. The insights provided here are based on research and are strictly for knowledge and study purposes. Prior to making any trading decisions, seek advice from a certified financial advisor.
Happy Trading! 📊📈
MFSL trade ideas

max financial 1d time frame buy @ 929 target @ 963.50, 973.50, max financial 1d time frame
buy @ 929 target @ 963.50, 973.50, 989.80
channel breakout
risk reward 1.8
its just a view trade @ you own risk
sl@894

Bullish Flag Pattern breakout in MFSLMAX FINANCE SERVICE LTD
Key highlights: 💡⚡
✅On 1Day Time Frame Stock Showing Breakout of Bullish Flag Pattern.
✅ Strong Bullish Candlestick Form on this timeframe.
✅It can give movement up to the Breakout target of 1135+.
✅Can Go Long in this stock by placing a stop loss below 871-.

MFSL_23.08.2023A good entry. This stock is preferred by many F&O players. Very nice trading opportunity. Play Safe.

On the verge of breakout on daily ChartMAX financial is a stock that has been showing signs of a breakout. The stock has been in an uptrend for the past few months, and it has recently broken out above a key resistance level. This is a bullish signal, and it suggests that the stock is likely to continue to rise in the near future.
The whole financial sector is making highs we need to keep a few scripts in radars and focus on taking position carefully with Stop loss on the chart.
Happy trading.

MFSL 1D TIMEFRAME BRACKOUTMFSL 1D TIMEFRAME BRACKOUT
So hello guys this chart is only education perpose only.
this stock chart is MFSL, Stock 4th time touch is resistance level, open your eyes 65 % chances is this week brake this level so lets go level discussed.
Resistance - 862 To 878 brack and next target open.
1st target- 960
2st target- 1065
Support level is 763 to 751
Happy trading

Bullish on MSFL Trend Line BreakoutI am bullish on MSFL becouse trendline breakout and retest is down now stock ready for fly

Mfsl Share Complete Zig Zag correction Weekly chartMfsl share down weekly chart Wave A
Wave A internal 1,2,3,4,5
Any stock ya index first down side complete 5 wave indication Zig Zag Correction .
Wave B bounce can not cross 62 % retracment wave A and again Wave C break low Wave A
Wave c internal 1,2,3,4,5
or Wave B internal a,b,c

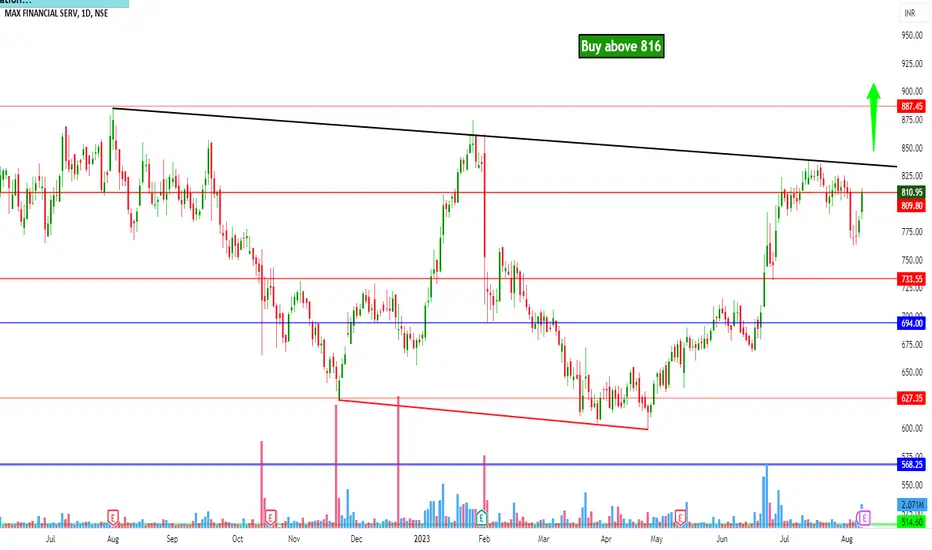
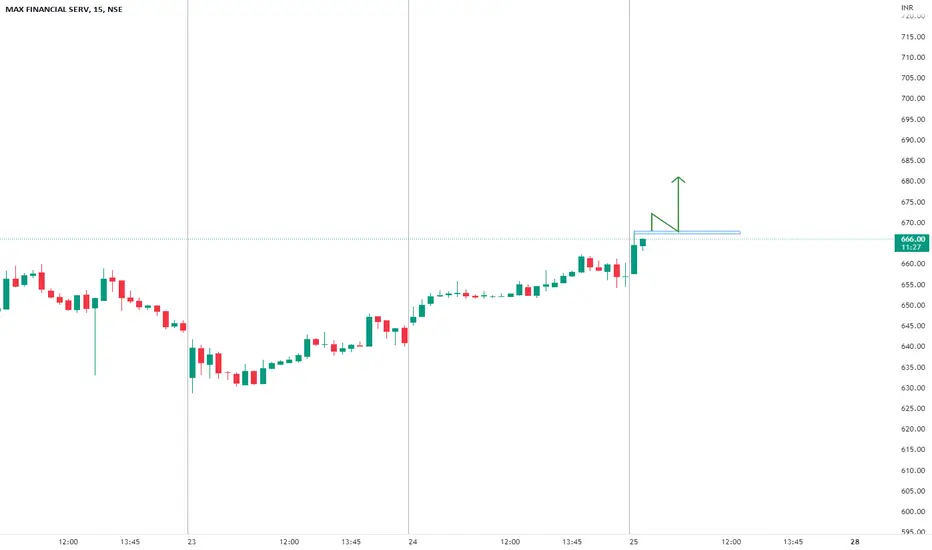
MFSL intraday view for 9th Aug #MFSL MFSL intraday view for 9th Aug #MFSL
Buy entry above 816 sl area around 808
Charts for Educational purposes only.
Strictly follow Risk Reward and Stop Loss if you consider the level
Thanks,
V Trade Point

we are long mfslwe are long in mfsl once it cross 810 with stoploss of 750
expected target - 1200 till 31-dec-2023
its rejection of last year low level and strong up move from the low so our expected target will be new life time high

Strength Gaining Stock! #MFSLStrength Gaining Stock!
Max Financial Services Ltd #MFSL
1- RSI & MACD Divergence
2- High Weekly Volumes
3- Triple Bottom
Note: Technical Analysis is for Educational Purpose. I am not SEBI registered. Consult your financial advisor for any Investment Advice.

MAX FINANCIAL SERVICES LIMITED BEARISH BREAKDOWNMAX FINANCIAL SERVICES LIMITED
Double Top Breakdown\ M Pattern Breakdown at 200 Daily MA.
I expect price to fall.
Entry- around 675
Stop Loss- above 716
Target- 610

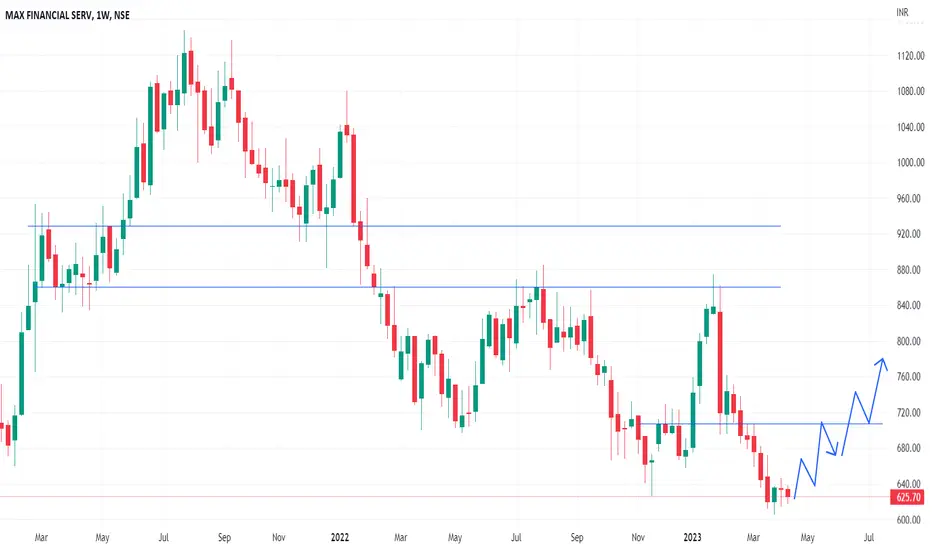
MFSL - Weekly AnalysisIn the Weekly Chart of MFSL ,
we can see that, We might see a recovery in W shape.
Go Long for bigger tergets.
MFSL POSITINAL TARGET @800insurance sector is on fire from last week ,
among insurance stocks i looking towards mfsl is at deep level and expecting 8.50% upside within 8 days,
volume and momentum on chart with fundamental view is looking strong
its my personal view

Max Financial Services Ltd.: W Pattern BreackoutW pattern Breakout on Daily TF...with high volume... next upside move can 808 levels...

MFSL - Bullish Swing ReversalNSE: MFSL is closing with a bullish candle supported with volumes.
Today's volumes and candlestick formation indicates strong demand and stock should move to previous swing highs in the coming days.
The stock has been consolidating for the past few days which is indicating demand.
One can look for a 8% to 13% gain on deployed capital in this swing trade.
The view is to be discarded in the event of the stock breaking previous swing low.
#NSEindia #Trading #StockMarketindia #Tradingview #SwingTrade

Broken wedge patternBroken Major supply zone for long team expected target marked on the chart.
Let's see..
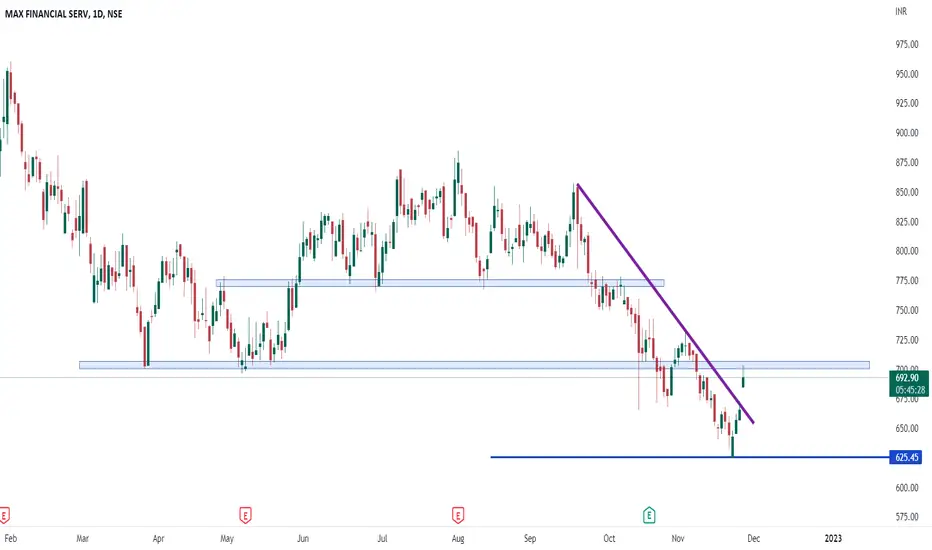
MAX FINANCIAL DAY CHARTMAX FINANCIAL chart breaking it structure in up side when it it down by 39% from its all time high but nthere is resistance zone at 709 zone
MFSL Buy for intraday tradingMFSL Buy for intraday trading if stock break the given resistence.........
Avoid long max fin serv below 862Avoid long below 862
Max fin serv below 862 it can be decline up to 40% to 45% till year closing
Be careful hold any position below this level

MAX Nice breakoutin coming weeks we can see 930 levels in mAX
KEEP sl 625 closing basis
time frame 1 month
