MFSL trade ideas

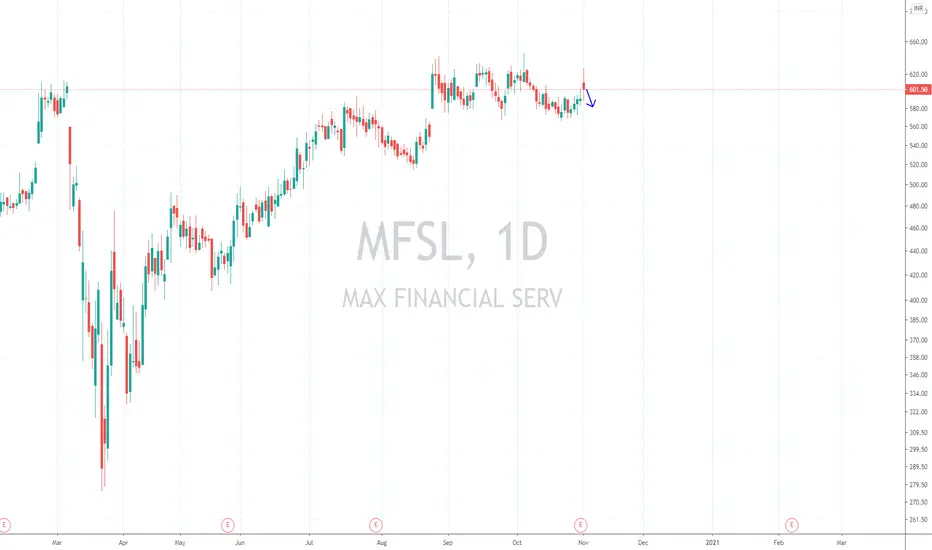
Broken Demand ZoneStock Analysis: MFSL has broken the supply zone as long as the price is not closing above supply zone (marked on red) expect the price to reach the target given on the chart for short term pull back. Let's see
Happy Trading!


MFSLStock has given breakout with good volume
so keep an eye
If you like my idea then please follow me on tradingview

Channel breakout in MFSLChannel breakout in MFSL after longtime, can continue the momentum.
BUY 630-640, SL below 618.

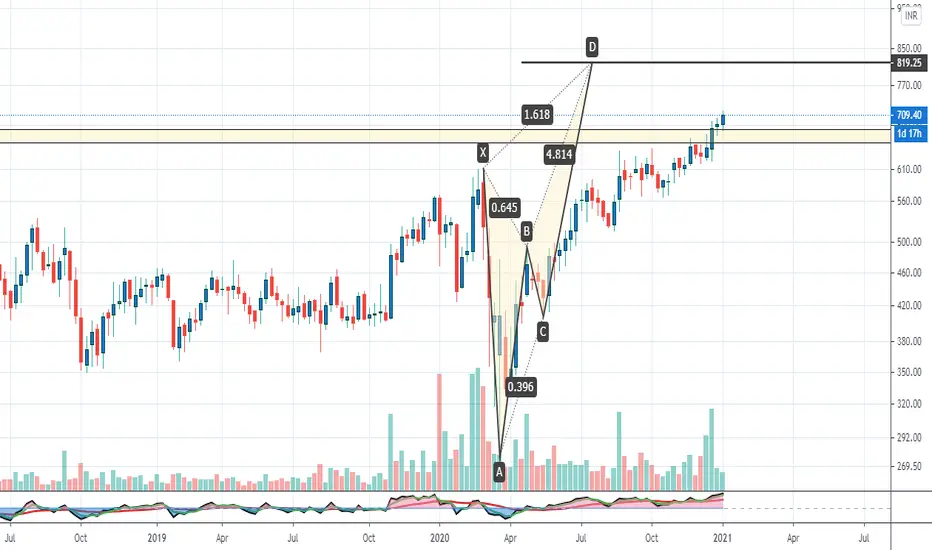
MFSL on the FIB 1.414 ZoneMFSL is on the imp zone. It may still go till 740-750.
IF we find reversal, short is on.
EW Wave count is invalid above 750


MFSL breakout keep in radarMFSL gave breakout and retested buy at cmp or above high.. sl near 620.. target open

Go Long MFSL for MondayStock traiding in a channel. Go long if it breaks the green line and hold till the upper band of the channel.


MFSL - BearishMFSL CMP - 608.30
Looking bearish in higher time frame. One can go for Intraday trade setup with the following entry, exit & targets
Sell at or Below ONLY 606 / Stop Loss 613
Target 1 - 601
Target 2 - 596
Target 3 – 591 / 588
Disclaimer: This is my view and for educational purpose only.

MFSL BUY AND SELL LEVELS - INTRADAY LEVELSMFSL
RISKY BUY ABOVE 625.50
SAFE BUY ABOVE 631
SL BEELOW 6145.50
TARGETS 629/633/640
SELL BELOW 614.50
SL ABOVE 625.50
TARGETS 610/606/602

MFSL - ShortMFSL CMP - 601.50
Looking bearish in higher time frame. One can go for Intraday trade setup with the following entry, exit & targets
Sell at or below ONLY 600 / Stop Loss 607
Target 1 - 595
Target 2 - 590
Target 3 – 585
Disclaimer: This is my view and for educational purpose only.
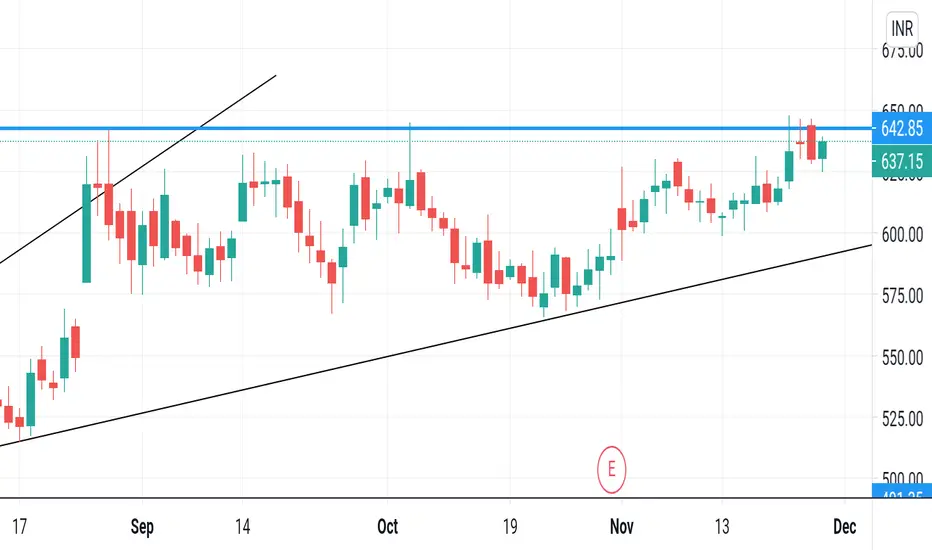
MFSL (In a very tricky space.)There is a lot of talk about in this stock so I will go point wise.
1- The price is forming a triangle at the very crucial area. 642 zone has not been breached for a while and any breach of the same should give a good momentum upward move. A consolidation below a crucial zone gives us more conviction of a convincing breach and continuation. So purely going by the price action theory a breach of either side should give a good momentum move.
2- In you see the RSI indicator, it has been forming a Lower High on the pointed arrows while if you see the green arrow points on the price it has formed a Higher High / Similar High in the same time period at the same points. This is also known as a Bearish divergence. In case the price is not able to breach the triangle tomorrow then it ideally should continue its downtrend and possibly test 566 levels if it is able to breach the lower trend line.
3- A breach of the upside supported by the breach of the blue line on the RSI will negate the theory of Bearish divergence and might support the move of the price going up.
There is a lot to keep in mind in this trade. I have tried to consider every possibility and put it forward. I might be wrong in my analysis but this is the best I know.
Trade with Caution.


