Minda Corp Ltd – Bullish Continuation Setup After ShakeoutNSE:MINDACORP
Minda Corp is setting up for a potential bullish continuation after two back-to-back shakeouts. These shakeouts were followed by strong bullish piercing candles — a clear sign that the selling pressure is being absorbed aggressively by institutional buyers.
📝 Trade Plan:
✍️Entry:
Next report date
—
Report period
—
EPS estimate
—
Revenue estimate
—
11.30 INR
2.55 B INR
50.28 B INR
80.24 M
About Minda Corp. Ltd.
Sector
Industry
CEO
Ashok Minda
Website
Headquarters
Noida
Founded
1985
ISIN
INE842C01021
FIGI
BBG002CX71M5
Minda Corp. Ltd. engages in the manufacture of automotive components. It provides electronic and mechanical security system to two-wheelers, three-wheelers, and off-road vehicles. The firm offers safety, security, and restraint system, driver information telematics system, interior system, and after market products. The company was founded by Shadi Lal Minda on March 11, 1985 and is headquartered in Noida, India.
Related stocks

MINDA CORPORATIONMinda Corporation Ltd. (currently trading at ₹579) is a leading Tier-1 automotive component supplier and flagship of the Spark Minda Group. It operates across safety, security, and electronic systems for two-wheelers, passenger vehicles, and commercial vehicles. With 28 manufacturing facilities acro

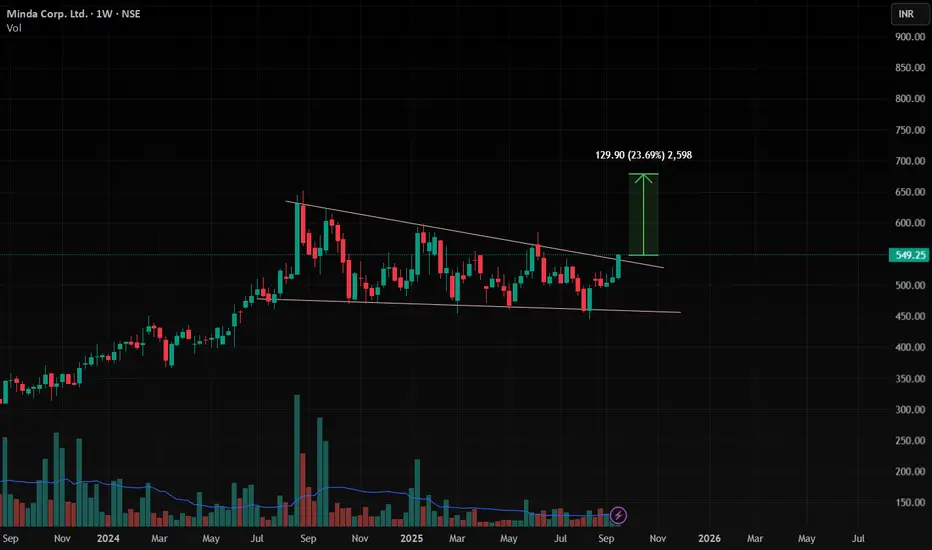
Amazing breakout on WEEKLY Timeframe - MINDACORPCheckout an amazing breakout happened in the stock in Weekly timeframe, macroscopically seen in Daily timeframe. Having a great favor that the stock might be bullish expecting a staggering returns of minimum 25% TGT. IMPORTANT BREAKOUT LEVELS ARE ALWAYS RESPECTED!
NOTE for learners: Place the break
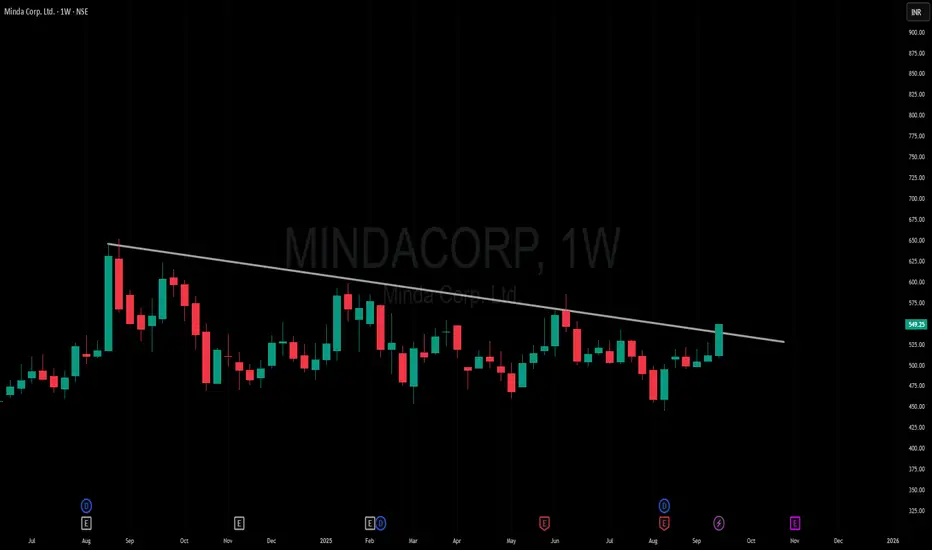
MindaCorp Weekly Breakout In this stock we clearly see the Triangle or Wedge pattern is formed and given Breakout ,we can see very good move up to 25% nearly .
As now nifty is given Breakout from 1D Channel pattern and in Market Breadth 1D has given breakout and in weekly market Breadth it is near the Resistance , if we see
MINDACORPNSE:MINDACORP
Note :
1. One should go long with a Stop Loss, below the Trendline or the Previous Swing Low.
2. Risk :Reward ratio should be minimum 1:2.
3. Plan your trade as per the Money Management and Risk Appetite.
Disclaimer :
>You are responsible for your profits and loss.
>The idea shar

Trendline Support - MINDACORPCurrent Price: ₹550
Technical Analysis:
Trendline Pattern Support taken: The chart indicates that the stock has taken support from a trendline. This is generally a bullish sign, suggesting that the price has found a floor and could potentially rebound or continue its upward trajectory. The chart

Buy Minda corp at 576. Target 1500.Multibagger Buy Minda corporation ltd at 576-555.
long ter target 1500-2000.
only buy if u can digest 40% correction in future .

Minda corporationMind is in sideways, and it forms a zigzag pattern on day closing basis we can put stoploss 459 and try to buy it around 492 to 480 for tgt 652 plus

[Swing Buy] MINDACORP CMP 525 ; BO level - 560 around.Analysis:
Pattern Formation:
The chart shows three distinct lows at approximately the same price level, confirming the triple bottom pattern.
This pattern is a bullish reversal indicator, suggesting that the stock might be moving upward after breaking out from its resistance level.
Breakout Zone:

Minda Corporation looking upside in weekly time frameMinda Corporation looking upside in weekly time frame cmp @521 on 01 jan 2025 .... will see the result ...

See all ideas
Summarizing what the indicators are suggesting.
Neutral
SellBuy
Strong sellStrong buy
Strong sellSellNeutralBuyStrong buy
Neutral
SellBuy
Strong sellStrong buy
Strong sellSellNeutralBuyStrong buy
Neutral
SellBuy
Strong sellStrong buy
Strong sellSellNeutralBuyStrong buy
An aggregate view of professional's ratings.
Neutral
SellBuy
Strong sellStrong buy
Strong sellSellNeutralBuyStrong buy
Neutral
SellBuy
Strong sellStrong buy
Strong sellSellNeutralBuyStrong buy
Neutral
SellBuy
Strong sellStrong buy
Strong sellSellNeutralBuyStrong buy
Displays a symbol's price movements over previous years to identify recurring trends.
MOSMALL250
Motilal Oswal Nifty Smallcap 250 ETF Units Exchange Traded FundWeight
0.22%
Market value
31.45 K
USD
MULTICAP
Mirae Asset Nifty500 Multicap 502525 ETF Exchange Traded Fund UnitsWeight
0.05%
Market value
3.16 K
USD
Explore more ETFs
Frequently Asked Questions
The current price of MINDACORP is 581.40 INR — it has decreased by −0.69% in the past 24 hours. Watch Minda Corp. Ltd. stock price performance more closely on the chart.
Depending on the exchange, the stock ticker may vary. For instance, on NSE exchange Minda Corp. Ltd. stocks are traded under the ticker MINDACORP.
MINDACORP stock has risen by 1.06% compared to the previous week, the month change is a 0.02% rise, over the last year Minda Corp. Ltd. has showed a 10.32% increase.
We've gathered analysts' opinions on Minda Corp. Ltd. future price: according to them, MINDACORP price has a max estimate of 746.00 INR and a min estimate of 570.00 INR. Watch MINDACORP chart and read a more detailed Minda Corp. Ltd. stock forecast: see what analysts think of Minda Corp. Ltd. and suggest that you do with its stocks.
MINDACORP reached its all-time high on Aug 26, 2024 with the price of 652.00 INR, and its all-time low was 4.50 INR and was reached on Jun 13, 2012. View more price dynamics on MINDACORP chart.
See other stocks reaching their highest and lowest prices.
See other stocks reaching their highest and lowest prices.
MINDACORP stock is 4.72% volatile and has beta coefficient of 0.92. Track Minda Corp. Ltd. stock price on the chart and check out the list of the most volatile stocks — is Minda Corp. Ltd. there?
Today Minda Corp. Ltd. has the market capitalization of 138.98 B, it has decreased by −0.83% over the last week.
Yes, you can track Minda Corp. Ltd. financials in yearly and quarterly reports right on TradingView.
Minda Corp. Ltd. is going to release the next earnings report on Feb 5, 2026. Keep track of upcoming events with our Earnings Calendar.
MINDACORP net income for the last quarter is 846.40 M INR, while the quarter before that showed 653.10 M INR of net income which accounts for 29.60% change. Track more Minda Corp. Ltd. financial stats to get the full picture.
Minda Corp. Ltd. dividend yield was 0.26% in 2024, and payout ratio reached 12.90%. The year before the numbers were 0.33% and 14.50% correspondingly. See high-dividend stocks and find more opportunities for your portfolio.
As of Dec 9, 2025, the company has 18 K employees. See our rating of the largest employees — is Minda Corp. Ltd. on this list?
EBITDA measures a company's operating performance, its growth signifies an improvement in the efficiency of a company. Minda Corp. Ltd. EBITDA is 6.31 B INR, and current EBITDA margin is 11.04%. See more stats in Minda Corp. Ltd. financial statements.
Like other stocks, MINDACORP shares are traded on stock exchanges, e.g. Nasdaq, Nyse, Euronext, and the easiest way to buy them is through an online stock broker. To do this, you need to open an account and follow a broker's procedures, then start trading. You can trade Minda Corp. Ltd. stock right from TradingView charts — choose your broker and connect to your account.
Investing in stocks requires a comprehensive research: you should carefully study all the available data, e.g. company's financials, related news, and its technical analysis. So Minda Corp. Ltd. technincal analysis shows the sell today, and its 1 week rating is buy. Since market conditions are prone to changes, it's worth looking a bit further into the future — according to the 1 month rating Minda Corp. Ltd. stock shows the buy signal. See more of Minda Corp. Ltd. technicals for a more comprehensive analysis.
If you're still not sure, try looking for inspiration in our curated watchlists.
If you're still not sure, try looking for inspiration in our curated watchlists.