Nifty Weekly Analysis Learning PurposeNifty given breakout at demand zone & achieved target as expected, now the market might retrace & will for long direction in coming days probability 70%
NIFTY2! trade ideas

NIFTYNifty levels are based on imbalances
1. gapup 25080 long
2. 25100-24900 trade breakout
3. gapdown 24900 short

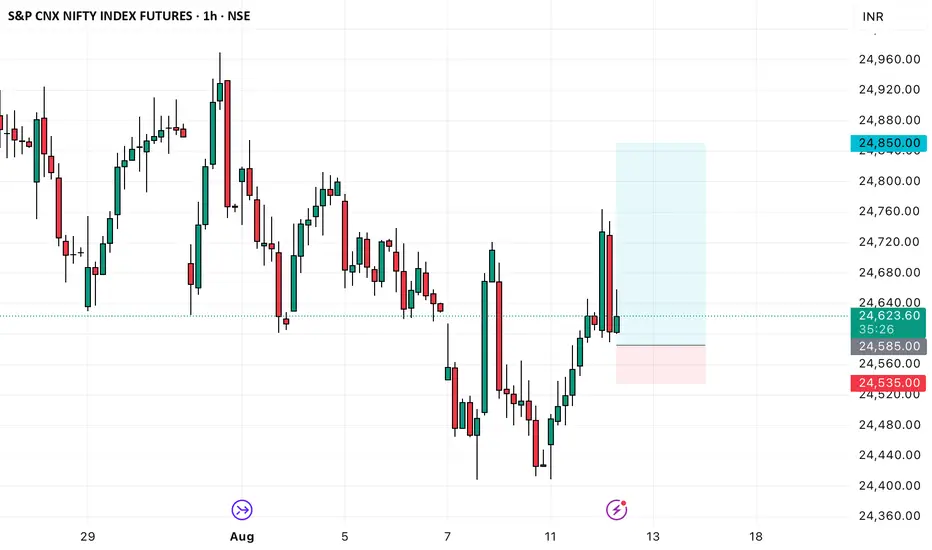
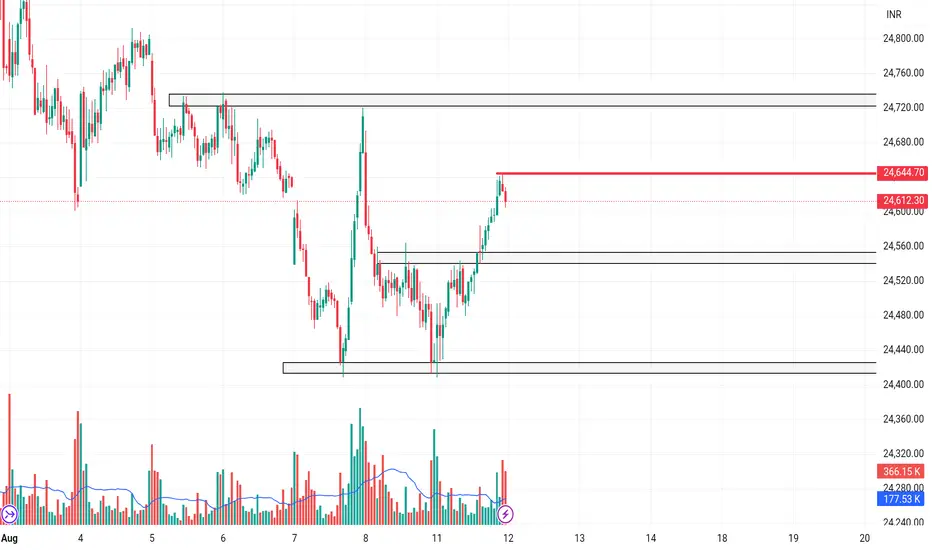
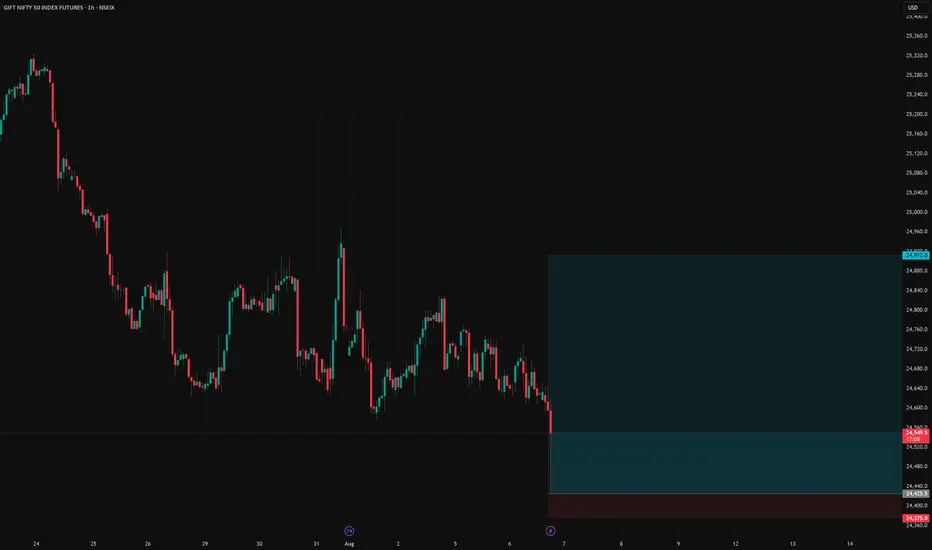
NF FUT long setupNF FUT long setup
Entry - 24585
Stop loss - 24529
Target - 24942
Risk Reward - 1:6.3
15th Of August 2025- Independence-Day.Happy Independence Day
To all !!!
Start of the Month of August Market is in the Expected range for the Week/Fortnite/month
traders sold the volatility managed to capture 2 weeks of option Decay... good way to make 2% in a week
Thank you
safety first!

NIFTYNifty levels are based on imbaalances
1.gapup 24750 long
2. 24750-24625 trade breakout
3. gapdow n 24625 short

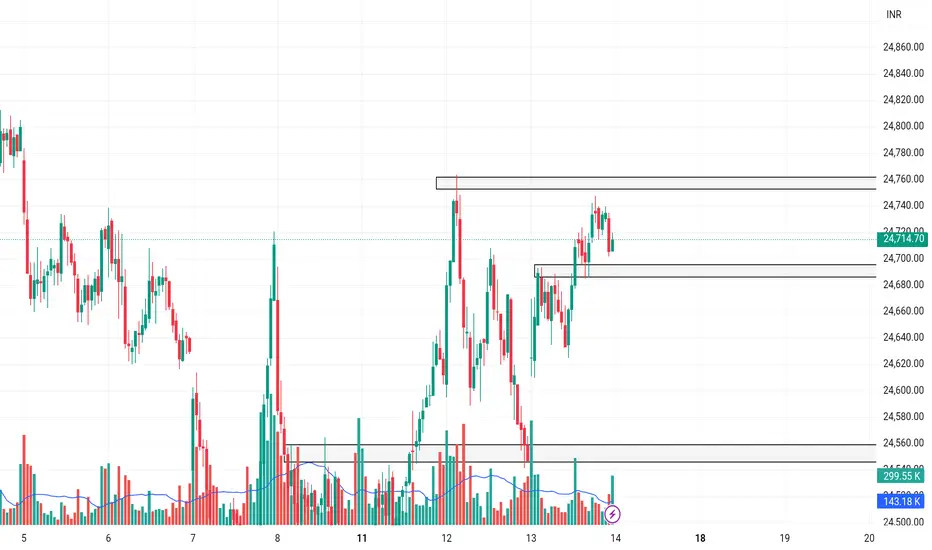
NIFTYNifty levels are based on imbalances
1. gaapup 24760 long
2. 24760-24700 trade breakout
3. gapdown 24700 short
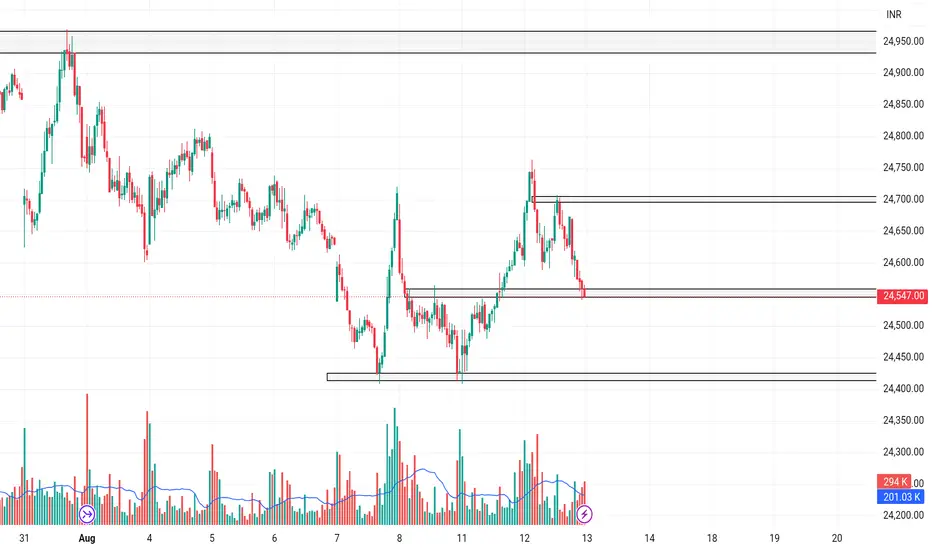
NIFTYNifty levels are based on imbalances
1. gapup 24700 long
2. 24700-24550 trade breakout
3. gapdown 24550 short
Nifty Analysis From 28th July to 11 AugRetracement completed Need confirmation for Upside, 12th Aug if give confirmation can plan for trade up to 25000

NIFTYNifty levels are based on imbalances
1. gapup 24650 long
2. 24650-24550 trade breakout
3. gapdown 24550 short
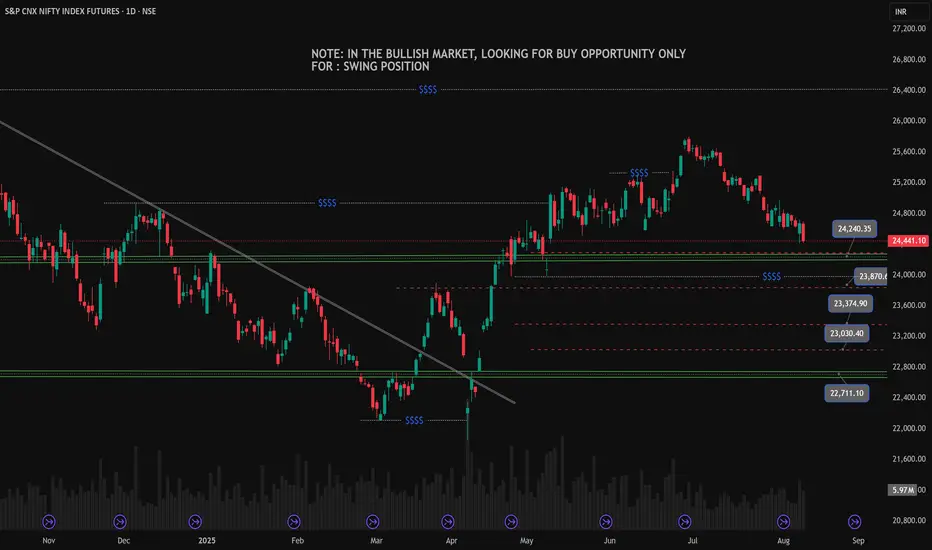
Nifty Weekly Complete Analysis (10.08.2025)the market looks bulish in the long term and short time period looks stlightly bearsh sideways for correction point of view and maybe the sideways market contineus about 18 months approx this is one of the posibility only anything can happen in the market so very cautious about the view i am very aware of market changes so done hope on anything alway flexible to change the views and in this chart note the levels as the price reaction and plan accordinly to these levels.
NIFTYNifty levels are based on imbalances
1`. gapup 24560 long
2. 24560-24400 trade bfreakout
3. gapdown 24400 short
Nifty 50. Weekly Outlook 10.08.2025, SundayExpecting another push towards the downside on Nifty 50 index. Equal lows looks intact

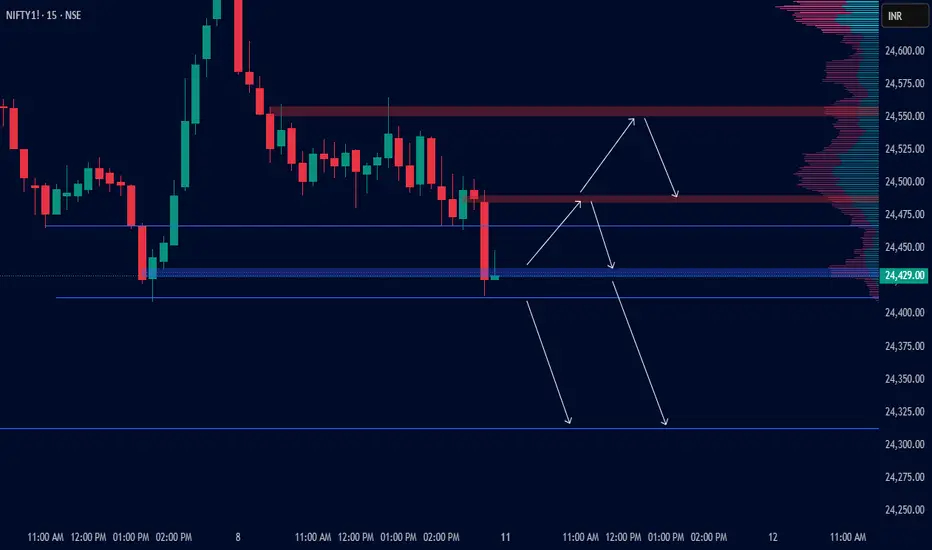
Intraday Plan for Monday 11 AugustTrade Plan – NIFTY FUTURE 15-Min Chart
Current Context:
Price is trading near a key demand/support zone around 24,400 -24,420. (blue zone)
There’s visible selling pressure from the recent swing high, but we’re at an important decision area where a bounce or breakdown can occur.
Volume profile shows high activity near 24,500 and 24,440 zones.
Possible Scenarios:
Bullish Scenario (Reversal / Pullback Play)
If price holds above 24,420 and shows strong bullish candles, look for a pullback entry toward 24,440.
First target: 24,480 supply zone
Second target: 24,500–24,520 high volume node / strong resistance
Watch for rejection at these levels for profit booking.
Alternate Bullish Continuation
If price quickly reclaims 24,480 supply zone with momentum, expect a rally toward 24,520–24,560.
This would require strong buying interest.
Bearish Scenario (Breakdown Play)
If price breaks below 24,400/420 with strong volume, expect a continuation toward 24,380, then 24,340–24,320.
Look for short entries on pullbacks to broken support.
Key Levels
Support: 24,420 → 24,380 → 24,340–24,320
Resistance: 24,440 → 24,480 → 24,500–24,520
Scenarios
Bullish Bounce – Hold above 24,420 → Target 24,480 / 24,520
Bearish Breakdown – Break below 24,420 → Target 24,380 / 24,340 / 24,320
Strong Bullish Continuation – Break & sustain above 24,480 → Target 24,520–24,560
Disclaimer:
This trade plan is for educational purposes only and does not constitute financial or investment advice. Trading in the stock market involves substantial risk, including the risk of loss. Always conduct your own research and consult with a qualified financial advisor before making trading decisions. You are solely responsible for your own trades and risk management.
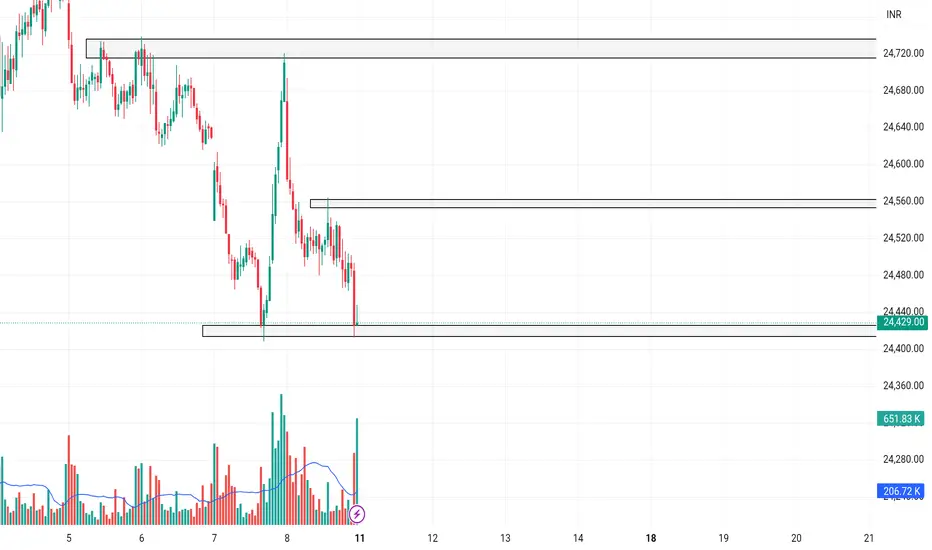
GIFT NIFTY long setupGift NIFTY long setup
Entry price - 24425.5
Stop loss - 24375
Target - 24912
Risk Reward - 1:9.6
Intraday set up for 7th August 2025 Nifty future and banknifty future analysis and intraday plan.
Quarterly results.
This video is for information/education purpose only. you are 100% responsible for any actions you take by reading/viewing this post.
please consult your financial advisor before taking any action.
----Vinaykumar hiremath, CMT

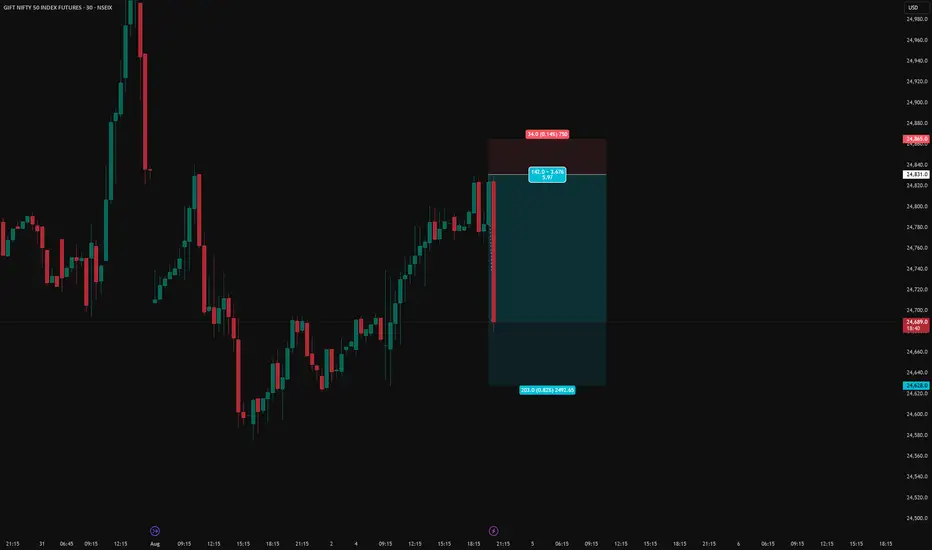
GIFT NIFTY short setupGIFT NIFTY short setup
Entry - 24831
SL - 24865
Target - 24628.0
Risk Reward - Approx 1:6
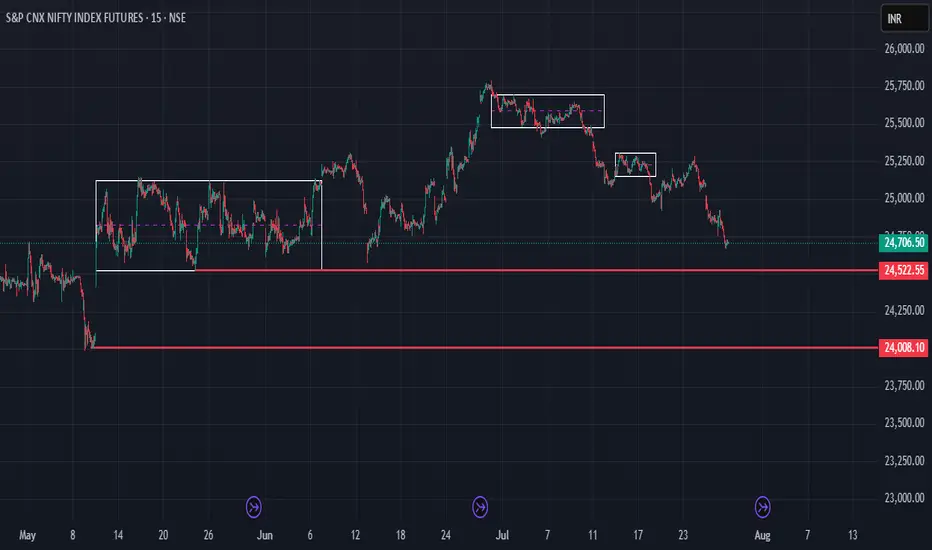
GIFT NIFTY @ 24683 ANALYSIS 04-AUG-2025: BIGGER PICTURESupports: 24577/24421/24234
Resistances: 24970/25325/24639/24800
As long as the above support levels hold, we can see big bull run towards 27500 first.
Targets: 25855, 26655, 27577
27934-28770
29234
30000-30500-31350
On the downside, if break 24421/24234, we can see 23800, 23355, 23000.


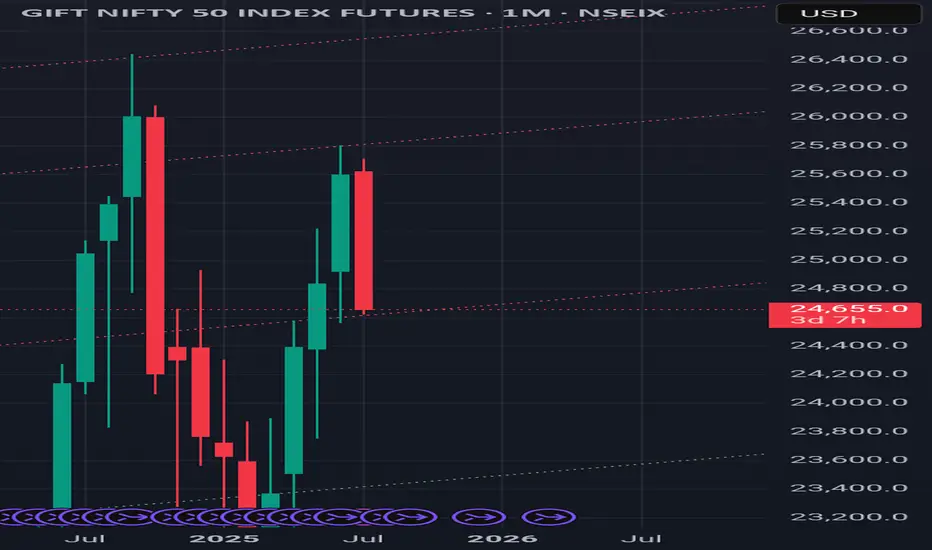
"Nifty # Stock Market # Bullish View""Nifty’s bearish move looks like a time correction — gearing up for a powerful rally towards 27,000! 📈🚀 #Nifty #StockMarket #BullishView"
I think it's today.I admit that today's Nifty surpassed below yesterday's 24800 level, and my rash assumption that this level would act as a strong reversal support was wrong. But my overall opinion hasn't changed: there's a good chance the market will correct this whole wave 1 decline if the GIFT Nifty support level of 25620 isn't broken by tomorrow.
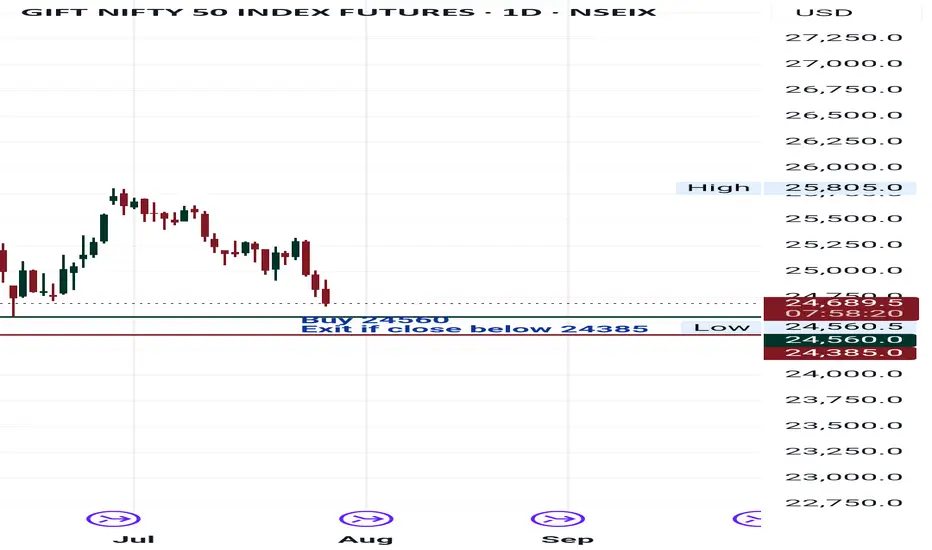
Buy gift nifty at support levelBuy at 24560 (many times support range), calculation point also with wave pattern.
Try to exit, if close below 24385.
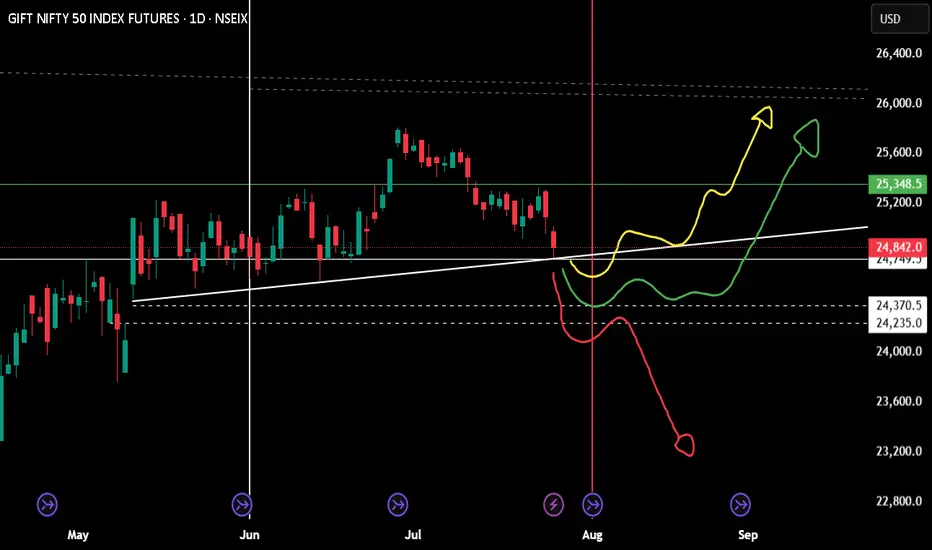
Monthly position for niftyExpecting a reversal, yes geo political and 1st August announcement will play a major role.
just wait for one day candle closing on your area.
If you wish to be on buying side (buy nifty future) a positive candle on top of the trend line.
Selling future for the month is only wise if 24k is crossed. Technically a bounce is expected and hopefully a green candle for August month.
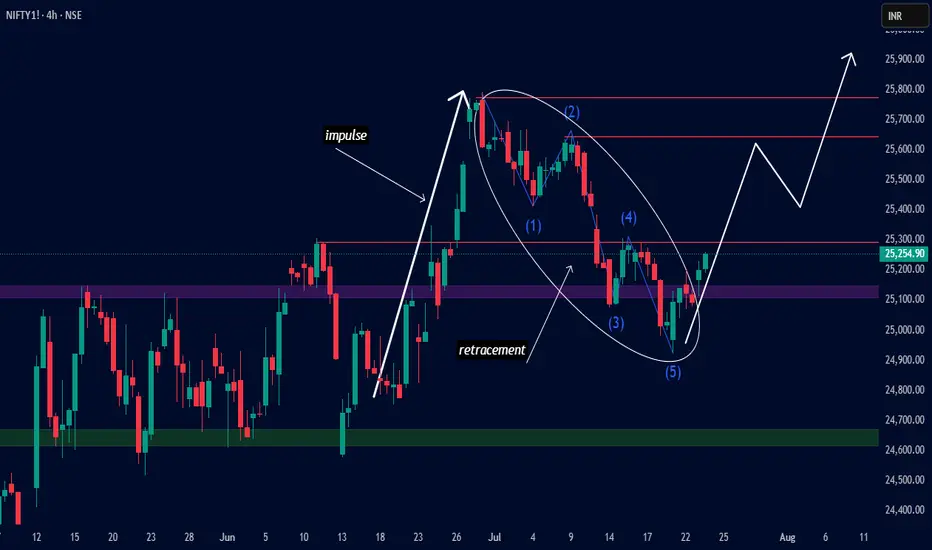
NIFTY 4H – Impulse & Retracement Complete | Bullish Move Ahead?Hello friends this is nifty futures chart
The recent 5-wave corrective structure (Elliott Wave) seems to have completed near the Flip Zone, with Wave (5) marking a potential bullish reversal point.
Key Observations:
Strong impulse move followed by a 5-wave retracement
Price reversed from previous accumulation zone
Structure suggests a potential bullish continuation
Targeting zone near 25,800–25,900
Let’s see if the bulls can take control from here! 🐂