ONGC is on good place , keep eyesONGC is on good place , sector is also good . Keep an eye on this stock
Next report date
—
Report period
—
EPS estimate
—
Revenue estimate
—
29.04 INR
362.26 B INR
6.12 T INR
3.87 B
About Oil & Natural Gas Corp. Ltd.
Sector
Industry
CEO
Arun Kumar Singh
Website
Headquarters
New Delhi
Founded
1956
ISIN
INE213A01029
FIGI
BBG000BF0CY9
Oil and Natural Gas Corporation Limited is a global energy holding company. The Company is engaged in the exploration, development and production of crude oil and natural gas. The Company's segments include Exploration & Production (E&P), and Refining. The Company's geographical segments include operations in two categories: In India, which includes Onshore and Offshore, and Outside India. The Company's business spread include various areas, such as oil field services, transportation of the oil and natural gas, and production of value-added products, such as Liquefied Petroleum Gas (LPG), Naphtha, Refining, Petrochemicals, Power, unconventional and alternate sources of energy. The Company's subsidiaries include ONGC Videsh Limited (OVL), Mangalore Refinery and Petrochemicals Limited (MRPL) and ONGC Mangalore Petrochemicals Limited. The Company's oil and gas reserves are located internationally at Russia, Colombia, Vietnam, Brazil and Venezuela.
Related stocks

ONGC - various Levels - 280 -293ONGC on the technical analysis has the potential to hit the levels of 280 or even 293.
However , there is potential chances to the stock moving towards the levels of 207 0r even 189. These supports are major and expected to push the stock back to the levels of 230.

ONGC looks positive on weekly chartONGC, after forming a consolidation on weekly time frame, as well as EMA's formation is indicating a good upside movement from the current level.
Current level is 252, I am expecting a 20% upside move from here

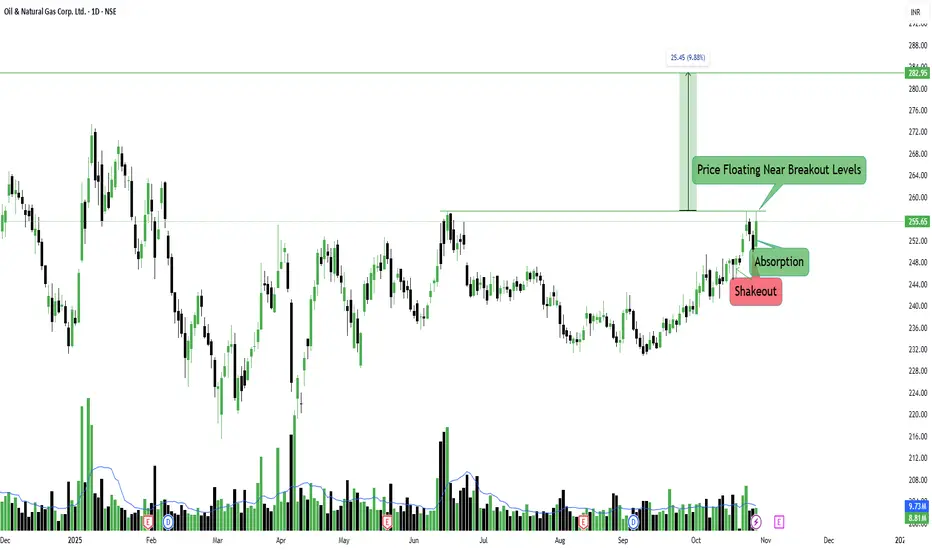
ONGC Ltd – Breakout Retest in ProgressONGC Ltd – Breakout Retest in Progress
NSE:ONGC
📈 Pattern & Setup:
ONGC has been showing a consistent bullish structure with higher lows and a breakout attempt above the key resistance zone around 254–256. The recent breakout candle was supported by a healthy volume spike, signaling genuine b
ONGC --accumulation zoneHead and shoulder complex formation in progress . once breakouts will target280-90 level .Accumulation going on some great news in making .

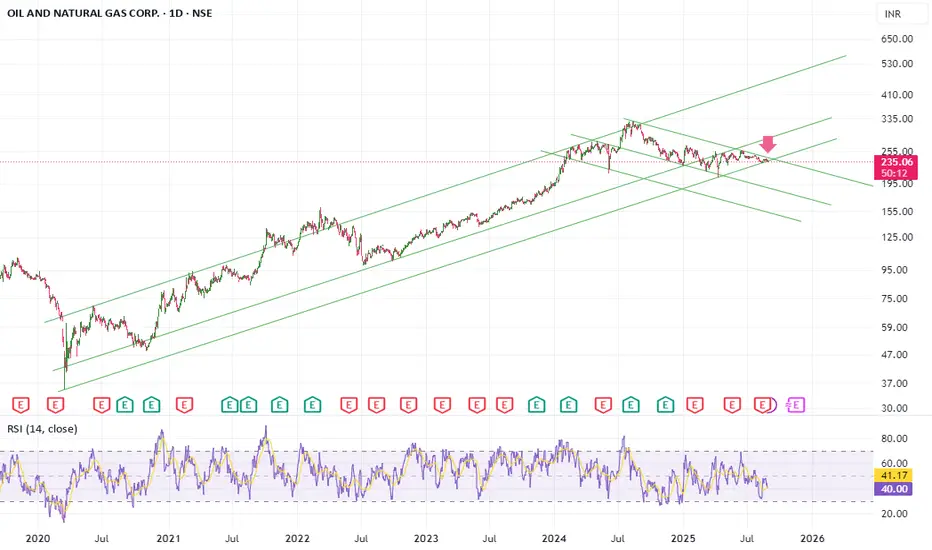
ONGCTrend:
From 2020 lows (~₹50), ONGC rallied sharply to ~₹345 (2022 peak).
Since then, it has been in a corrective downtrend, now stabilizing near ₹205–₹230.
Still inside a rising channel (support & resistance lines drawn).
Support Levels:
Strong support near ₹200–205 (trendline + horizontal leve

ONGC BuyONGC seems to take support at its channel bottom. Buy @CMP (243.5) with SL of 240 and target of 255.

about to break its long time channel if we are looking it on weekly frame at rsi , it is in red zone now , and even it is on resistance as well , red zone

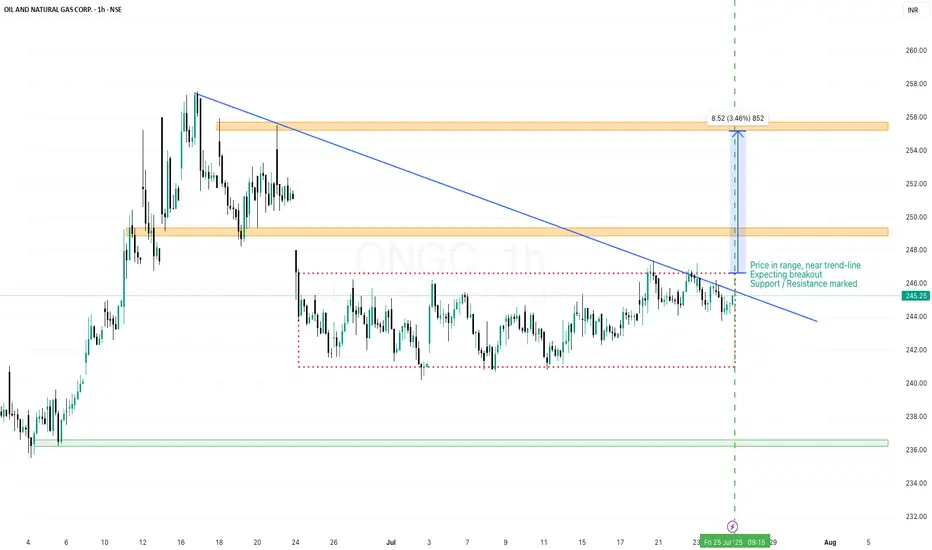
ONGC - Time to breakout from the Darvas boxONGC has been consolidating within Darvas box in recent days and nearing trend-line. We can expect breakout when trend line breaks. Nearest Support & Resistance marked for Target levels
See all ideas
Summarizing what the indicators are suggesting.
Neutral
SellBuy
Strong sellStrong buy
Strong sellSellNeutralBuyStrong buy
Neutral
SellBuy
Strong sellStrong buy
Strong sellSellNeutralBuyStrong buy
Neutral
SellBuy
Strong sellStrong buy
Strong sellSellNeutralBuyStrong buy
An aggregate view of professional's ratings.
Neutral
SellBuy
Strong sellStrong buy
Strong sellSellNeutralBuyStrong buy
Neutral
SellBuy
Strong sellStrong buy
Strong sellSellNeutralBuyStrong buy
Neutral
SellBuy
Strong sellStrong buy
Strong sellSellNeutralBuyStrong buy
Displays a symbol's price movements over previous years to identify recurring trends.
O
858OPAL29
ONGC Petro Additions Limited 8.58% 09-NOV-2029Yield to maturity
6.87%
Maturity date
Nov 9, 2029
O
RPIN4398733
ONGC Videsh Vankorneft Pte. Ltd. 3.75% 27-JUL-2026Yield to maturity
4.43%
Maturity date
Jul 27, 2026
RPIN4933146
Oil and Natural Gas Corporation Limited 3.375% 05-DEC-2029Yield to maturity
4.43%
Maturity date
Dec 5, 2029
64ONGC31
Oil and Natural Gas Corporation Limited 6.4% 11-APR-2031Yield to maturity
—
Maturity date
Apr 11, 2031
See all ONGC bonds
Curated watchlists where ONGC is featured.

Indian stocks: Racing ahead
46 No. of Symbols

Upstream oil: Liquid gold extractors
34 No. of Symbols
See all sparks
Frequently Asked Questions
The current price of ONGC is 243.54 INR — it has decreased by −0.53% in the past 24 hours. Watch Oil & Natural Gas Corp. Ltd. stock price performance more closely on the chart.
Depending on the exchange, the stock ticker may vary. For instance, on NSE exchange Oil & Natural Gas Corp. Ltd. stocks are traded under the ticker ONGC.
ONGC stock has fallen by −0.90% compared to the previous week, the month change is a −4.38% fall, over the last year Oil & Natural Gas Corp. Ltd. has showed a −4.68% decrease.
We've gathered analysts' opinions on Oil & Natural Gas Corp. Ltd. future price: according to them, ONGC price has a max estimate of 330.00 INR and a min estimate of 200.00 INR. Watch ONGC chart and read a more detailed Oil & Natural Gas Corp. Ltd. stock forecast: see what analysts think of Oil & Natural Gas Corp. Ltd. and suggest that you do with its stocks.
ONGC reached its all-time high on Aug 13, 2024 with the price of 345.00 INR, and its all-time low was 10.57 INR and was reached on May 9, 2000. View more price dynamics on ONGC chart.
See other stocks reaching their highest and lowest prices.
See other stocks reaching their highest and lowest prices.
ONGC stock is 1.55% volatile and has beta coefficient of 1.11. Track Oil & Natural Gas Corp. Ltd. stock price on the chart and check out the list of the most volatile stocks — is Oil & Natural Gas Corp. Ltd. there?
Today Oil & Natural Gas Corp. Ltd. has the market capitalization of 3.08 T, it has decreased by −1.04% over the last week.
Yes, you can track Oil & Natural Gas Corp. Ltd. financials in yearly and quarterly reports right on TradingView.
Oil & Natural Gas Corp. Ltd. is going to release the next earnings report on Feb 9, 2026. Keep track of upcoming events with our Earnings Calendar.
ONGC earnings for the last quarter are 8.58 INR per share, whereas the estimation was 7.42 INR resulting in a 15.71% surprise. The estimated earnings for the next quarter are 6.25 INR per share. See more details about Oil & Natural Gas Corp. Ltd. earnings.
Oil & Natural Gas Corp. Ltd. revenue for the last quarter amounts to 1.58 T INR, despite the estimated figure of 327.16 B INR. In the next quarter, revenue is expected to reach 1.81 T INR.
ONGC net income for the last quarter is 107.85 B INR, while the quarter before that showed 98.04 B INR of net income which accounts for 10.00% change. Track more Oil & Natural Gas Corp. Ltd. financial stats to get the full picture.
Oil & Natural Gas Corp. Ltd. dividend yield was 4.97% in 2024, and payout ratio reached 42.54%. The year before the numbers were 4.57% and 31.36% correspondingly. See high-dividend stocks and find more opportunities for your portfolio.
As of Dec 2, 2025, the company has 25.32 K employees. See our rating of the largest employees — is Oil & Natural Gas Corp. Ltd. on this list?
EBITDA measures a company's operating performance, its growth signifies an improvement in the efficiency of a company. Oil & Natural Gas Corp. Ltd. EBITDA is 1.09 T INR, and current EBITDA margin is 16.58%. See more stats in Oil & Natural Gas Corp. Ltd. financial statements.
Like other stocks, ONGC shares are traded on stock exchanges, e.g. Nasdaq, Nyse, Euronext, and the easiest way to buy them is through an online stock broker. To do this, you need to open an account and follow a broker's procedures, then start trading. You can trade Oil & Natural Gas Corp. Ltd. stock right from TradingView charts — choose your broker and connect to your account.
Investing in stocks requires a comprehensive research: you should carefully study all the available data, e.g. company's financials, related news, and its technical analysis. So Oil & Natural Gas Corp. Ltd. technincal analysis shows the sell today, and its 1 week rating is neutral. Since market conditions are prone to changes, it's worth looking a bit further into the future — according to the 1 month rating Oil & Natural Gas Corp. Ltd. stock shows the buy signal. See more of Oil & Natural Gas Corp. Ltd. technicals for a more comprehensive analysis.
If you're still not sure, try looking for inspiration in our curated watchlists.
If you're still not sure, try looking for inspiration in our curated watchlists.