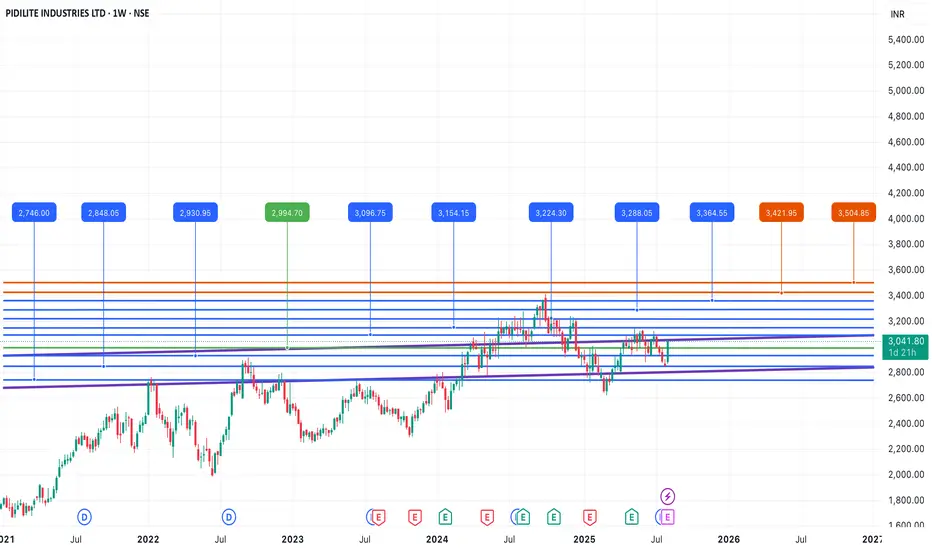
PIDILITE SHORT TO MID-TERM ANALYSISPidilite is looking positive for the short to mid-term , currently trading at 3041. This is a crucial range, and if Pidilite successfully crosses and sustains above 3100-3150, then we can expect a rally to continue up to 3420-3500 levels. On the downside, if Pidilite breaches 2994-2930, then we can
Next report date
—
Report period
—
EPS estimate
—
Revenue estimate
—
21.90 INR
20.76 B INR
131.23 B INR
321.75 M
About Pidilite Industries Limited
Sector
Industry
CEO
Bharat Tilakraj Puri
Website
Headquarters
Mumbai
Founded
1959
ISIN
INE318A01026
FIGI
BBG000CXTJJ0
Pidilite Industries Ltd. engages in the manufacture and sale of adhesives and glues. It operates through the following segments: Consumer and Bazaar, Business to Business, and Others. The Consumer and Bazaar Products segment consists of adhesives, sealants, art and craft materials, and construction and paint chemicals. The Business to Business segment represents adhesives, synthetic resins, organic pigments, pigment preparations, construction chemicals, surfactants.The Others segment includes sale of raw materials. The company was founded by Balvantray Kalyanji Parekh in 1959 and is headquartered in Mumbai, India.
Related stocks
#PIDILITINDDate: 08-07-2025
#PIDILITIND Current Price: 3066
Pivot Point: 3075.60 Support: 3011.17 Resistance: 3140.52
#PIDILITIND Upside Targets:
Target 1: 3206.66
Target 2: 3272.80
Target 3: 3346.75
#PIDILITIND Downside Targets:
Target 1: 2944.78
Target 2: 2878.40
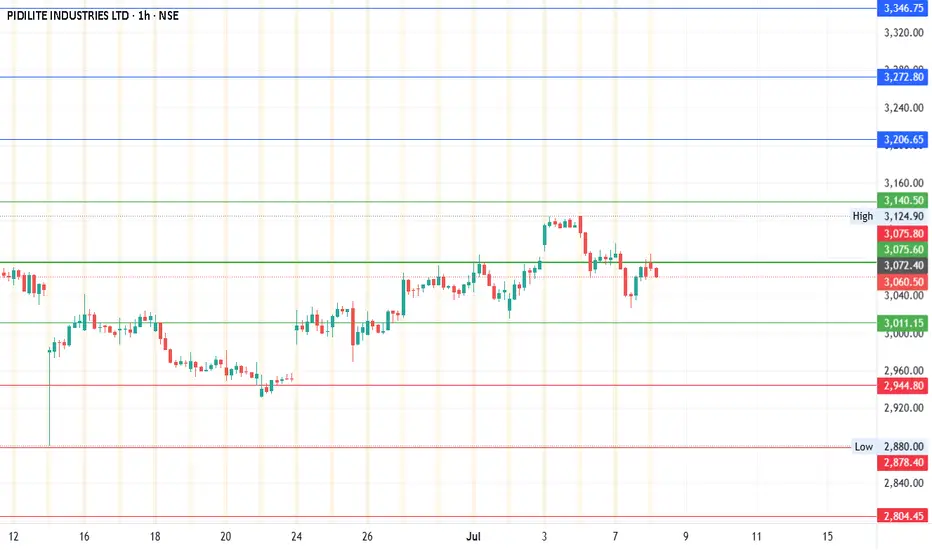
PIDILITIND Swing trade viewH1 trend is bullish. After BOS (break of structure), H1 candles have completed Fibonacci 80% retracement and formed bullish engulfing candlestick pattern on the high probable demand zone.
So, the structure is indicating very good bullish signal for long entry.

be cuation in pidilitind most imp level 3135pidilitind most imp level 3135 if in any condition it fail to hold abv this level we can see sharp fall up to our next buy order block so keep eyes on the given sell order block

Pidilite Industries looks Bearish From Here Pidilite Industries Ltd. is a leading Indian multinational company specializing in adhesives, sealants, construction chemicals, and specialty chemicals. Established in 1959 and headquartered in Mumbai, India, Pidilite is best known for its flagship brand **Fevicol**, which has become synonymous with

Pidilt industries is weak , current price os 2900 Rs Hello Frds
pidilit industries looks weak from current level 2900 Rs
it may correct upto 2400 -2500 Level soon ,
so we can plan a trade accordingly.
Short 2900.00 Rs and stoploss 3000.00 Rs

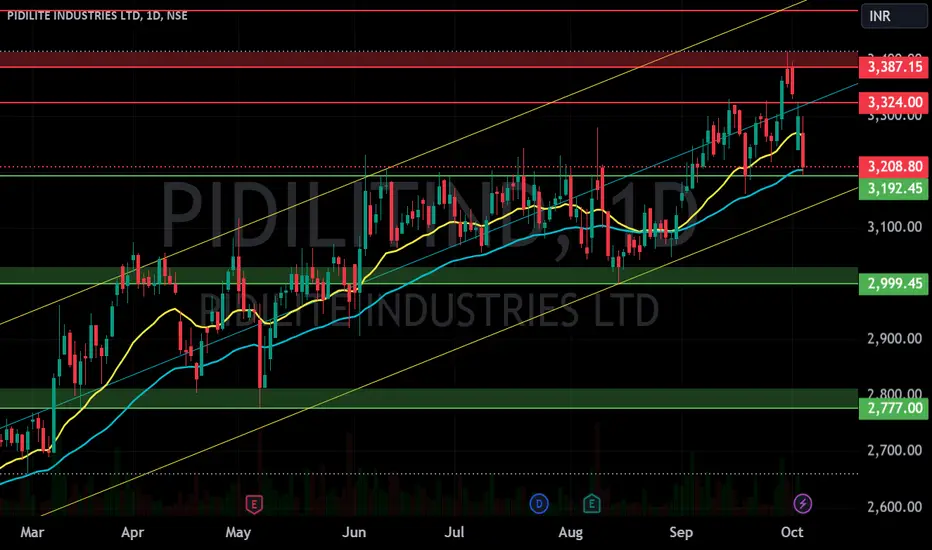
PIDILITIND: High-Probability Trade Setup1️⃣ Current Market Structure & Fibonacci Setup
The price is currently in a corrective wave, forming a potential ABC pattern from the swing high of ₹3,385.40.
The correction aligns with the crucial 113%-127% retracement zone, a powerful reversal area often referred to as the golden extension zone.

[Positional] Pidilite SnR IdeaNote -
One of the best forms of Price Action is to not try to predict at all. Instead of that, ACT on the price. So, this chart tells at "where" to act in "what direction. Unless it triggers, like, let's say the candle doesn't break the level which says "Buy if it breaks", You should not buy at all.

PIDILITE S/RSupport and Resistance Levels:
Support Levels: These are price points (green line/shade) where a downward trend may be halted due to a concentration of buying interest. Imagine them as a safety net where buyers step in, preventing further decline.
Resistance Levels: Conversely, resistance levels (re
PIDILITIND bullish buy "PIDILITIND bullish," it seems that the overall sentiment is positive, with many analysts and technical indicators suggesting a potential increase in the stock price

See all ideas
Summarizing what the indicators are suggesting.
Neutral
SellBuy
Strong sellStrong buy
Strong sellSellNeutralBuyStrong buy
Neutral
SellBuy
Strong sellStrong buy
Strong sellSellNeutralBuyStrong buy
Neutral
SellBuy
Strong sellStrong buy
Strong sellSellNeutralBuyStrong buy
An aggregate view of professional's ratings.
Neutral
SellBuy
Strong sellStrong buy
Strong sellSellNeutralBuyStrong buy
Neutral
SellBuy
Strong sellStrong buy
Strong sellSellNeutralBuyStrong buy
Neutral
SellBuy
Strong sellStrong buy
Strong sellSellNeutralBuyStrong buy
Displays a symbol's price movements over previous years to identify recurring trends.
MSDU
Amundi MSCI Emerging Markets SRI Climate Paris Aligned UCITS ETF DR (D)Weight
0.57%
Market value
14.68 M
USD
AMEG
Amundi MSCI Emerging Markets SRI Climate Paris Aligned -UCITS ETF DR- DistributionWeight
0.57%
Market value
14.68 M
USD
AMEI
Amundi MSCI Emerging Markets SRI Climate Paris Aligned UCITS ETF DR C- CapitalisationWeight
0.57%
Market value
14.68 M
USD
Explore more ETFs
Frequently Asked Questions
The current price of PIDILITIND is 1,459.80 INR — it has decreased by −1.29% in the past 24 hours. Watch Pidilite Industries Limited stock price performance more closely on the chart.
Depending on the exchange, the stock ticker may vary. For instance, on NSE exchange Pidilite Industries Limited stocks are traded under the ticker PIDILITIND.
PIDILITIND stock has fallen by −0.94% compared to the previous week, the month change is a 0.56% rise, over the last year Pidilite Industries Limited has showed a −7.40% decrease.
We've gathered analysts' opinions on Pidilite Industries Limited future price: according to them, PIDILITIND price has a max estimate of 1,895.00 INR and a min estimate of 1,300.00 INR. Watch PIDILITIND chart and read a more detailed Pidilite Industries Limited stock forecast: see what analysts think of Pidilite Industries Limited and suggest that you do with its stocks.
PIDILITIND reached its all-time high on Sep 30, 2024 with the price of 1,707.50 INR, and its all-time low was 1.55 INR and was reached on Oct 9, 1996. View more price dynamics on PIDILITIND chart.
See other stocks reaching their highest and lowest prices.
See other stocks reaching their highest and lowest prices.
PIDILITIND stock is 1.73% volatile and has beta coefficient of 0.77. Track Pidilite Industries Limited stock price on the chart and check out the list of the most volatile stocks — is Pidilite Industries Limited there?
Today Pidilite Industries Limited has the market capitalization of 1.48 T, it has increased by 0.09% over the last week.
Yes, you can track Pidilite Industries Limited financials in yearly and quarterly reports right on TradingView.
Pidilite Industries Limited is going to release the next earnings report on Jan 27, 2026. Keep track of upcoming events with our Earnings Calendar.
PIDILITIND earnings for the last quarter are 5.70 INR per share, whereas the estimation was 6.09 INR resulting in a −6.43% surprise. The estimated earnings for the next quarter are 6.14 INR per share. See more details about Pidilite Industries Limited earnings.
Pidilite Industries Limited revenue for the last quarter amounts to 35.54 B INR, despite the estimated figure of 35.30 B INR. In the next quarter, revenue is expected to reach 37.39 B INR.
PIDILITIND net income for the last quarter is 5.79 B INR, while the quarter before that showed 6.72 B INR of net income which accounts for −13.86% change. Track more Pidilite Industries Limited financial stats to get the full picture.
Pidilite Industries Limited dividend yield was 0.70% in 2024, and payout ratio reached 48.99%. The year before the numbers were 0.53% and 47.05% correspondingly. See high-dividend stocks and find more opportunities for your portfolio.
As of Dec 9, 2025, the company has 14.62 K employees. See our rating of the largest employees — is Pidilite Industries Limited on this list?
EBITDA measures a company's operating performance, its growth signifies an improvement in the efficiency of a company. Pidilite Industries Limited EBITDA is 32.23 B INR, and current EBITDA margin is 23.20%. See more stats in Pidilite Industries Limited financial statements.
Like other stocks, PIDILITIND shares are traded on stock exchanges, e.g. Nasdaq, Nyse, Euronext, and the easiest way to buy them is through an online stock broker. To do this, you need to open an account and follow a broker's procedures, then start trading. You can trade Pidilite Industries Limited stock right from TradingView charts — choose your broker and connect to your account.
Investing in stocks requires a comprehensive research: you should carefully study all the available data, e.g. company's financials, related news, and its technical analysis. So Pidilite Industries Limited technincal analysis shows the strong sell today, and its 1 week rating is sell. Since market conditions are prone to changes, it's worth looking a bit further into the future — according to the 1 month rating Pidilite Industries Limited stock shows the buy signal. See more of Pidilite Industries Limited technicals for a more comprehensive analysis.
If you're still not sure, try looking for inspiration in our curated watchlists.
If you're still not sure, try looking for inspiration in our curated watchlists.