Reliance Ind. Fut - Weekly Analysis - 10 - 14 Nov., 25NSE:RELIANCE1!
RELIANCE INDS FUTURES — Chart Pathik Weekly Levels
(If these levels have helped guide your trades, a quick boost or comment is all it takes to keep these weekly updates free and community-strong!)
Reliance Industries Weekly Futures is consolidating at 1,498.70, tightly rotating n

Reliance Industries Futures – Weekly Analysis (6–10 Oct 2025)NSE:RELIANCE1!
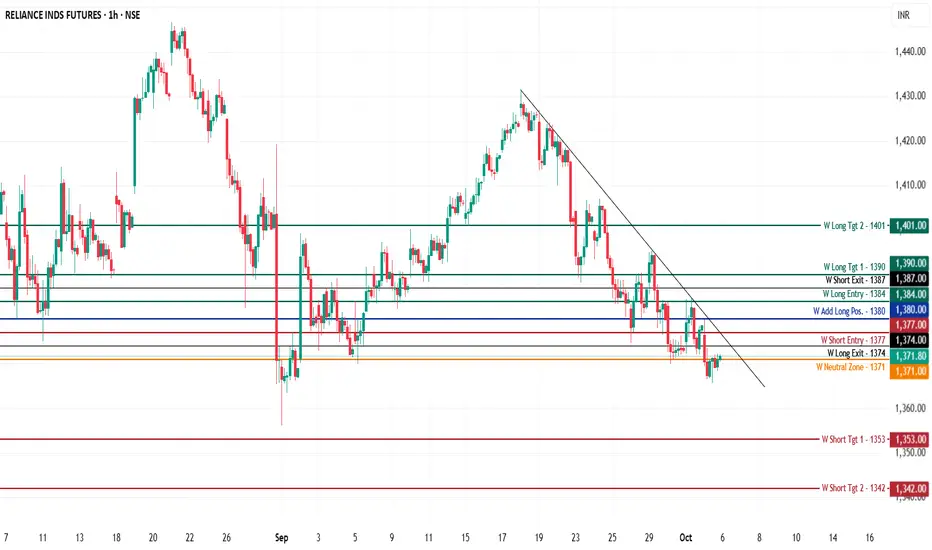
Reliance is currently trading near 1,371.80, trying to lift above a descending trendline after an extended correction phase. The price action is testing a critical neutral zone near 1,371, which will dictate the weekly bias.
Bullish Weekly Case
Long Entry (1,384):
Long positions a
Reliance Industries Futures – Weekly Analysis (29 Sep. -3 Oct.)NSE:RELIANCE1!
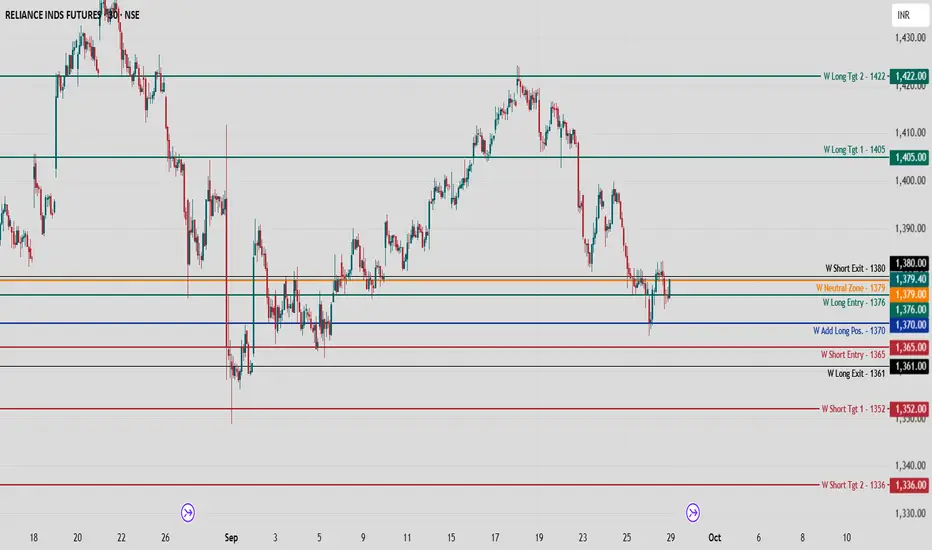
Reliance is currently consolidating at 1,379.40, recovering slightly after a steep correction and oscillating around critical inflection levels for the upcoming week.
Bullish Weekly Structure
Long Entry Zone (1,376):
The weekly long setup activates above 1,376, signaling buyers ta
Market Analysis & Risk GloballyPart 1: Foundations of Global Market Analysis
1.1 What is Market Analysis?
Market analysis is the process of studying market conditions to understand demand, supply, pricing, growth potential, and risk. Globally, it covers:
Macroeconomic indicators (GDP growth, inflation, interest rates, unemploym

Reliance Futures: Bearish Rally or Relief Bounce Ahead?💬 What’s your take — bounce & dump? Or trend shift incoming?
Type “Bearish bounce” if you see a short setup coming.
RELIANCE-1H Smart Money Strikes AgainThis 1H chart of RELIANCE INDS FUTURES shows a classic Smart Money Reversal Setup.
Price first executes a sweep of sell-side liquidity (marked "SWEEP") and then confirms strength with a bullish divergence in RSI 📈.
A possible retracement into the demand zone (highlighted pink circle) could offer a h

RELIANCE Futures - Strong Breakout | Sector Aligned |Here is the full structured checklist review for RELIANCE Futures (Lot Size = 500)
using AI.
RELIANCE Futures - Strong Breakout | Sector Aligned | Dip Opportunity 1440-1460
🗓️ 1️⃣ Week & Month Check
Weekly Chart:
✅ Positive momentum → clear rising structure
✅ No falling MA → 20 EMA starting to ris

Reliance on supportReliance getting supoprt on KC and supertrend. bounce from this level may give the bullish signal. break below this may be caution

Positional Buy Reliance Fut near 2966 tgt 3080 Stop loss 2940Indicators of the stock are suggesting a good momentum ahead as it has given internal positive crossover. Also Its has been taking strong support at short term moving averages which can act as stop loss. Stock could touch new life high in coming months.

Reliance strong positive trend from current levelHEllo Frds,
Reliance looking strong from current level 2437 ,
positional trade , Target 2684 Rs ,
add 1 more qty if goes around 2350
Note : this is for educational purpose only .

See all ideas
Summarizing what the indicators are suggesting.
Neutral
SellBuy
Strong sellStrong buy
Strong sellSellNeutralBuyStrong buy
Neutral
SellBuy
Strong sellStrong buy
Strong sellSellNeutralBuyStrong buy
Neutral
SellBuy
Strong sellStrong buy
Strong sellSellNeutralBuyStrong buy
A representation of what an asset is worth today and what the market thinks it will be worth in the future.
Displays a symbol's price movements over previous years to identify recurring trends.
Frequently Asked Questions
The current price of RELIANCE INDS FUTURES is 1,544.00 INR — it has risen 0.62% in the past 24 hours. Watch RELIANCE INDS FUTURES price in more detail on the chart.
The volume of RELIANCE INDS FUTURES is 13.39 M. Track more important stats on the RELIANCE INDS FUTURES chart.
Open interest is the number of contracts held by traders in active positions — they're not closed or expired. For RELIANCE INDS FUTURES this number is 103.91 M. You can use it to track a prevailing market trend and adjust your own strategy: declining open interest for RELIANCE INDS FUTURES shows that traders are closing their positions, which means a weakening trend.
Buying or selling futures contracts depends on many factors: season, underlying commodity, your own trading strategy. So mostly it's up to you, but if you look for some certain calculations to take into account, you can study technical analysis for RELIANCE INDS FUTURES. Today its technical rating is buy, but remember that market conditions change all the time, so it's always crucial to do your own research. See more of RELIANCE INDS FUTURES technicals for a more comprehensive analysis.