Market Analysis & Risk GloballyPart 1: Foundations of Global Market Analysis
1.1 What is Market Analysis?
Market analysis is the process of studying market conditions to understand demand, supply, pricing, growth potential, and risk. Globally, it covers:
Macroeconomic indicators (GDP growth, inflation, interest rates, unemployment).
Sectoral performance (energy, technology, finance, manufacturing, etc.).
Trade flows (imports, exports, balance of payments).
Capital flows (FDI, portfolio investment, cross-border lending).
Policy frameworks (monetary and fiscal policies, trade agreements, taxation).
Sentiment indicators (consumer confidence, investor sentiment, market volatility).
Global market analysis differs from domestic market study because it requires factoring in cross-border interactions and systemic risks.
1.2 Levels of Global Market Analysis
Macro-Level (Country/Region Analysis)
GDP growth trends.
Sovereign credit ratings.
Fiscal and monetary stability.
Political stability.
Meso-Level (Industry/Sector Analysis)
Technology adoption.
Energy transitions.
Healthcare innovation.
Financial market growth.
Micro-Level (Company/Asset Analysis)
Firm profitability.
Market share.
ESG compliance.
Global supply chain dependencies.
1.3 Drivers of Global Markets
Globalization & Trade Agreements – WTO, regional FTAs, BRICS cooperation.
Monetary Policy Coordination – Fed, ECB, BoJ, PBoC influence liquidity.
Technology & Innovation – AI, blockchain, automation.
Energy Transition – Shift from fossil fuels to renewables.
Demographics – Aging populations in developed nations, young workforce in emerging markets.
Geopolitics – Conflicts, sanctions, alliances, and trade wars.
Part 2: Types of Global Market Risks
2.1 Financial Risks
Currency Risk – Fluctuations in exchange rates. Example: USD strength impacts emerging markets’ debt repayment.
Interest Rate Risk – Rising global rates increase borrowing costs.
Credit Risk – Default risk for sovereign and corporate bonds.
Liquidity Risk – Difficulty in converting assets to cash during crises.
2.2 Economic Risks
Recession Risk – Global slowdowns like the 2008 crisis or 2020 pandemic.
Inflation Risk – High inflation erodes consumer purchasing power.
Commodity Risk – Oil, gold, or food price volatility.
Trade Risk – Tariffs, supply chain disruptions, protectionism.
2.3 Political & Geopolitical Risks
Wars & Conflicts – Russia-Ukraine, Middle East tensions.
Sanctions – U.S. vs China or Iran sanctions impacting trade.
Regulatory Risks – Antitrust rules, tech regulations, ESG norms.
Nationalism & Populism – Rising protectionist policies.
2.4 Environmental & Climate Risks
Climate Change – Extreme weather, rising sea levels.
Energy Transition – Stranded fossil fuel assets.
Carbon Taxes & ESG Pressures – Costs for polluting industries.
2.5 Technological Risks
Cybersecurity Threats – Attacks on financial systems.
Disruption by AI & Automation – Job losses, structural unemployment.
Digital Currency Risks – Volatility of cryptocurrencies and CBDC adoption challenges.
2.6 Systemic Risks
Global Financial Contagion – Domino effects of crises.
Banking Failures – 2008 Lehman Brothers scenario.
Shadow Banking & Derivatives – Hidden risks in opaque markets.
Part 3: Tools & Frameworks for Global Market Analysis
3.1 Fundamental Analysis
GDP, CPI, PMI, balance of trade.
Sovereign bond yields.
Corporate earnings across regions.
3.2 Technical Analysis (Global Indices & Commodities)
Nifty, Dow Jones, FTSE, Nikkei, Shanghai Composite.
Oil, gold, copper, wheat charts.
Volume profile and volatility indexes (VIX).
3.3 Sentiment & Behavioral Analysis
Fear & Greed Index.
Global consumer sentiment surveys.
Hedge fund positioning reports.
3.4 Risk Management Tools
Hedging Instruments: Futures, options, swaps.
Diversification: Across geographies and asset classes.
Value-at-Risk (VaR): Measuring downside risk.
Stress Testing: Scenario analysis of global shocks.
Part 4: Regional Perspectives in Market Risk
4.1 United States
Largest economy, reserve currency issuer.
Risks: Fed tightening, tech regulation, political polarization.
4.2 Europe
Eurozone debt crisis memories.
Brexit aftershocks.
Energy dependency on imports.
4.3 Asia
China: Property crisis, tech crackdown, geopolitical tensions.
India: High growth but vulnerable to oil shocks.
Japan: Aging population, yen volatility.
4.4 Emerging Markets
High growth, high volatility.
Dollar debt risk.
Vulnerability to capital flight.
4.5 Middle East & Africa
Oil dependency.
Political instability.
Transition to non-oil economies.
Part 5: Case Studies of Global Market Risks
5.1 2008 Global Financial Crisis
Trigger: U.S. housing bubble, Lehman Brothers collapse.
Risk lesson: Leverage + complex derivatives = systemic collapse.
5.2 COVID-19 Pandemic (2020)
Trigger: Health crisis turned economic crisis.
Risk lesson: Black swan events can halt global trade overnight.
5.3 Russia-Ukraine War (2022 onwards)
Trigger: Geopolitical conflict.
Risk lesson: Commodity shocks + sanctions reshape supply chains.
5.4 China Property Crisis (Evergrande)
Trigger: Overleveraged real estate.
Risk lesson: Emerging market debt crises have global spillovers.
Part 6: Mitigating Global Market Risks
6.1 For Investors
Diversification across regions.
Use of derivatives for hedging.
Regular portfolio rebalancing.
ESG-aligned investing for long-term resilience.
6.2 For Corporations
Hedging currency & commodity exposure.
Building resilient supply chains.
Geographic diversification of operations.
Cybersecurity investments.
6.3 For Policymakers
Coordinated monetary & fiscal responses.
Transparent regulations.
Climate-resilient policies.
Stronger global institutions (IMF, WTO, G20).
Part 7: Future of Global Market Risks
De-globalization vs. Re-globalization – Supply chains may shorten, but digital globalization accelerates.
Climate Emergency – Strongest long-term risk to global markets.
Rise of Multipolar World – U.S., China, India, and EU competing for dominance.
Digital Finance Expansion – AI, blockchain, CBDCs reshaping finance.
Black Swan Events – Pandemics, cyberwars, or systemic collapses cannot be ruled out.
Conclusion
Global market analysis and risk management are intertwined disciplines. The world economy is no longer a sum of separate markets but a single interconnected system. A shock in one corner—whether it be a pandemic, war, financial collapse, or natural disaster—spreads rapidly across others.
To thrive in such an environment, investors, companies, and governments must adopt dynamic risk management strategies, embrace diversification, and remain vigilant about macro and micro-level changes.
Ultimately, global market analysis is not about predicting the future with certainty but about building resilience against uncertainty.
RELIANCEX2025 trade ideas
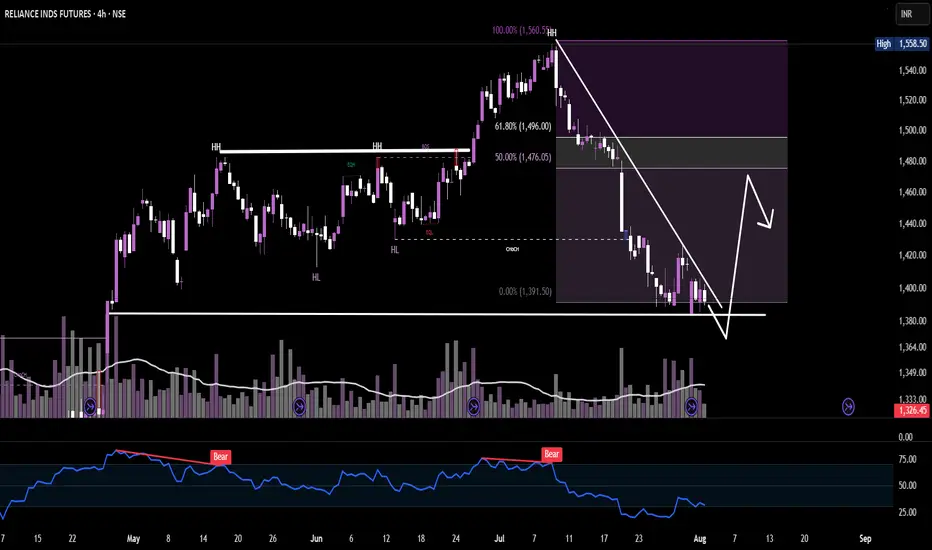
Reliance Futures: Bearish Rally or Relief Bounce Ahead?💬 What’s your take — bounce & dump? Or trend shift incoming?
Type “Bearish bounce” if you see a short setup coming.
RELIANCE-1H Smart Money Strikes AgainThis 1H chart of RELIANCE INDS FUTURES shows a classic Smart Money Reversal Setup.
Price first executes a sweep of sell-side liquidity (marked "SWEEP") and then confirms strength with a bullish divergence in RSI 📈.
A possible retracement into the demand zone (highlighted pink circle) could offer a high-probability long entry, targeting the previous high (Buy-side Liquidity Zone).
Volume spike + RSI trend breakout = institutional accumulation signs.

RELIANCE Futures - Strong Breakout | Sector Aligned |Here is the full structured checklist review for RELIANCE Futures (Lot Size = 500)
using AI.
RELIANCE Futures - Strong Breakout | Sector Aligned | Dip Opportunity 1440-1460
🗓️ 1️⃣ Week & Month Check
Weekly Chart:
✅ Positive momentum → clear rising structure
✅ No falling MA → 20 EMA starting to rise again, 10 EMA supportive
✅ RSI Weekly ~69 → strong → near breakout zone
✅ Volume → moderate, no exhaustion
Monthly Chart:
✅ Overall trend supportive, no falling MA
⚠️ Monthly RSI ~59 → mid-range → room to expand
✅ Price holding above key MAs → bullish base building
✅ Week & Month → Strong base breakout potential
✅ 2️⃣ Daily TF
Squeeze breakout → ✅ YES → clean consolidation breakout visible
Change in polarity → partial → may test 1450-1460 again
RSI 60 cross → ✅ YES
Wedge break → ✅ → small wedge resolved
Relative volume → ✅ huge spike on breakout day → strong confirmation
✅ Daily → Strong breakout action
⏱️ 3️⃣ 125min TF
RSI not above 80 → ⚠️ Borderline → ~80.5 → caution
Price structure → ✅ Breakout validated → sustained above 1463
125min Verdict: ⚠️ Slight caution → RSI extended → not ideal for fresh full size entry → look for dip
⏱️ 4️⃣ 75min TF
RSI healthy → ⚠️ ~74 → slightly extended → similar caution
Price structure → ✅ Higher highs / higher lows
8–21 EMA aligned → ✅ YES
75min Verdict: ⚠️ Slight caution → better to enter on dip
⏰ 5️⃣ 20min TF
RSI not above 80 → ✅ ~67
Price above 1st 20min high → ✅ yes
CVD positive & rising → ✅ clear CVD strength
Breakout volume supportive → ✅ excellent volume
Sector aligned → ✅ Nifty Oil & Gas RSI > 67 and rising → sector supporting move
✅ 20min → Entry acceptable but caution as higher TFs extended
📊 6️⃣ TPO Profile (30min)
POC shifting higher → ✅ clearly seen
Untested area below → ✅ ~1420-1440 strong support → LVN present
✅ TPO → Very supportive
Final Checklist Summary:
Component Status
Week & Month ✅ Strong
Daily TF ✅ Strong
125min TF ⚠️ Slight caution, RSI high
75min TF ⚠️ Slight caution, RSI high
20min TF ✅ Strong
TPO Profile ✅ Strong
Sector ✅ Supportive (Nifty Oil & Gas strong)
🎯 Actionable Trade Plan - RELIANCE Futures
Parameter Value
Entry Zone 1440–1460 (ideal dip zone → near TPO LVN + polarity retest)
Aggressive Entry Current zone 1467 → reduced size only if intraday strong
Stop Below 1420
Target 1 1500
Target 2 1550
Lot Size 500
🔔 Execution Guidance:
→ Do NOT chase highs full size → RSI high on higher TFs
→ Best to enter on dip 1440-1460 zone → matches TPO + polarity zone → ideal R/R
→ If entering now (~1467+), use small size + tight trailing
Tactical Insights:
✅ Best R zone: ₹1440 → gives strong 3R to T1 and 5.5R to T2
✅ Acceptable: ₹1460 okay if sector continues strong
⚠️ Chase level: ₹1467 → reduced size → high TF RSI elevated
Summary Action:
→ Wait for dip to 1440–1460 zone → ideal R/R
→ If entering now (~1467), partial size + tight trailing mandatory
Conclusion:
RELIANCE Futures offers a high probability dip-buy opportunity with strong sector tailwind. Patience for entry near 1440-1460 will offer best risk/reward. Sector and CVD both confirm trend strength.
Hashtags:
#RelianceFutures #NiftyOilGas #BreakoutTrading #MultiTimeFrameAnalysis #FuturesTrading #PriceAction #TPOProfile #RelativeVolume #TradingSetup #LearningPurpose #ResearchOnly
Disclosure:
This idea is shared purely for learning and research purposes. It is not trading advice and I am not a SEBI registered analyst. Please do your own research and consult with a qualified advisor before taking any trades based on this post.

Reliance on supportReliance getting supoprt on KC and supertrend. bounce from this level may give the bullish signal. break below this may be caution


Positional Buy Reliance Fut near 2966 tgt 3080 Stop loss 2940Indicators of the stock are suggesting a good momentum ahead as it has given internal positive crossover. Also Its has been taking strong support at short term moving averages which can act as stop loss. Stock could touch new life high in coming months.

Reliance strong positive trend from current levelHEllo Frds,
Reliance looking strong from current level 2437 ,
positional trade , Target 2684 Rs ,
add 1 more qty if goes around 2350
Note : this is for educational purpose only .

Reliance work properly. Short. Reliance breaks it's support n my near by tgt i mentioned.
I already hold put options from last week.

Reliance - launcpad readyStage 2A
- Week of 12.6.23
- above all mas
- increasing volume
- double bottom
It has bounced from a confluence of moving averages and ready to rip now!


Reliance future chart analysis#Reliancefuture
Rel with channel entry.
Wolf wave & rounding bottom
May touch @ 2473.
Temporary seems bottomout.
Near support 2408,2368.
Chart for study.
Trade on advice of fin.consultant.

Reliance IndustriesHello and welcome to this analysis
After a sharp down move last week which might have ended its sideways corrective, Reliance is now attempting a double bottom in lower time frame, suggesting 2475 and 2575 as possible upside levels as long as its above 2470

Reliance future chart anaysisRel needs to cross 2408/2417 area,
Again 2430 on closing base can move to 2473 .
S.loss area @ 2368.
Chart for study.any trade must be advised by fin.consultant.


Reliance Futures Key trading level 28th June 2022Reliance Futures Key trading level 28th June 2022
Disclaimer: These levels are purely based on Price action/demand and supply zones & and consumed only for educational purpose & should not be taken as buy/sell recommendation. I will not be responsible for any loss/profit incurred if anyone takes trades based on my views.
Please consult your Financial Advisor before making any trading decision.
Leave a comment that is helpful or encouraging. Let's master the markets together.

Reliance Futures Key trading level 24th June 2022Reliance Futures Key trading level 24th June 2022
Disclaimer: These levels are purely based on Price action/demand and supply zones & and consumed only for educational purpose & should not be taken as buy/sell recommendation. I will not be responsible for any loss/profit incurred if anyone takes trades based on my views.
Please consult your Financial Advisor before making any trading decision.
Leave a comment that is helpful or encouraging. Let's master the markets together.

Reliance Level#We make Only Profit
#All Important Level in Reliance
#BANKNIFTY #NIFTY #TCS #RELIANCE

reliance is about to touch new high buy and hold for 2500 reliance hold for bullish move new high will come very soon

OptionsTrade for RelianceBuy Reliance 2160CE@90-100 and for hedging sell 2 Lots of 2260CE@45-55. Margin will be required to short 2 lots of options.
Buy 1Lot of Reliance Future strictly above 2240.
Disclaimer :
Trading is never ever recommended as it is injurious to mankind. This is purely my study based on technical charts and for educational purpose only. Please do your analysis before taking any trades given by me. I MUST not be held responsible for any profit or loss out of any trades you take on our advice. All Disclaimers Apply.

relince Hello guys herre we are looking at the chart of relince it is forming bull flag if we broke up side then target will all the way up of channel

Reliance, Pullback on weekly chart!Some retraceent still possible but surly a long .
Simple price action no Jazz.
