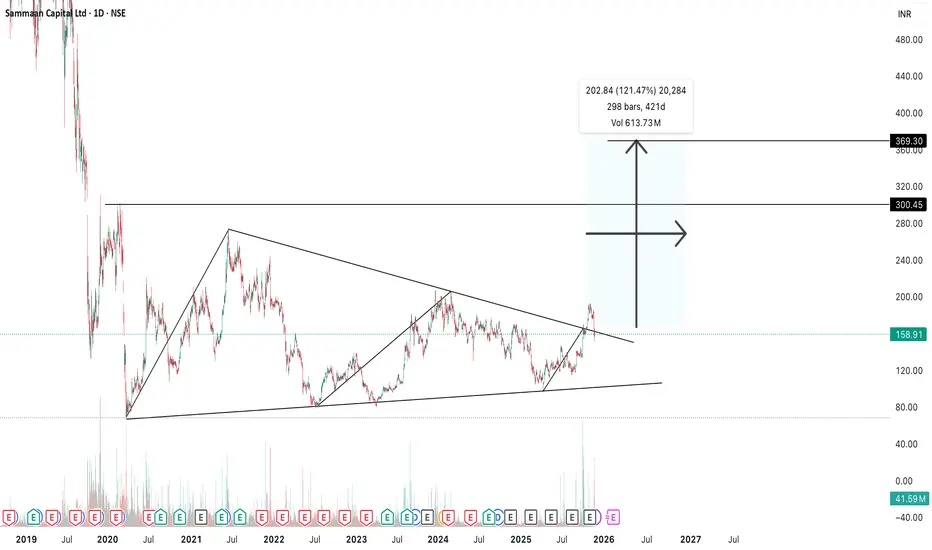
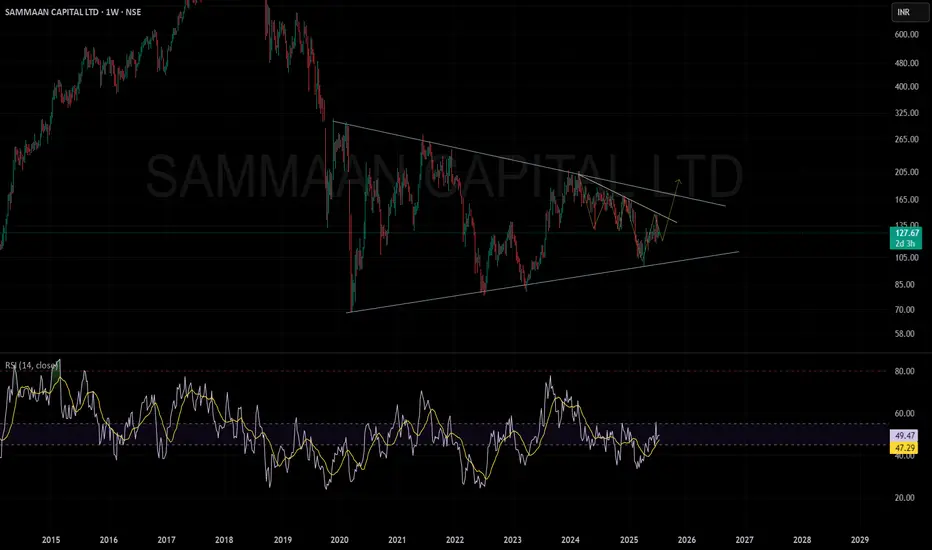
Sammaan Capital Triangle patternBullish Triangle Pattern on Sammaan Capital
Price has been consolidating inside a triangle pattern after a strong prior up-move, indicating healthy correction and energy build-up.
This is a personal study
Next report date
—
Report period
—
EPS estimate
—
Revenue estimate
—
16.17 INR
−18.07 B INR
84.58 B INR
786.09 M
About Sammaan Capital Ltd
Sector
Industry
CEO
Gagan Banga
Website
Headquarters
Mumbai
Founded
2005
ISIN
INE148I01020
FIGI
BBG004H4H9C3
Sammaan Capital Ltd. is a holding company, which engages in the operation of financing institutions which specializes in housing finance, real estate, and wealth management. It operates through the Investing and Financing Related Activities; and Fee Income segments. The Investing and Financing Related Activities segment involves in investing and financing related activities in various subsidiaries, financing of loans, and credit activities. The Fee Income segment comprises of financial service related fee from services income, commission on insurance, and other fee based activities. The company was founded by Sameer Gehlaut on May 10, 2005 and is headquartered in Mumbai, India.
Related stocks
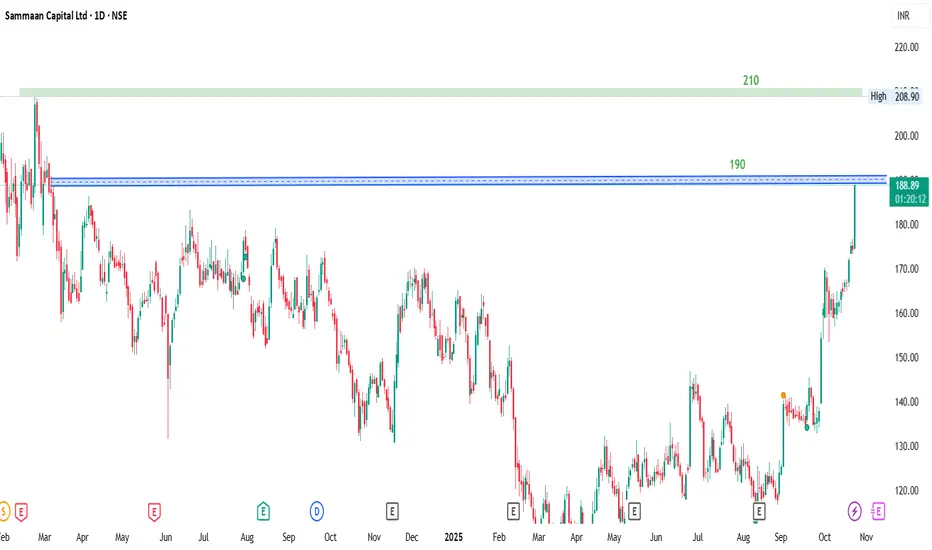
Sammaan Capital, 1, Long, Volumes, ResistanceSammaan Capital showing a good buying with good volumes at this level, if it breaks the 190 then we can see it going till 200 and 210.
Entry: above 190
Target1: 200
Target2: 210
Amazing breakout on WEEKLY Timeframe - SAMMAANCAPCheckout an amazing breakout happened in the stock in Weekly timeframe, macroscopically seen in Daily timeframe. Having a great favor that the stock might be bullish expecting a staggering returns of minimum 25% TGT. IMPORTANT BREAKOUT LEVELS ARE ALWAYS RESPECTED!
NOTE for learners: Place the break

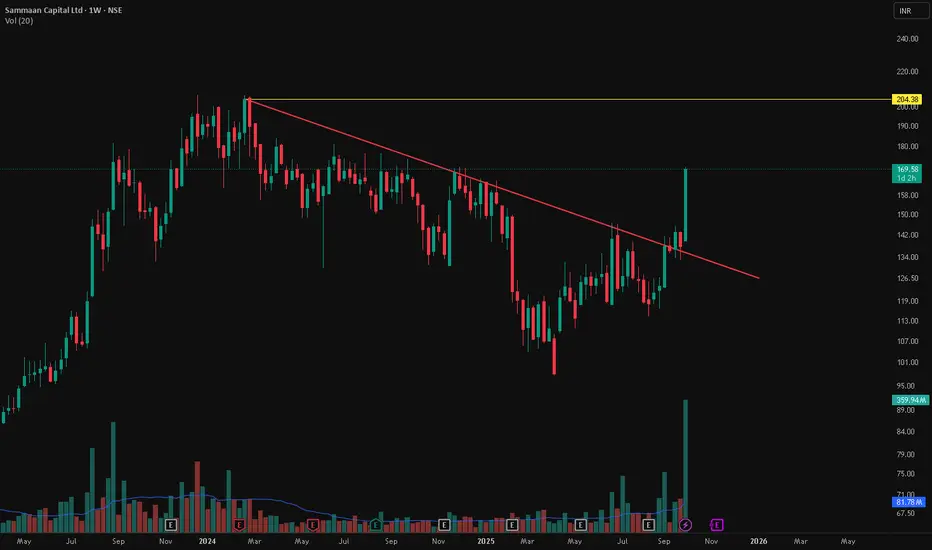
Sammaan Capital Ltd - Weekly Breakout📊 Sammaan Capital Ltd – Major Trendline Breakout with Volume Spike 🚀
📅 Chart Date: October 2, 2025 | Timeframe: Weekly
📍 CMP: ₹169.58 (+23.04%)
📈 Symbol: NSE:SAMMAANCAP
🔍 Technical Analysis
📉 Multi-Month Downtrend Broken
Stock has been consolidating under a falling trendline since late 2023.
This w
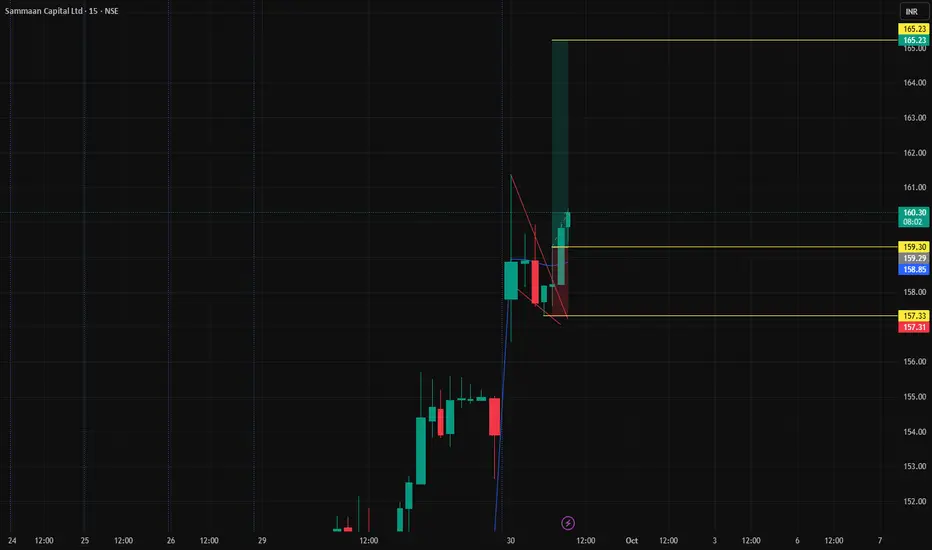
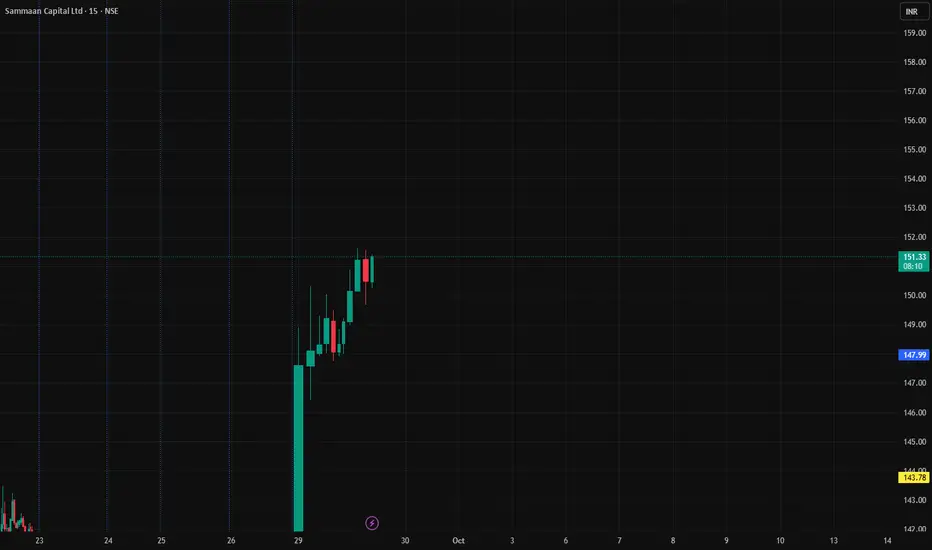
sammancap Intraday Bullish momentum with good volume & chart pattern breakout
entry-159.3
SL- 157.3
Target-165
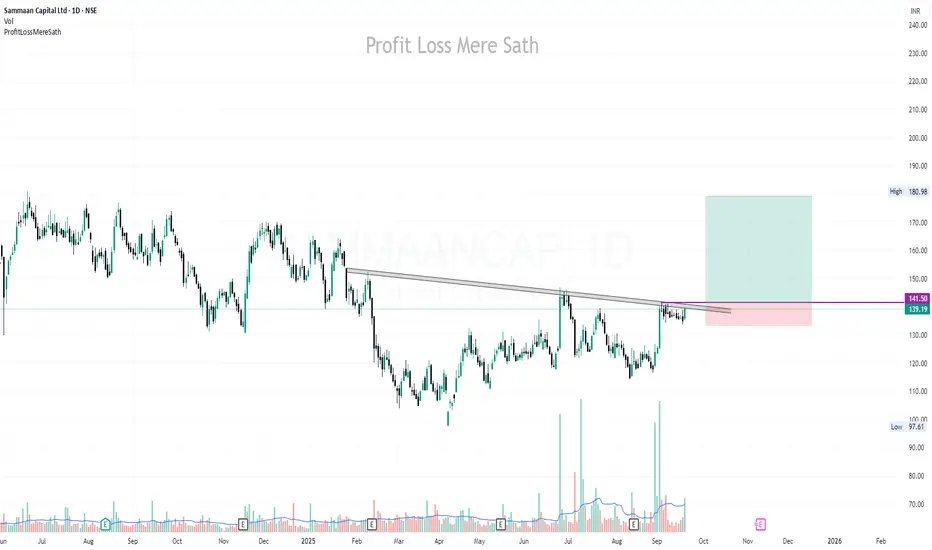
SAMMAANCAP | Buy above 142 | SL below 130 | 1st Target 180Disclaimer:
This is not financial advice. Please do your own research or consult with a financial advisor before making any investment decisions. Investments in stocks can be risky and may result in loss of capital.
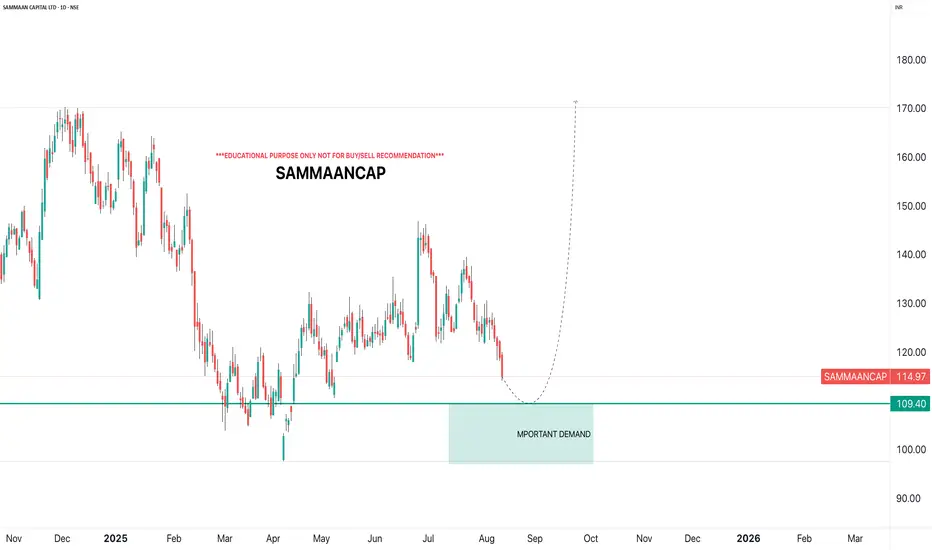
SAMMAANCAPi Observed these Levels based on Price Action and Demand & Supply which is my own Concept "PENDAM CONCEPTS"... Please don't take any trades based on this chart/post... Because this chart is for educational purpose only not for Buy or Sell Recommendation... Thank Q
Sanmaan capital.....cup and handle pattern Cup and handle pattern
Target seems to be 170
30% upside chance

SAMMAAN CAPITAL LTD. trading in a consolidation zone.Sammaan Capital Ltd. is currently in a decisive zone on the weekly charts. For a trend change confirmation:
Short-term traders: Wait for a weekly close above ₹145.
Long-term investors: Look for a sustainable breakout above ₹175 to target the ₹280–₹300 zone.
Bearish bias: A close below ₹100 can si
See all ideas
Summarizing what the indicators are suggesting.
Oscillators
Neutral
SellBuy
Strong sellStrong buy
Strong sellSellNeutralBuyStrong buy
Oscillators
Neutral
SellBuy
Strong sellStrong buy
Strong sellSellNeutralBuyStrong buy
Summary
Neutral
SellBuy
Strong sellStrong buy
Strong sellSellNeutralBuyStrong buy
Summary
Neutral
SellBuy
Strong sellStrong buy
Strong sellSellNeutralBuyStrong buy
Summary
Neutral
SellBuy
Strong sellStrong buy
Strong sellSellNeutralBuyStrong buy
Moving Averages
Neutral
SellBuy
Strong sellStrong buy
Strong sellSellNeutralBuyStrong buy
Moving Averages
Neutral
SellBuy
Strong sellStrong buy
Strong sellSellNeutralBuyStrong buy
Displays a symbol's price movements over previous years to identify recurring trends.
925SCL25B.Y3
Sammaan Capital Limited 9.25% 27-DEC-2025Yield to maturity
50.78%
Maturity date
Dec 27, 2025
S
1030SFIL28.NM
Sammaan Finserve Ltd. 10.3% 02-FEB-2028Yield to maturity
35.00%
Maturity date
Feb 2, 2028
925SCL26B.YQ
Sammaan Capital Limited 9.25% 26-MAR-2026Yield to maturity
31.99%
Maturity date
Mar 26, 2026
S
966SFIL25A.NI
Sammaan Finserve Ltd. 10.05% 02-FEB-2026Yield to maturity
21.42%
Maturity date
Feb 2, 2026
See all SAMMAANCAP bonds
TLTE
FlexShares Morningstar Emerging Markets Factor Tilt Index FundWeight
0.17%
Market value
488.78 K
USD
Explore more ETFs
Frequently Asked Questions
The current price of SAMMAANCAP is 148.32 INR — it has decreased by −0.92% in the past 24 hours. Watch Sammaan Capital Ltd stock price performance more closely on the chart.
Depending on the exchange, the stock ticker may vary. For instance, on NSE exchange Sammaan Capital Ltd stocks are traded under the ticker SAMMAANCAP.
SAMMAANCAP stock has fallen by −4.92% compared to the previous week, the month change is a −21.52% fall, over the last year Sammaan Capital Ltd has showed a −11.34% decrease.
SAMMAANCAP reached its all-time high on Jan 29, 2018 with the price of 1,284.40 INR, and its all-time low was 72.25 INR and was reached on Mar 20, 2020. View more price dynamics on SAMMAANCAP chart.
See other stocks reaching their highest and lowest prices.
See other stocks reaching their highest and lowest prices.
SAMMAANCAP stock is 2.45% volatile and has beta coefficient of 1.75. Track Sammaan Capital Ltd stock price on the chart and check out the list of the most volatile stocks — is Sammaan Capital Ltd there?
Today Sammaan Capital Ltd has the market capitalization of 120.82 B, it has increased by 0.95% over the last week.
Yes, you can track Sammaan Capital Ltd financials in yearly and quarterly reports right on TradingView.
Sammaan Capital Ltd is going to release the next earnings report on Feb 11, 2026. Keep track of upcoming events with our Earnings Calendar.
SAMMAANCAP net income for the last quarter is 3.08 B INR, while the quarter before that showed 3.34 B INR of net income which accounts for −7.73% change. Track more Sammaan Capital Ltd financial stats to get the full picture.
Yes, SAMMAANCAP dividends are paid annually. The last dividend per share was 2.00 INR. As of today, Dividend Yield (TTM)% is 1.35%. Tracking Sammaan Capital Ltd dividends might help you take more informed decisions.
As of Dec 7, 2025, the company has 4.58 K employees. See our rating of the largest employees — is Sammaan Capital Ltd on this list?
EBITDA measures a company's operating performance, its growth signifies an improvement in the efficiency of a company. Sammaan Capital Ltd EBITDA is 28.43 B INR, and current EBITDA margin is 95.58%. See more stats in Sammaan Capital Ltd financial statements.
Like other stocks, SAMMAANCAP shares are traded on stock exchanges, e.g. Nasdaq, Nyse, Euronext, and the easiest way to buy them is through an online stock broker. To do this, you need to open an account and follow a broker's procedures, then start trading. You can trade Sammaan Capital Ltd stock right from TradingView charts — choose your broker and connect to your account.
Investing in stocks requires a comprehensive research: you should carefully study all the available data, e.g. company's financials, related news, and its technical analysis. So Sammaan Capital Ltd technincal analysis shows the sell today, and its 1 week rating is sell. Since market conditions are prone to changes, it's worth looking a bit further into the future — according to the 1 month rating Sammaan Capital Ltd stock shows the neutral signal. See more of Sammaan Capital Ltd technicals for a more comprehensive analysis.
If you're still not sure, try looking for inspiration in our curated watchlists.
If you're still not sure, try looking for inspiration in our curated watchlists.