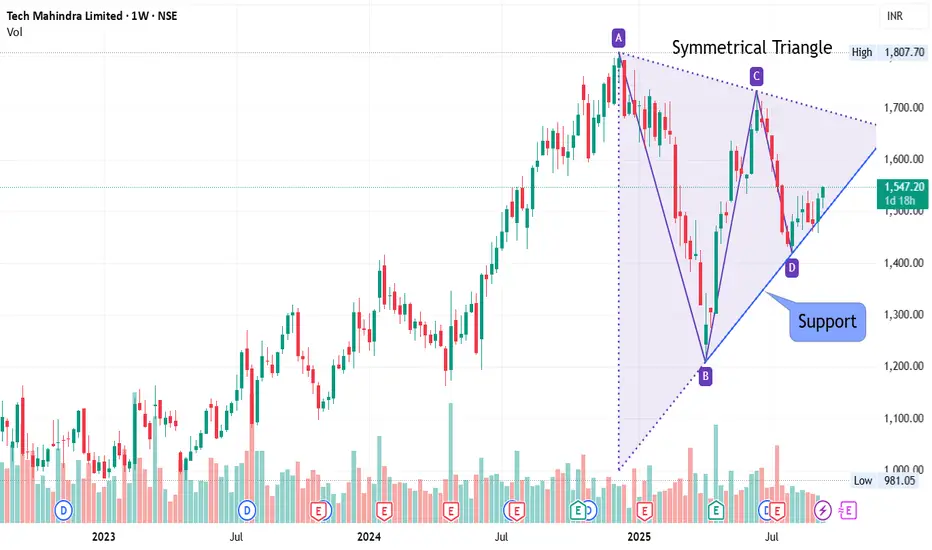
At Support - Weekly Chart - TECHM📊 Script: TECHM
📊 Industry: IT - Software (Computers - Software & Consulting)
Key highlights: 💡⚡
📈On Weekly Chart Script is forming symmetrical triangle and trading near support line.
📈 Script is trading at upper band of BB.
📈 MACD and Double Moving Averages are giving Crossover
📈 Right now RSI is around 58.
📈 One can go for Swing Trade.
⏱️ C.M.P 📑💰- 1547
🟢 Target 🎯🏆 - 1612 / 1655
⚠️ Stoploss ☠️🚫 - 1499
⚠️ Important: Always maintain your Risk & Reward Ratio.
✅Like and follow to never miss a new idea!✅
Disclaimer: I am not SEBI Registered Advisor. My posts are purely for training and educational purposes.
Eat🍜 Sleep😴 TradingView📈 Repeat 🔁
Happy learning with trading. Cheers!🥂
Trade ideas
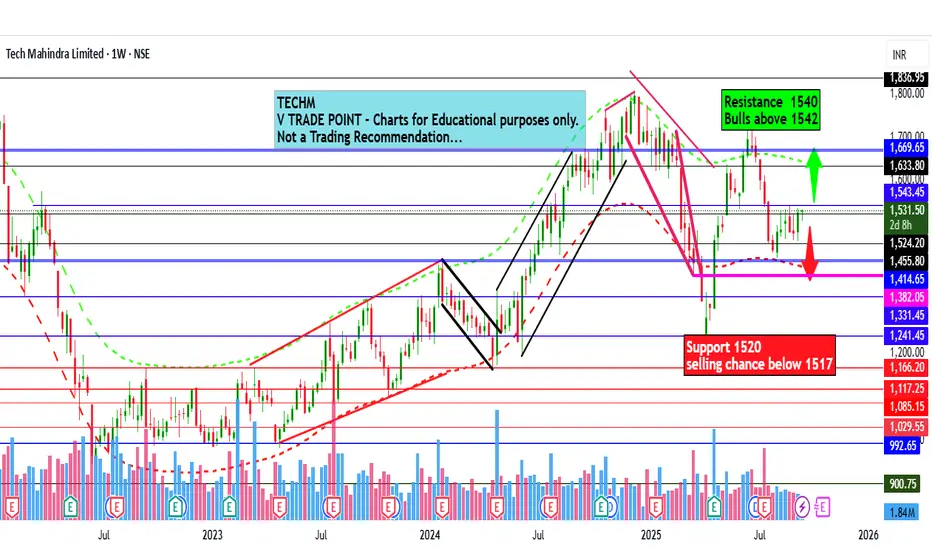
Tech Mahindra Ltd for 17th Sept #TECHM Tech Mahindra Ltd for 17th Sept #TECHM
Resistance 1540 Watching above 1542 for upside momentum.
Support area 1520 Below 1520 gnoring upside momentum for intraday
Watching below 1517 for downside movement...
Above 1540 ignoring downside move for intraday
Charts for Educational purposes only.
Please follow strict stop loss and risk reward if you follow the level.
Thanks,
V Trade Point
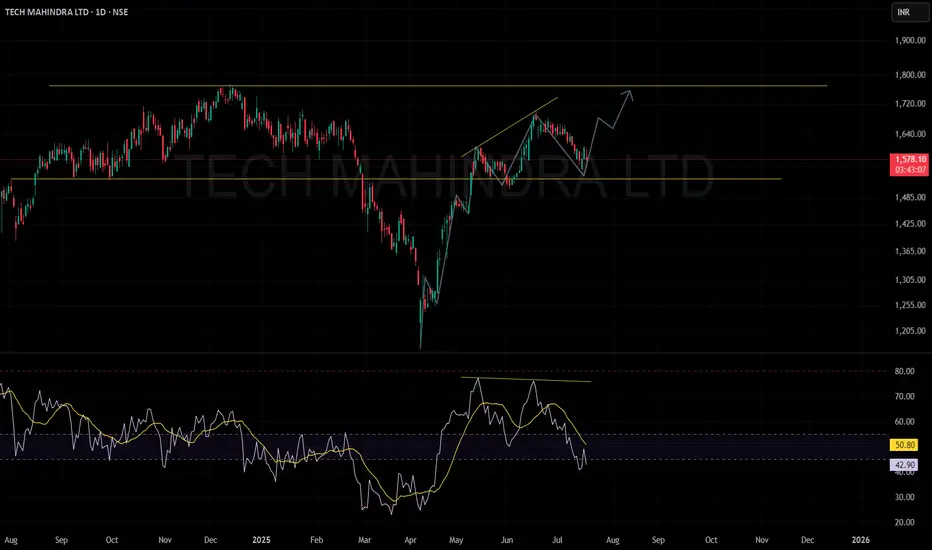
TECH MAHINDRA POISED FOR AN UPMOVE#TECHMAHINDRA
Support and Resistance:
A support zone is identified near ₹1,500 (lower yellow horizontal line).
The resistance zone is marked around ₹1,800 (indicated by the upper yellow horizontal line).
Trend Analysis:
Following a significant decline, the stock has shown a sharp recovery and is now consolidating.
A possible bullish scenario is depicted, anticipating a move towards the resistance zone, subject to price confirmation.
RSI (Relative Strength Index):
Currently, RSI is around 43.56, suggesting mild bearishness.
The RSI previously formed a bearish divergence (lower highs on RSI while price made higher highs), and has since declined.
The yellow moving average line on RSI indicates the momentum trend is still down.
Chart Pattern:
The recent pattern suggests that the stock has pulled back after a failed attempt to break higher, possibly setting up for another upward move.
Summary: Tech Mahindra is at an important technical juncture, consolidating after a recent decline. If it holds above support and momentum improves, a move towards ₹1,800 is possible; however, the current RSI weakness suggests caution until clear strength emerges.
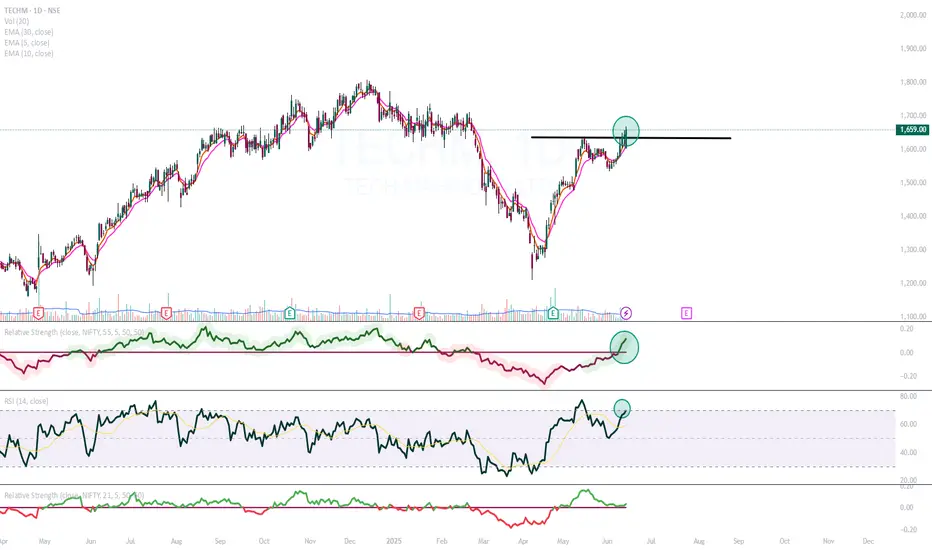
TECHM Looks interestingIT sector is doing relatively well.
Techm from the IT sector particularly looking very interesting.
RS is positive
RSI above 60
Break out with good volume
TECH MAHINDRA is now moving towords upwords 1740TECH MAHINDRA Is showing momentum after clean liquidity sweep , it will take time within 4 days it will touch 1740, lets see price action

Techm - cup and holder breakoutNSE:TECHM
Cup and handle breakout in TechM
Also it breaking the long resistance 1630-1650
TECH_Neutral Price near the recent Resistance
Watch this stock for next 2 days.
If you get a good entry point, Go Long - with very tight SL

TECH MAHINDRA FOR SHORT TERM VIEW 1490TECH MAHINDRA IS in downside for short term and may will fall till 1490, so watch it for short term, hope tgt will soon reach

Tech Mahindra Ltd view for Intraday 23rd May #TECHM Tech Mahindra Ltd view for Intraday 23rd May #TECHM
Resistance 1580 Watching above 1585 for upside momentum.
Support area 1550 Below 1560 ignoring upside momentum for intraday
Watching below 1547 for downside movement...
Above 1560 ignoring downside move for intraday
Charts for Educational purposes only.
Please follow strict stop loss and risk reward if you follow the level.
Thanks,
V Trade Point

Tech Mahindra Ltd view for Intraday 14th May #TECHM Tech Mahindra Ltd view for Intraday 14th May #TECHM
Resistance 1580 Watching above 1583 for upside movement...
Support area 1550 Below 1550 ignoring upside momentum for intraday
Watching below 1546 for downside movement...
Above 1580 ignoring downside move for intraday
Charts for Educational purposes only.
Please follow strict stop loss and risk reward if you follow the level.
Thanks,
V Trade Point

Tech Mahindra Ltd view for Intraday 25th April #TECHM Tech Mahindra Ltd view for Intraday 25th April #TECHM
Resistance 1450-1455 Watching above 1456 for upside movement...
Support area 1400 Below 1440 ignoring upside momentum for intraday
Watching below 1396 for downside movement...
Above 1420 ignoring downside move for intraday
Charts for Educational purposes only.
Please follow strict stop loss and risk reward if you follow the level.
Thanks,
V Trade Point

TECHM | can be buy with a tight stop-loss.If the stop-loss hits, no worries, we just have to follow the plan and try again.
Disclaimer:
This is not financial advice. Please do your own research or consult with a financial advisor before making any investment decisions. Investments in stocks can be risky and may result in loss of capital.

TECHM | Short @ 1532 | Strict SL Above @1580 | Target @1345RSI is oversold... be careful...
Disclaimer:
This is not financial advice. Please do your own research or consult with a financial advisor before making any investment decisions. Investments in stocks can be risky and may result in loss of capital.

TECHM: Ride the Wave to New Highs
Overview:
The 1-hour chart for Tech Mahindra Ltd. (TECHM) showcases a corrective Elliott Wave pattern (b, (B), (C) ) and highlights potential price movements, key levels, and target zones. Let's dive in! 🚀
Key Levels and Zones:
Wave Analysis:
The chart depicts a corrective wave pattern labeled as b, (B), and (C) .
Wave b is currently in progress and expected to complete in the zone of ₹1,645–₹1,658 . 📉
Target Zones:
First Target Zone: ₹1,785–₹1,795 🎯
Second Target Zone: ₹1,824–₹1,841 🎯
These levels are based on the completion of Wave (C) and represent potential upward targets.
Stop Loss (Day Close):
Suggested stop loss at ₹1,638 to manage risk in case Wave (C) fails to complete as anticipated. 🛑
Volume Analysis:
Volume bars indicate trading activity and can confirm the strength of price movements. 📊
📈 Trading Plan:
Entry:
Consider buying within the Wave (C) completion zone: ₹1,645–₹1,658 .
Expectation: Corrective wave completes in this zone, leading to upward movement.
Targets:
First Target: ₹1,785–₹1,795 🎯
Second Target: ₹1,824–₹1,841 🎯
Stop Loss:
Place a stop loss at ₹1,638 to limit downside risk. 🛑
Short-term Trading Opportunity:
These target zones are ideal for short-term swing trades or futures and options (FN) positions.
Conclusion:
This trading plan offers a strategic entry and potential profit zones based on Elliott Wave Theory. Monitor price action and volume closely for confirmation.
Disclaimer: This analysis is for educational purposes only. Conduct your own research or consult a financial advisor before trading.

Tech M Breaking out?Take look at tech mahindra breakout out of previous resistence
Also breaking out of channel
buy after retest
Buy 1430
Target 1600, 1800
SL 1350
Strctly for educational purpose

Tech mahindra - Double Top - Short setupTech Mahindra started reversing from double top zone which confluences with BAT harmonic pattern
Entry around 1730-1740. SL will be 1800, if price settles above this level in weekly timeframe
Can expect price to reach 1560 to 1410 levels.

TECHM Swing tradeHello,
Trend-Based Analysis. Buy the Dips, Sell The Rallies, Also Following the Trend. Let's see where the Price Action takes us, Riding the wave. Potential trade setups based on trend momentum.
Technical analysis based on trend identification and momentum, Looking for high-probability setups within the prevailing trend.
Analyzing the current market trend and potential future price movement. Focusing on risk management and reward-to-risk ratios.
Details is Mentioned in Chart, Read carefully.. .

50 SMA Rising- Positional TradeDisclaimer: I am not a Sebi registered adviser.
This Idea is publish purely for educational purpose only before investing in any stocks please take advise from your financial adviser.
Its 50 SMA Rising Strategy. Suitable for Positional Trading Initial Stop loss lowest of last 2 candles and keep trailing with 50 days SMA if price close below 50 SMA then Exit or be in the trade some time trade can go for several months.
Be Discipline because discipline is the Key to Success in the STOCK Market.
Trade What you see not what you Think

TechMahindra 6 Nov 24 Bullish RDMonthly BB Challenge Monthly MCBO
Weekly Bullish Harami
Daily Price above BB Median
Daily Bullish RD

Tech Mahindra - Long Setup (Swing Trade)Tech Mahindra has confirmed a breakout above the entry zone, setting up for a potential swing trade. Here’s the trade setup:
Entry Price: 1654.85 (Confirmed after the 15-minute candle broke above the entry zone at 1640.25 )
Target: 1785.05
Stop Loss: 1567.85 (Stop loss will be triggered if a daily candle closes below this level)
With the entry price confirmed at 1654.85 , the setup offers a favorable risk-to-reward ratio. The stock is targeting a move toward 1785.05 , with a well-defined stop loss at 1567.85 for risk management.
Disclaimer: This post is for educational purposes only and is not financial advice. Always manage your risk and trade responsibly.

perfect time to short Tech Mahindra?
after great rally even when markets were going down, sell signal has come in on AGR3.0. shoudl we take profit off and / take fresh short positions in the stock ?

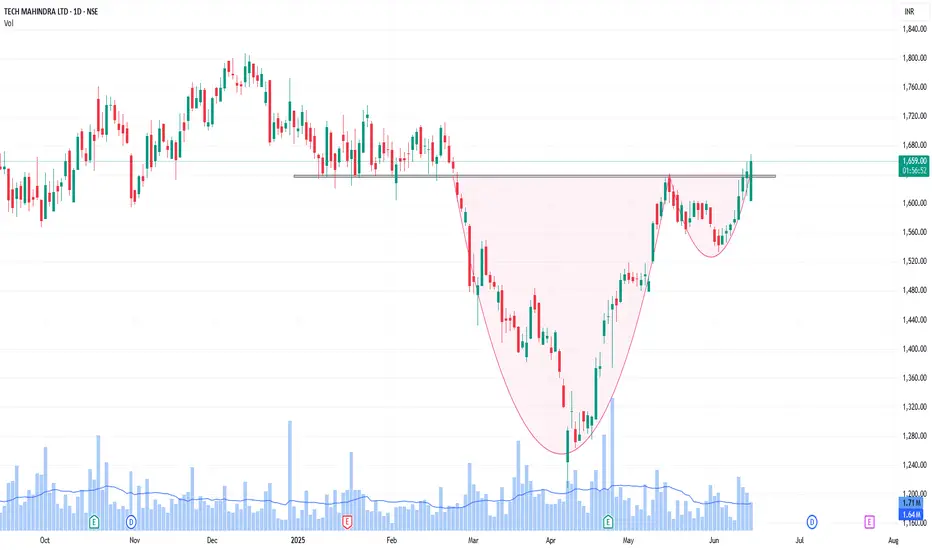
Tech mahindra (strongest in it)Tech mahindra is showing strength in this weak market it will be the first stock to run immediately after market condition improved.
Keep an eye on this stock for break out above 1673. its target will be very high. sl will be very small which is 1560.
this is positional trade first target will be All time high. and second target will be near 2700 within one year. if war situation in middle east eased.
it has gud potential for upside . Follow strict SL & Proper RISK REWARD RATIO. This is the only holy grail in the market.

TECHM - LONGNSE:TECHM Weekly chart showing holding emotions line intact still last 3 weeks nifty falls , while IT sector hold the levels. Looks like outperformance will continue near future.
