Tech Mahindra - Daily Movement In ChannelStock is trading in a Channel pattern...we can take trade as per support and resistance.
Already breakout given.. this may retest levels.
TECHM trade ideas

TECHM TF 15MINTECH M CHART IF CANDLE CLOSE WITH HIGH VOLUME WE CAN ENTRE BUT DONT ENTRE ON HUGE BULLISH CANDLE LOOK AT SMALLER TF THEN YOUR SL IS SMALL THEN ENTRE

TECH MAHINDRA BULLISH SIGNALHello Trader I Found TECH MAHINDRA In Bullish signal as we can see it broke its Resistance Area and it is taking as a Support Area. Stop loss is only of 20pt and its Target Is around 100 Pt its my view please do your own analysis before taking any action. If you like my analysis Please follow and like my chart as well. Thank You

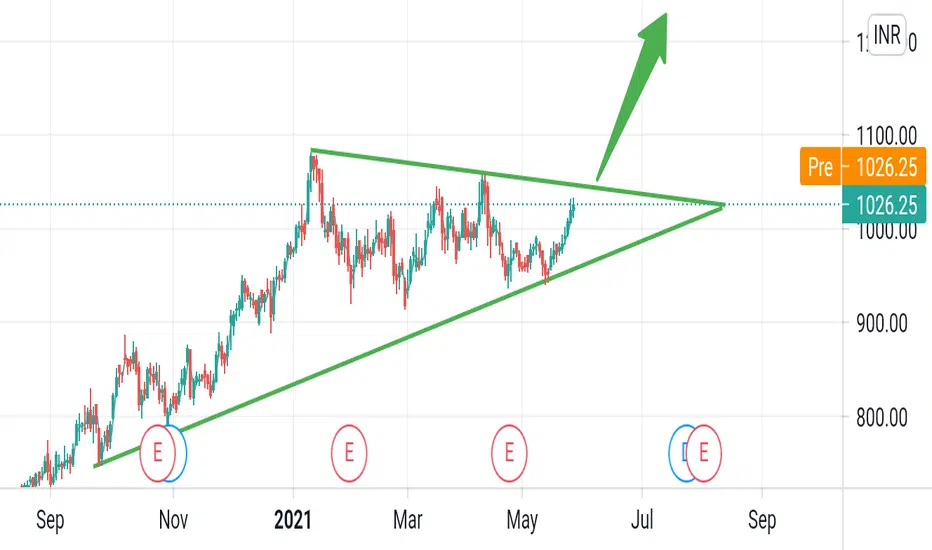
Tech mahindra ascending wedge break outTech mahindra ascending wedge breakout and retest done... strong bullish.. targets are mentioned in the chart


TECH MAHINDRA NEW UPTREND?Hi Everyone, Tech Mahindra after breakout of rounding bottom & all time high on 1W chart. Can go upto 1320 of level 2.414, harmonic ABCD pattern. The idea is to deploy 30% capital above 1110 & rest 70% capital deploy if comes back to test support. NSE:TECHM

TECHM Long - A Beautiful structureOne can go long in TECHM with reference levels mention in the chart.

Breakout from triangle patterntechm is looking good to move up after BO from triangle pattern.
CMP 1070
Target 1 1152
Target 2 1182
target 3 1323
This is an idea.

LONG ON TECHM,SWING TRADEAS PER CHART.TARGET 1W 1D
Tech Mahindra is an Indian multinational company that provides information technology and business process outsourcing services. A subsidiary of the Mahindra Group, the company is headquartered in Pune and has its registered office in Mumbai.


Tech Mahindra breakout on weekly timeframeTech Mahindra breakout on weekly timeframe.
Breakout from Flag pattern.


TECHM LONG INTRADAY 10 JUN,2021Dear trader,
If u look at the chart of TECHM (analysis based intraday only) the TECHM Buy at 1070 and Target at 1080
Best Buy at 1068.
Our Best Buy is based on high quality research and when the instrument reaches this level , it’s a jackpot trade.
Best Buy level might be executed or might not be executed.
The chart clearly indicates Bullish Trend you can also see the candle stick patters for more indepth analysis.
In Intraday most important thing is to enter and exit points.
Our signals are based on analytics, algorithms, mathematical derivatives.
Always be a responsible trader, kindly trade only when you have maximum opportunity in the market with minimum risk and with keynotes like data, analysis and proper strategies.
Kindly message us for strategies and analysis.

TECHM @ BUYTECHM is trading in a symmetrical triangle and breakout happened retest also done can go for buy


tech mbeautiful breakout after a a long consolidation.
rising adx value indicates upcoming momentum.
Bullish engulfing at the breakout candle.

TECHM... BULLISH Triangle pattern breakout.BUY @ 1055-1075
SL :- 1000
TGT1 :- 1145
TGT2 :- 1200
Disclaimer:- It is just for educational purpose. Trade consciously on your own.


Buildup at confluence region If the confluence region is broken with good volumes then it'll be a good buy.

Tech Mahindra trading ideasBig opportunity for long term investor buy above 1050 stock will headed up to 1500 big moment to come over IT sector very bullish future I see.
TARGET FOR TECH MAHINDRATech mahindra should take resistance now at 1040 level as it's trendline resistance if the momentum continues.

Wedge PatternStock Analysis: TechM has formed wedge pattern and taken support on bottom of the trendline as long as it is not breaking below that expected target are marked on the chart.
Let's see..
