UTIAMC ready to breakout NSE:UTIAMC is ready to breakout. You can buy at the current level and Target would be 1445.
Next report date
—
Report period
—
EPS estimate
—
Revenue estimate
—
45.95 INR
7.31 B INR
16.94 B INR
83.61 M
About UTI Asset Management Co. Ltd.
Sector
Industry
CEO
Imtaiyazur Rahman
Website
Headquarters
Mumbai
Founded
2002
ISIN
INE094J01016
FIGI
BBG00FN0T0S8
IPO date
Oct 12, 2020
IPO offer price
7.57 USD
UTI Asset Management Co. Ltd. engages in the provision of wealth management services. It involves in the management of offshore funds and provides support to the specified undertaking of the unit trust of India. The company was founded on November 14, 2002 and is headquartered in Mumbai, India.
Related stocks
UTIAMC in Multi Month BreakoutNSE:UTIAMC in Multi Month Breakout. You can enter at current Point. 1st target would be 1500 and with Trailing stop loss we can make a Second target of 1550.
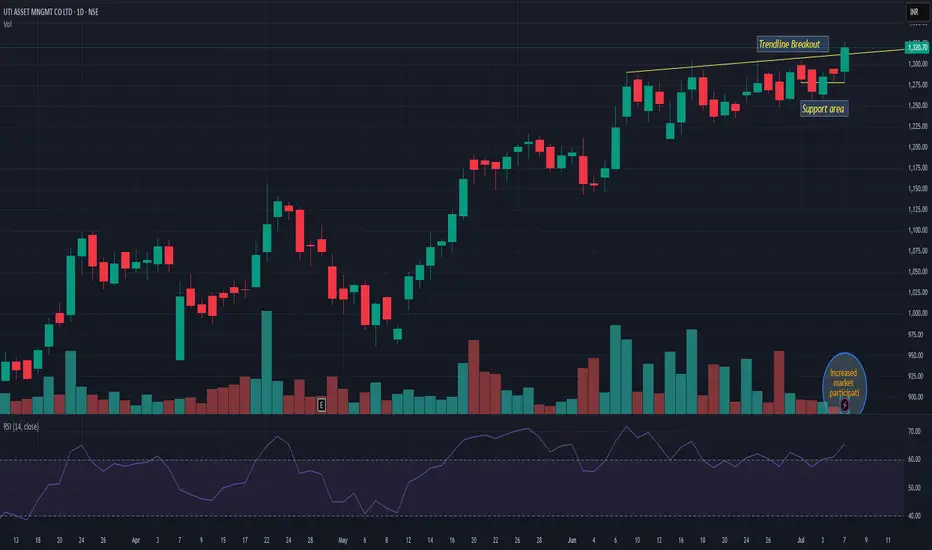
UTIAMCUTIAMC giving trend-line breakout with increased volume. It is trending just 5=7% away from ATH. 1250 seems strong support and on upper side it may trade above 12-15%. Keep it on radar
UTIAMCNSE:UTIAMC
One Can Enter Now ! Or Wait for Retest of the Trendline (BO) Or wait For better R:R ratio
Note :
1.One Can Go long with a Strict SL below the Trendline or Swing Low of Daily Candle.
2. Close, should be good and Clean.
3. R:R ratio should be 1 :2 minimum
4. Plan as per your RISK app

Value Buy. Monthly Breakout and RetestDouble Digit ROE and ROCE
PEG Ratio ~1
PE in buy zone
DII holdings increased in last quarter
EPS continuously increasing since last 6 quarters
Technical:
Monthly levels: Price retesting the earlier resistance and now support. From a long term perspective huge potential.
Note: Not SEBI registered.

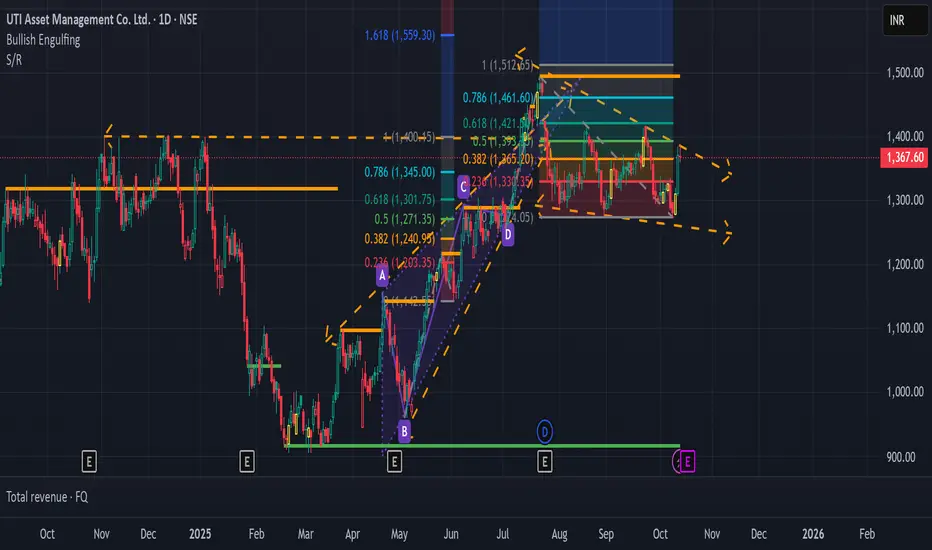
UTI ASSET MNGMT CO LTD SLRSupport and Resistance Levels:
Support Levels: These are price points (green line/shade) where a downward trend may be halted due to a concentration of buying interest. Imagine them as a safety net where buyers step in, preventing further decline.
Resistance Levels: Conversely, resistance levels (re

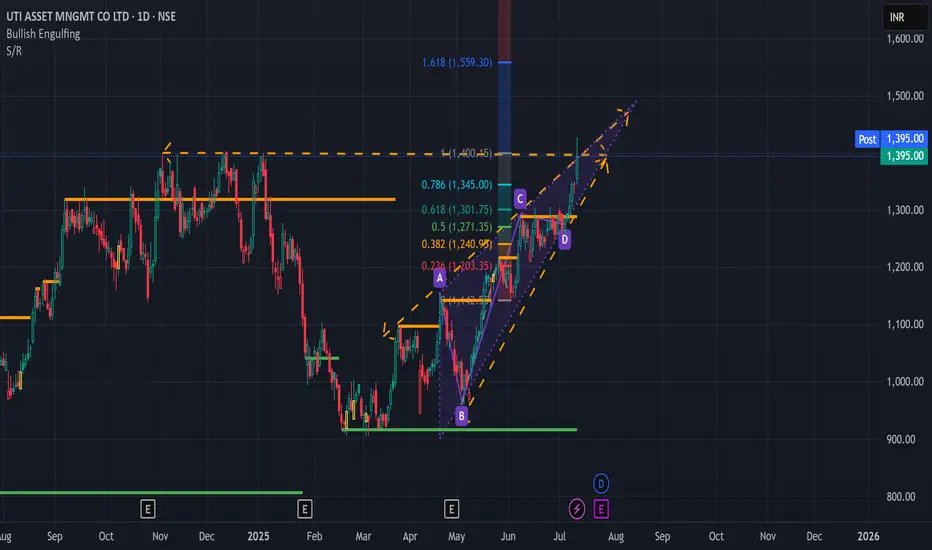
UTIAMC LongMy Template Suggesting me that: This Company is Going to Give a breakout, U can Enter Early; after 1310 Closing(weekly)
and the Left Table is Telling me: All the Fundamentals are Strong and Company is Generating Good Return Against major Indices or Commodities (in Weekly Chart)..
The Right Table is

#UTIAMC, Multi-Year Breakout#UTIAMC, A Multi-Year Breakout candidate, followed by a neat Pull-back and reassuring bounce on the back of high volumes.

UTIAMCUTI ASSET MNGMT CO LTD Has breakout 3 years resistance breakout
and retest that level TGT up to 1600
this is just for educational purpose only

LONGUTI AMC is a cheapest AMC , cup break out done, may retest . current PE 19.6 PEG ratio 1.15. Good reserves. safe bet at current price/average if retest the support line.

See all ideas
Summarizing what the indicators are suggesting.
Neutral
SellBuy
Strong sellStrong buy
Strong sellSellNeutralBuyStrong buy
Neutral
SellBuy
Strong sellStrong buy
Strong sellSellNeutralBuyStrong buy
Neutral
SellBuy
Strong sellStrong buy
Strong sellSellNeutralBuyStrong buy
An aggregate view of professional's ratings.
Neutral
SellBuy
Strong sellStrong buy
Strong sellSellNeutralBuyStrong buy
Neutral
SellBuy
Strong sellStrong buy
Strong sellSellNeutralBuyStrong buy
Neutral
SellBuy
Strong sellStrong buy
Strong sellSellNeutralBuyStrong buy
Displays a symbol's price movements over previous years to identify recurring trends.
SMALLCAP
Mirae Asset Nifty Smallcap 250 Momentum Quality 100 ETF Units Exchange Traded FundWeight
0.55%
Market value
439.38 K
USD
Explore more ETFs
Frequently Asked Questions
The current price of UTIAMC is 1,141.10 INR — it has decreased by −0.99% in the past 24 hours. Watch UTI Asset Management Co. Ltd. stock price performance more closely on the chart.
Depending on the exchange, the stock ticker may vary. For instance, on NSE exchange UTI Asset Management Co. Ltd. stocks are traded under the ticker UTIAMC.
UTIAMC stock has fallen by −0.31% compared to the previous week, the month change is a −13.13% fall, over the last year UTI Asset Management Co. Ltd. has showed a −13.08% decrease.
We've gathered analysts' opinions on UTI Asset Management Co. Ltd. future price: according to them, UTIAMC price has a max estimate of 1,700.00 INR and a min estimate of 965.00 INR. Watch UTIAMC chart and read a more detailed UTI Asset Management Co. Ltd. stock forecast: see what analysts think of UTI Asset Management Co. Ltd. and suggest that you do with its stocks.
UTIAMC reached its all-time high on Jul 22, 2025 with the price of 1,494.80 INR, and its all-time low was 471.10 INR and was reached on Oct 12, 2020. View more price dynamics on UTIAMC chart.
See other stocks reaching their highest and lowest prices.
See other stocks reaching their highest and lowest prices.
UTIAMC stock is 1.70% volatile and has beta coefficient of 1.62. Track UTI Asset Management Co. Ltd. stock price on the chart and check out the list of the most volatile stocks — is UTI Asset Management Co. Ltd. there?
Today UTI Asset Management Co. Ltd. has the market capitalization of 146.86 B, it has decreased by −0.46% over the last week.
Yes, you can track UTI Asset Management Co. Ltd. financials in yearly and quarterly reports right on TradingView.
UTI Asset Management Co. Ltd. is going to release the next earnings report on Feb 3, 2026. Keep track of upcoming events with our Earnings Calendar.
UTI Asset Management Co. Ltd. revenue for the last quarter amounts to 3.90 B INR, despite the estimated figure of 4.01 B INR. In the next quarter, revenue is expected to reach 3.98 B INR.
UTIAMC net income for the last quarter is 1.13 B INR, while the quarter before that showed 2.37 B INR of net income which accounts for −52.29% change. Track more UTI Asset Management Co. Ltd. financial stats to get the full picture.
UTI Asset Management Co. Ltd. dividend yield was 2.47% in 2024, and payout ratio reached 45.35%. The year before the numbers were 2.95% and 39.84% correspondingly. See high-dividend stocks and find more opportunities for your portfolio.
As of Nov 28, 2025, the company has 1.84 K employees. See our rating of the largest employees — is UTI Asset Management Co. Ltd. on this list?
EBITDA measures a company's operating performance, its growth signifies an improvement in the efficiency of a company. UTI Asset Management Co. Ltd. EBITDA is 9.13 B INR, and current EBITDA margin is 66.21%. See more stats in UTI Asset Management Co. Ltd. financial statements.
Like other stocks, UTIAMC shares are traded on stock exchanges, e.g. Nasdaq, Nyse, Euronext, and the easiest way to buy them is through an online stock broker. To do this, you need to open an account and follow a broker's procedures, then start trading. You can trade UTI Asset Management Co. Ltd. stock right from TradingView charts — choose your broker and connect to your account.
Investing in stocks requires a comprehensive research: you should carefully study all the available data, e.g. company's financials, related news, and its technical analysis. So UTI Asset Management Co. Ltd. technincal analysis shows the sell today, and its 1 week rating is sell. Since market conditions are prone to changes, it's worth looking a bit further into the future — according to the 1 month rating UTI Asset Management Co. Ltd. stock shows the neutral signal. See more of UTI Asset Management Co. Ltd. technicals for a more comprehensive analysis.
If you're still not sure, try looking for inspiration in our curated watchlists.
If you're still not sure, try looking for inspiration in our curated watchlists.