VEDL trade ideas

Expecting correction in VedantaHi All
Please go through the video and ask any questions which you might be having. Thanks.

VEDANTA - VEDLVEDL has managed to cross the hurdle of 297-300 from where in 2018 it had fallen to the lows.
Now it can be a long for new targets of 323, 335 and further 347
stop loss of 297-300
******************************************************************************************************************************************************************
Hi all,
Its pleasure to have you all here.
I have started putting these charts as a contribution from my side to all people who are new to business, as I had to struggle a lot without any sources at disposal. So please consider this a just small contribution from my side.
Few Honest Disclosures:
1. Any idea shared is my personal view, its not a recommendation, neither any kind of paid propaganda, so please
do your bit of research.
2. Ideas shared does not mean that I trade all or have position in them, this is just a helping hand to all.
3. I expect no comments or like nor any negativity, as I said its just a small helping hand from my side, please plan your risk and trade as per your capacity.
4. To trade in Cash, options or futures is your sole choice and your own risk
5. I am no expert in Tech Indicators, I believe in support resistance and trendline theory, you may use this as a supplement theory for better results.
6. I work for my own living, this is a hobby which I do sincerely to help anyone who might come across my charts.
***********************************************************************************************************************************************


Vedanta - Inverted Head & ShoulderStock has formed inverted head and shoulder in 1 hour time frame and the sector has closed on a positive note. So next trading session it can be bullish if the market supports.


Vedanta Channel Break OutBreaking the Trendline
Above-average volume
MACD cross-Over
RSI touching 60
Entry = 272
SL = 261
Target - 1 = 298
Target - 2 = 340

BUY VEDL (VEDANTA LTD) IN WEEKLY www.tradingview.com
PRICE : 188 TO 195
STOP LOSE : 173.9
TARGET : 221, 237, 258


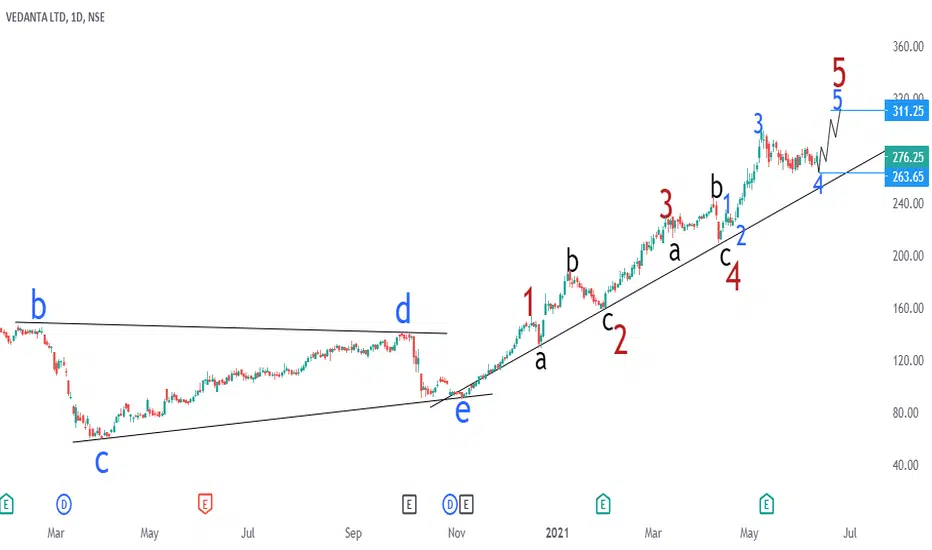
VEDL wave analysisvedanta is in wave 4 correction of big wave 5,final wave 5 rally towards 311 is pending

VEDANTA Looks Good - Can try for 300Weekly trendline breakout can take Vedanta To new ATH.
After 300 it can go in a single direction.
Risk reward is favorable.


VEDL :: BULLISHATE: 6 JUNE 2021
INSTRUMENT: VEDL
TREND: BUY
TIME FRAME: DAY
CMP: 280.85
BUY ABOVE: 283
STOP LOSS: 269
TGT 01: 296
DISCLAIMER:
We are not S E B I registered analysts. Please consult your personal financial advisor before investing. We are not responsible for your profits/losses whatsoever.
Leave a comment that is helpful or encouraging. Let's master the markets together

VEDL About to flyCheck out for VEDL about to fly. If It goes above the 300 , This would be mutli year break out. This can double in notime.


Vedanta looks bullish for investing perposeHey guy's vedanta at is very good position to buy, if they break treadline than go for long and if they break thripal buttom support then go for short .

VEDL, 1DOnce after triangle breakout trend taking support and will rally towards MP 304
Analysis for educational purpose alone.


Long Vedanta above 275 for target 310+ before expiryVedanta has seen good correction from upper levels.....weekly indicators are positive and according to fibonnaci retracement the points of retracement for 1st support have already been reached around 265.40 levels.....this stock can show strong reversal from this point and targets for week may be 300 while for shorts term of 2-3 months around 340-350 levels. Buying is recommended at current level . sl-264.80
