#VEDL - Ready for breakoutVedanta - it just broke the previous down trend channel marginally. Confirmation will be at strong break of 288.40 for a nice swing to 295 - 300 - 318 (strong resistance), break of which can take to 338 +. Current support levels 278 - 276 - 267 - 248.
Short term positive (week and medium term (1Qtr) also positive.
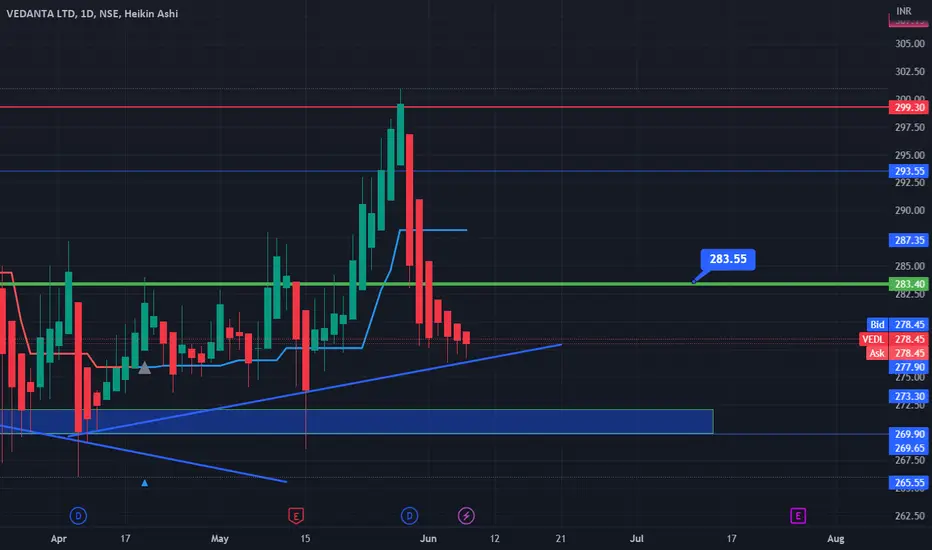
VEDL trade ideas

VEDL : WATCHOUT FOR TRENDLINE BREAKOUTNSE:VEDL is near its Downtrend line. Trade can only be taken after candle closing above the trendline

VEDL BUY
We have a Super strong Fundamentals as they have recently acquired the semiconductor firm.
Also the Price has reacted to a Weekly Demand and Now has also started violating Supplys and respecting Demands hence Buying as the Reward to Risk ratio is favourable.

VEDL-HOURLY/DAILY-AT SUPPORT LEVELSNSE:VEDL
Stock is consolidating between 275-285 from past a month. From past few days (Last week of June) The stock is getting seller pressure however it is not able to close below 275. It’s a sign of strength that buyers are defending this level.
Today Stock has shown a bullish hammer around the support level. It’s good time to go long with Small SL.
SL 273-274 , Target would be as per the risk reward.
This is only for educational purpose, please manage your risk accordingly.

VEDL BUY NOW
Price has reacted to a Weekly Demand and has confirmed an Uptrend as per the Daily chart,
Yesterday Price gave a pullback into a Daily Demand with an amazing reward for the risk.
ENJOY THE RIDE ! ! !

Vedanta Vedanta is at critical support now standing at one of the Fann angles which has been its support for a long time
By forming HL, it is expected to bounce back from next week onwards considering the bullishness in the metal sector.

VEDANTA ONE LAST BUY BEFORE THE FALL! ! !
Price has a Monthly Supply formed and has to reach it in order to continue the downtrend,
Therefore we have a Weekly Demand which will drive the Price till the Monthly Supply area, the Reward to Risk ratio is 3:1
ENJOY THE RIDE ! ! !

VEDL_07.06.2023Again VEDL on trend. Watch the lines for probable reversal. For educational purpose only.
#VEDL... Looking good 23.05.23#VEDL.. ✅▶️
Intraday as well as swing trade
All levels given in charts ...
IF good potential seen then we work in options also
if activate then possible a huge movement Keep eye on this ...
We take trade only when it activates...
Possible to give good target
TRADING FACTS

#Vedl Hourly break out Small SL Tgt - 305#vedl - hourly break out - very small SL - short term trade.
PS :Only for learning purpose.


VEDLMay touch 293 levels, in hope of good dividend. Result expected as per our team's research seems to be at neutral to negative. For study purpose only.

VEDLVedanta 1h break out chance to upside moment. if down side break the chances are less for risk reward ratio...

Vedanta PROS
Stock is providing a good dividend yield of 28.5%.
Company has delivered good profit growth of 28.8% CAGR over last 5 years
Company has a good return on equity (ROE) track record: 3 Years ROE 25.3%
Company has been maintaining a healthy dividend payout of 32.6%
CONS
Promoters have pledged 100.0% of their holding.
Notes.- This chart only for knowledge purpose not for trading

vadnata ltd long vdl is in demand zone of day tf
can be long in the given 259-263 zone
stop loss day closing below 253 and closing of real body not wicks :))
targets 286 and 294

VEDANTA : Break Rising Wedge Pattern Vedanta Ltd. Stock on Daily TF wee can see that Stock had trend change from 9th Feb' 23.Broken the Rising wedge Pattern with high volume on 9th Feb. & now continue the downside journey. Stock weak on short & long term momentum.
Entry : CPM
SL : 307
Downside move : 288,276

VEDL: Bullish BATVEDL: Bullish BAT
PRZ: 288.63 - 292.62
Tgt: 300, 308, 313
Note: Created for testing pattern..

Trendline Breakdown in Vedanta Limited...Chart is self explanatory.
Disclaimer: This is for demonstration and educational purpose only. This is not buying or selling recommendations. I am not SEBI registered. Please consult your financial advisor before taking any trade.

VEDL ShortVEDL has broken the long term trend line. Has got a support line at 275. We can expect it to rebound from there else it can go to 255-260.

VEDL Stock Retraces to Rejection Area After Breaking SupportVedanta Limited (VEDL) stock has broken below its support level and has since retraced back up to a key rejection area. This rejection area may indicate that the price is being rejected at this level, suggesting that it may continue to move downwards in the near term. Traders and investors should closely monitor the price action around this area for potential trading opportunities. Factors such as news events and market conditions may also impact the price of VEDL stock, and should be taken into consideration when making trading decisions.

Vedanta is Must Buy for Long Term.Vedanta is Trading Below its book value.
So its a good time to buy VEDL for the target of 730.
Its a must buy stock for long term investors.
Buy in my opinion you will never regret it.
Good Luck.

VEDLVedl is ready for breakout
RSI support zone
Bb support
Macd crossover
Fibonacci -61%
Buy above cross the high

VEDL On Its Way To A ReversalVEDL had previously crossed below it's swing low marking a downtrend but it has since held onto the level and tested its swing high twice. Stock can turn bullish after crossing the level.
