VEDLNSE:VEDL
Please note that we are not a SEBI Registered Investor Adviser/PMS/ Broking House.
All the contents over here are for educational purposes only and are not investment advice or recommendations
offered to any person(s) with respect to the purchase or sale of the stocks / futures and options.
You are also requested to apply your prudence and consult your advisers in case you choose to act on
any such content available as WE claims no responsibilities for any of your actions or any outcome of
such action
VEDL trade ideas
Metals are Shining; Review 14th Feb 2022Please find my review of Metals sector. This is a ongoing review of sector and stock performance.
Regards
AAsta

VEDANTA 20% in 13 dayshi vedanta give 20% in 13 days
may be give more in future
best stock for swing trade
try your luck

Vedantha( VEDL ) Long patternAs per price action analysis, Vedantha broke the daily support. It's a ascending triangle pattern . It already broke out.

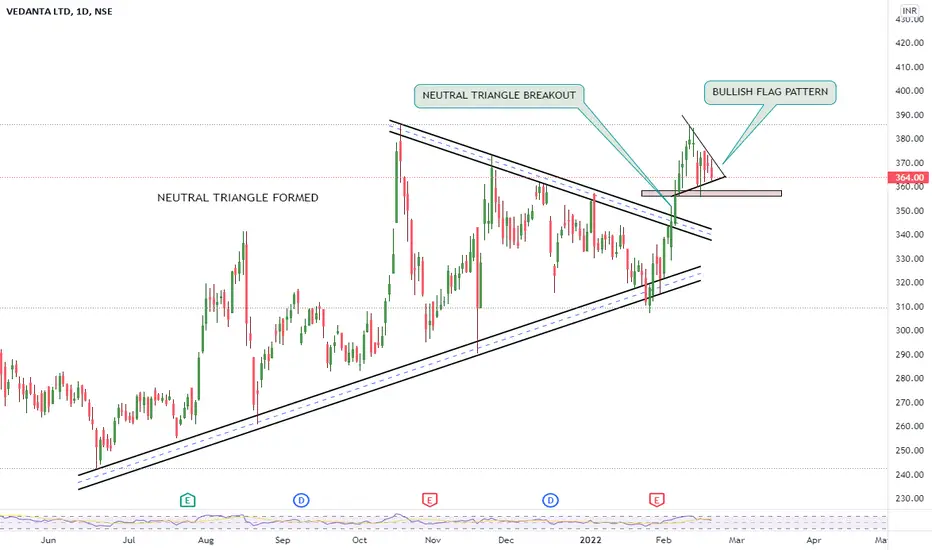
VEDANTA LTD 1:4 PRICE ACTION SETUPNSE:VEDL broke out from a symmetrical triangle pattern after consolidating in it for 4 months.
Bullish signs:
Good breakout volume.
Very few wide range red candles inside the pattern.
Recent support from 30 week EMA.
Strong demand at the trendline indicates the possibility of price going higher.
Scrip has already given a 140% returns in the last year.
Wick on the breakout candle suggest there can be some consolidation before the momentum is released.
One can take a swing trade with a tight stoploss and aim for a 1:4 risk reward setup.
BEWARE, THE PROBABILITY OF THIS TRADE BEING SUCCESFULL IS ENITRELY DEPENDANT ON THE TREND OF NIFTY. IF NIFTY CONTINUES TO BE BEARISH, THE STOP LOSS WILL BE HIT WHETHER IT BE A TIGHT ONE OR A DEEP ONE.
One can just keep this stock on their watchlist instead of entering on the close.
Targets: 400/430/470+
Place tight sl below 330
Position size accordingly if an entry is taken. HAPPY TRADING!

VEDL BUY ABOVE 363, TRAGET +++VEDL BUY FOR SWEING ACCORDING TO ME ITS BUYING OPPORTUNITY ABOVE 363..... do your analysis before buy

vedl buy 333. T 340,350,360looking for buy abouv 333 target 340,245,350,+ do your analylisis before entry

VEDL Good levels on WEEKLY timeframe . Double Bottom , for smaller TF refer linked chart in Comment Section


Vedanta waiting for breakout Vedanta waiting for a triangle pattern breakout. please observe the movement.

...vedl reausl is about to come in 28th jan before that we can expect a good move and can achive 5% return in matter of 2-3 days

Vedl 1D tfVedanta ltd stock entered into triangle pattern from channel pattern. Now breakout failure happened. It may give good breakout in the coming days


Bullish symmetrical triangle pattern Vedanta 16 jan 22
A symmetrical triangle chart pattern represents a period of consolidation before the price is forced to breakout or breakdown. A breakdown from the lower trendline marks the start of a new bearish trend, while a breakout from the upper trendline indicates the start of a new bullish trend.
Symmetrical triangle formation
If closes above 350 then
CMP 336
T1 360
T2 370
T3 385
T4 440
For Education purposes only

VEDANTA MAKE OR BREAK LEVEL ?Vedanta is making a bearish engulfing candle stick pattern on top in weekly chart frame. It is also touching its multiyear resistance line and Negative RSI Divergence. Only for educational purpose.

vedlNSE:VEDL
Please note that we are not a SEBI Registered Investor Adviser/PMS/ Broking House.
All the contents over here are for educational purposes only and are not investment advice or recommendations
offered to any person(s) with respect to the purchase or sale of the stocks / futures and options.
You are also requested to apply your prudence and consult your advisers in case you choose to act on
any such content available as WE claims no responsibilities for any of your actions or any outcome of
such action

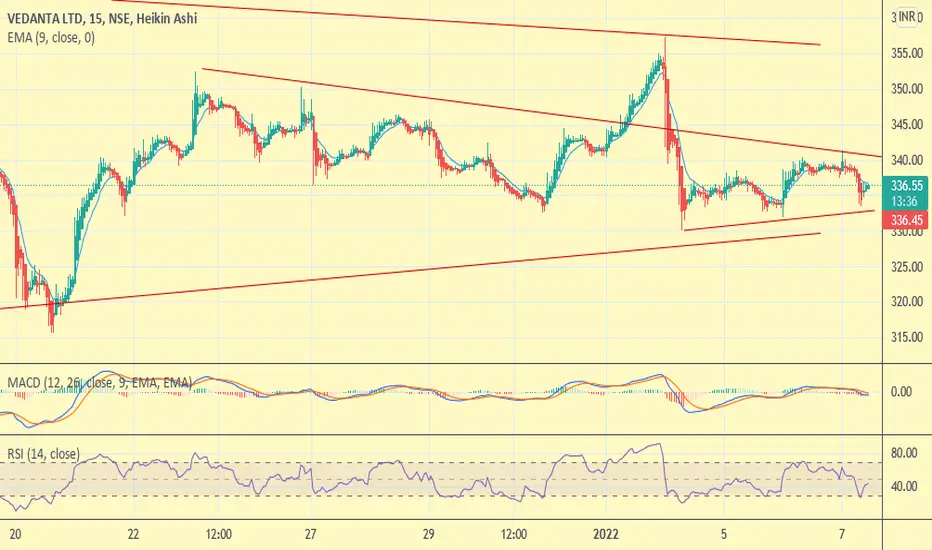
VEDL is looking bullish for swing tradeThere is a symmetrical triangle pattern formation in VEDL. It is creating higher lows from the bottom and lower highs from the top. Previously also it created the same pattern and gave a huge up move after the break of it. So, we can enter this stock at 336 and put our stop loss below the trendline. The point here to note is that we are entering the trade before the breakout as we are getting a good risk to reward opportunity. We can square off half our quantity as the price reaches the above trendline and trail our stop loss. And if the breakout happens then we can add more quantity.

VEDANTA--BUYascending triangle breakout expected target of 354 , 360 ,366. buy with a small stop of 327

SYMMETRICAL TRIANGLE IN VEDL NEARING POC - WATCHOUT !!!Symmetrical Triangle headed for Point of Convergence in Vedanta. Upside breakout likely, given the prior uptrend. Rec buy above 360.
All levels marked in Chart. Cheers !!

GYANEE-VEDANTA LTD ACCUMULATEION ZONEGYANEE- Vedanta ltd again forming a consolidation zone can be traded with very less risk

VEDANT LTD long termWe might get a good returns in 1-2 year, ig
buy now for long term
Has the potential for 500₹ in several months
but one is thing is for It will rise cant say its 500 or 450 but it will
happy investment :)


vedanta--stuck in a rangevedanta is stuck in a range of 340 to 332 one of the better stock for swing traders sell if closes below 330 buy if closses above 341 , till then do your swing trade