Next report date
—
Report period
—
EPS estimate
—
Revenue estimate
—
24.95 INR
234.22 B INR
1.85 T INR
4.74 B
About NTPC Limited
Sector
Industry
CEO
Gurdeep Singh
Website
Headquarters
New Delhi
Founded
1975
IPO date
Oct 7, 2004
Identifiers
2
ISIN INE733E01010
NTPC Ltd. engages in the generation of electric power in coal based thermal power plant. It operates through the Generation of Energy and Others segments. The Generation of Energy segment involves the generation and sale of bulk power to State Power utilities. The Others segment includes provision of consultancy, project management and supervision, energy trading, oil and gas exploration, and coal mining. The company was founded on November 7, 1975 and is headquartered in New Delhi, India.
Related stocks

NSE – NIFTY 750 | NTPC Limited | 06 Feb 2026Monthly structure view as part of the NIFTY 750 Structure Census.
Long phase of range behaviour followed by post-2020 regime shift
Impulse structure observed from 2020 lows
Current phase: higher-range consolidation
Rising structural support remains intact
This chart reflects market stru

NTPC – Pre-emptive Upside Turnaround Setup🟦 NTPC – Pre-emptive Upside Turnaround Setup
NTPC is showing early signs of a potential upside turnaround. This is still a pre-emptive structure, so discipline matters more than speed.
📊 Technical View
• Trading in a range of ₹350–₹370
• Box breakout likely above ₹370 (range held since April 2025)

NTPC | Buy @LTP or 350 | SL below 315| Targets 360, 421Disclaimer (Please Read Carefully):
This is not investment advice. The stocks shared here are purely for educational and informational purposes. Please do your own research or consult with a financial advisor before making any investment decisions.
*************************************************

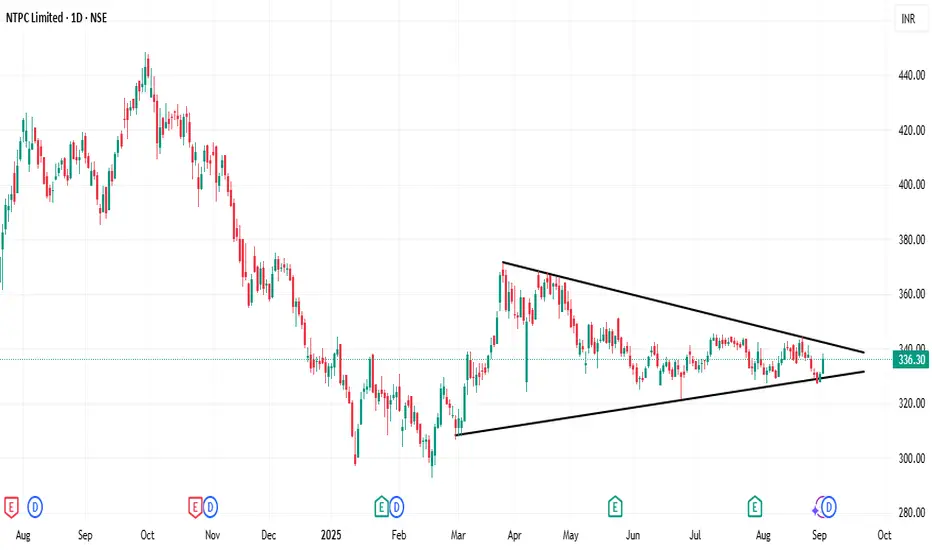
NTPC - Symmetrical Triangle PATTERN BREAKOUT [ SELL Side ]I am not a SEBI-registered investment advisor. The information provided here is for educational and informational purposes only and should not be construed as financial or investment advice. Please do your own research or consult with a SEBI-registered financial advisor before making any investment

NTPC, 1D, Long, ResistanceNTPC is near its resistance zone of 350. If it cross 350 and sustains it with Bullish Candle then it can give target of 360 and 370.
Entry: 350
Target1: 360
Target2: 370

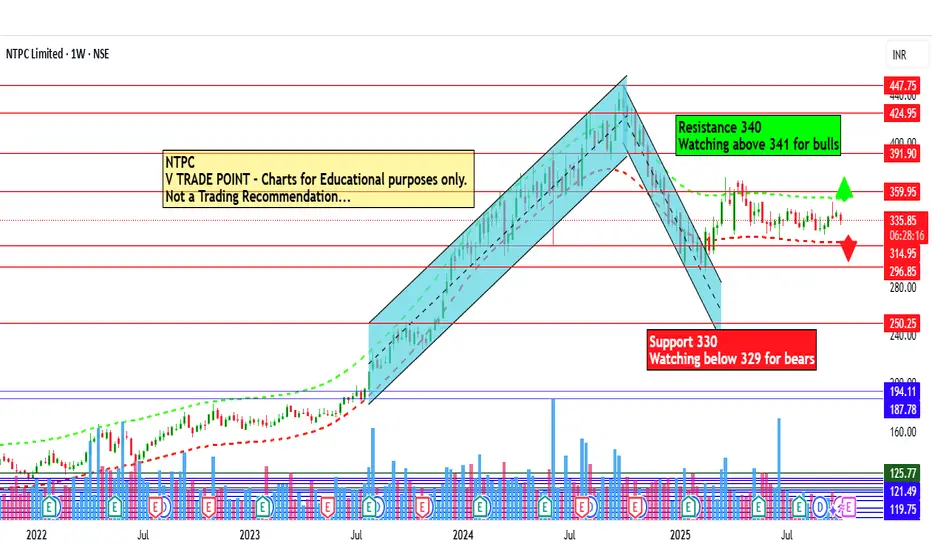
NTPC Ltd for 10th Oct #NTPC NTPC Ltd for 10th Oct #NTPC
Resistance 340 Watching above 341 for upside momentum.
Support area 330 Below 335 gnoring upside momentum for intraday
Watching below 329 for downside movement...
Above 335 gnoring downside move for intraday
Charts for Educational purposes only.
Please follow strict
NTPC / 09.10.2025 / LONGThis share may give 4% Profit, if Entry order triggered after I posted.
Take position as per your risk reward ratio and that is not recommended, only for educational purposes.

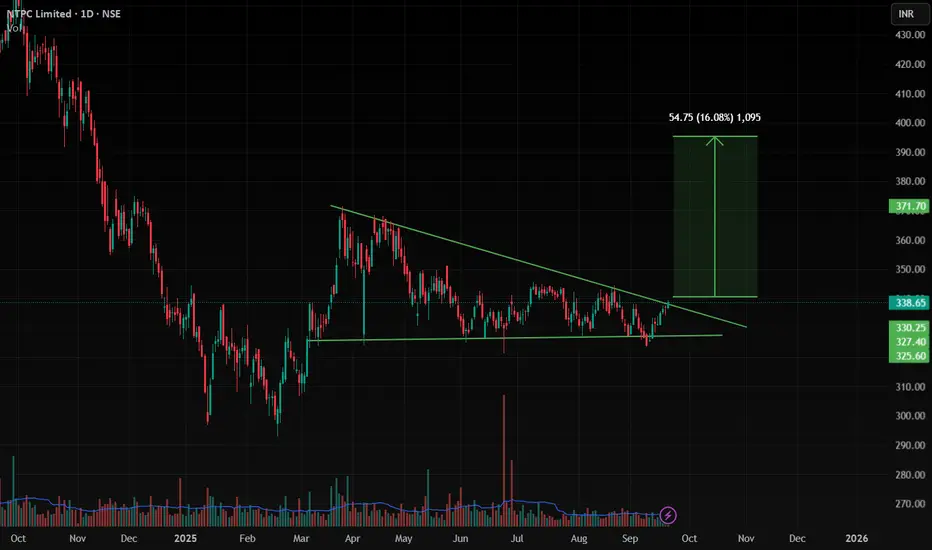
NTPC , Daily Breakout In this stock we clearly see the Triangle pattern is formed and Ready for Breakout , Wait for candle Close in 1D with good volume , then we can see very good move up to 15% nearly .
As now nifty is given Breakout from 1D Channel pattern and in Market Breadth 1D has given breakout and in weekly mark
NTPC Swing Trade Setup📊 Price Action & Trend Analysis
Analyzing market trends using price action, key support/resistance levels, and candlestick patterns to identify high-probability trade setups.
Always follow the trend and manage risk wisely!
Price Action Analysis Interprets Market Movements Using Patterns And Trend
See all ideas
Summarizing what the indicators are suggesting.
Neutral
SellBuy
Strong sellStrong buy
Strong sellSellNeutralBuyStrong buy
Neutral
SellBuy
Strong sellStrong buy
Strong sellSellNeutralBuyStrong buy
Neutral
SellBuy
Strong sellStrong buy
Strong sellSellNeutralBuyStrong buy
An aggregate view of professional's ratings.
Neutral
SellBuy
Strong sellStrong buy
Strong sellSellNeutralBuyStrong buy
Neutral
SellBuy
Strong sellStrong buy
Strong sellSellNeutralBuyStrong buy
Neutral
SellBuy
Strong sellStrong buy
Strong sellSellNeutralBuyStrong buy
Displays a symbol's price movements over previous years to identify recurring trends.
Frequently Asked Questions
The current price of NTPC is 365.05 INR — it has decreased by −0.53% in the past 24 hours. Watch NTPC Limited stock price performance more closely on the chart.
Depending on the exchange, the stock ticker may vary. For instance, on NSE exchange NTPC Limited stocks are traded under the ticker NTPC.
NTPC stock has risen by 1.69% compared to the previous week, the month change is a 4.43% rise, over the last year NTPC Limited has showed a 13.16% increase.
We've gathered analysts' opinions on NTPC Limited future price: according to them, NTPC price has a max estimate of 459.00 INR and a min estimate of 325.00 INR. Watch NTPC chart and read a more detailed NTPC Limited stock forecast: see what analysts think of NTPC Limited and suggest that you do with its stocks.
NTPC reached its all-time high on Sep 30, 2024 with the price of 448.45 INR, and its all-time low was 58.35 INR and was reached on Nov 5, 2004. View more price dynamics on NTPC chart.
See other stocks reaching their highest and lowest prices.
See other stocks reaching their highest and lowest prices.
NTPC stock is 1.66% volatile and has beta coefficient of 0.86. Track NTPC Limited stock price on the chart and check out the list of the most volatile stocks — is NTPC Limited there?
Today NTPC Limited has the market capitalization of 3.56 T, it has increased by 1.66% over the last week.
Yes, you can track NTPC Limited financials in yearly and quarterly reports right on TradingView.
NTPC Limited is going to release the next earnings report on May 15, 2026. Keep track of upcoming events with our Earnings Calendar.
NTPC earnings for the last quarter are 5.25 INR per share, whereas the estimation was 5.39 INR resulting in a −2.60% surprise. The estimated earnings for the next quarter are 8.82 INR per share. See more details about NTPC Limited earnings.
NTPC Limited revenue for the last quarter amounts to 432.42 B INR, despite the estimated figure of 457.75 B INR. In the next quarter, revenue is expected to reach 502.05 B INR.
NTPC net income for the last quarter is 54.89 B INR, while the quarter before that showed 50.67 B INR of net income which accounts for 8.33% change. Track more NTPC Limited financial stats to get the full picture.
NTPC Limited dividend yield was 2.33% in 2024, and payout ratio reached 34.57%. The year before the numbers were 2.31% and 36.11% correspondingly. See high-dividend stocks and find more opportunities for your portfolio.
As of Feb 6, 2026, the company has 142.92 K employees. See our rating of the largest employees — is NTPC Limited on this list?
EBITDA measures a company's operating performance, its growth signifies an improvement in the efficiency of a company. NTPC Limited EBITDA is 547.19 B INR, and current EBITDA margin is 29.35%. See more stats in NTPC Limited financial statements.
Like other stocks, NTPC shares are traded on stock exchanges, e.g. Nasdaq, Nyse, Euronext, and the easiest way to buy them is through an online stock broker. To do this, you need to open an account and follow a broker's procedures, then start trading. You can trade NTPC Limited stock right from TradingView charts — choose your broker and connect to your account.
Investing in stocks requires a comprehensive research: you should carefully study all the available data, e.g. company's financials, related news, and its technical analysis. So NTPC Limited technincal analysis shows the buy rating today, and its 1 week rating is strong buy. Since market conditions are prone to changes, it's worth looking a bit further into the future — according to the 1 month rating NTPC Limited stock shows the strong buy signal. See more of NTPC Limited technicals for a more comprehensive analysis.
If you're still not sure, try looking for inspiration in our curated watchlists.
If you're still not sure, try looking for inspiration in our curated watchlists.