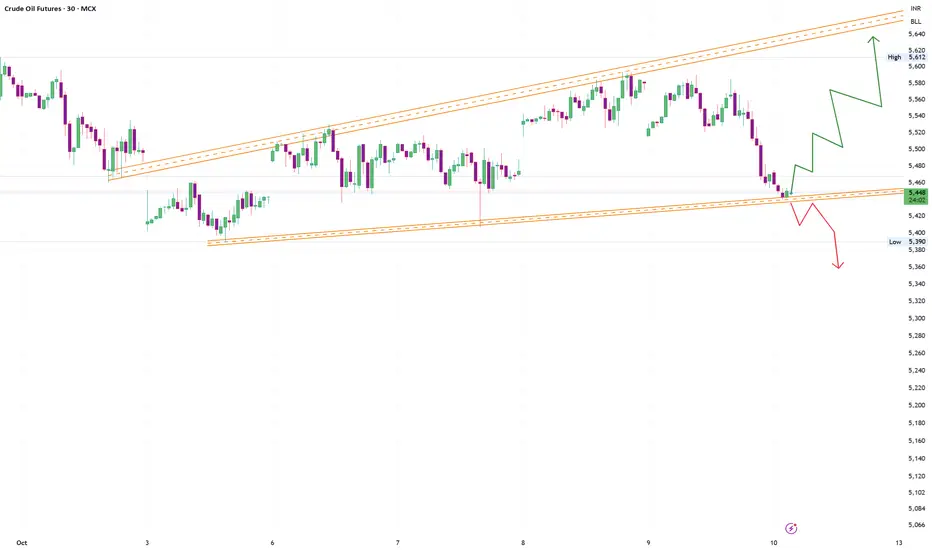
Crudeoil probable price projection1. if takes support may push the price up
2. if breaks it may push the price to lower side
261! trade ideas
CRUDE OILPreferably suitable for scalping and accurate as long as you watch carefully the price action with the drawn areas.
With your likes and comments, you give me enough energy to provide the best analysis on an ongoing basis.
And if you needed any analysis that was not on the page, you can ask me with a comment or a personal message.
Enjoy Trading ;)
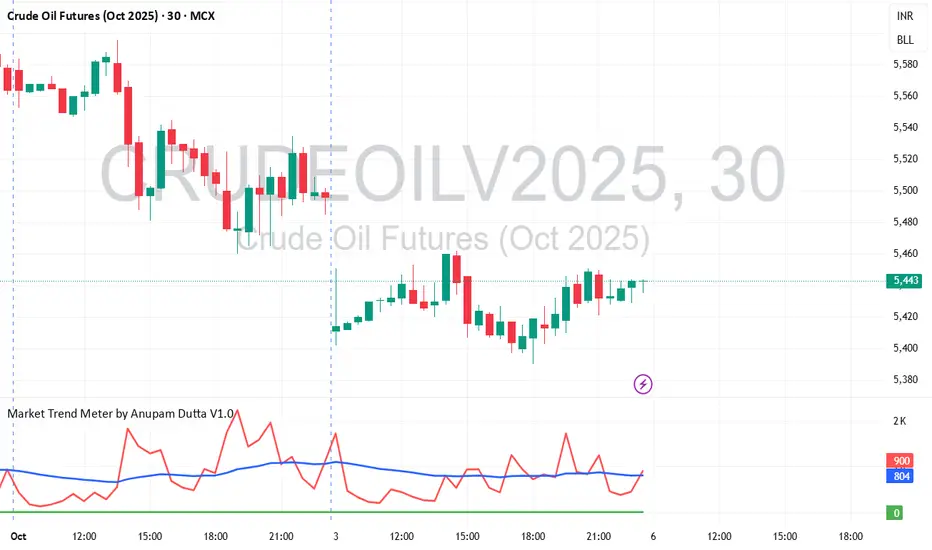
MCX CRUDE: Showing Traces of a bounce bk RallyMCX CRUDE: Trading at around 5600 has given Golden EMA Cross over in 30Min chart .
Major Resistance lies at 5700 -5800.
Close above 5800 likely to trigger a rally towards 6400 whereas 5400 likely to act as the crucial support.
Drifting below its 5400 likely to test 5100 its June ,2025.My bias is positive and buy on dips for 5700/5800/6000+(For educational purpose only)
CRUDE OILPreferably suitable for scalping and accurate as long as you watch carefully the price action with the drawn areas.
With your likes and comments, you give me enough energy to provide the best analysis on an ongoing basis.
And if you needed any analysis that was not on the page, you can ask me with a comment or a personal message.
Enjoy Trading ;)
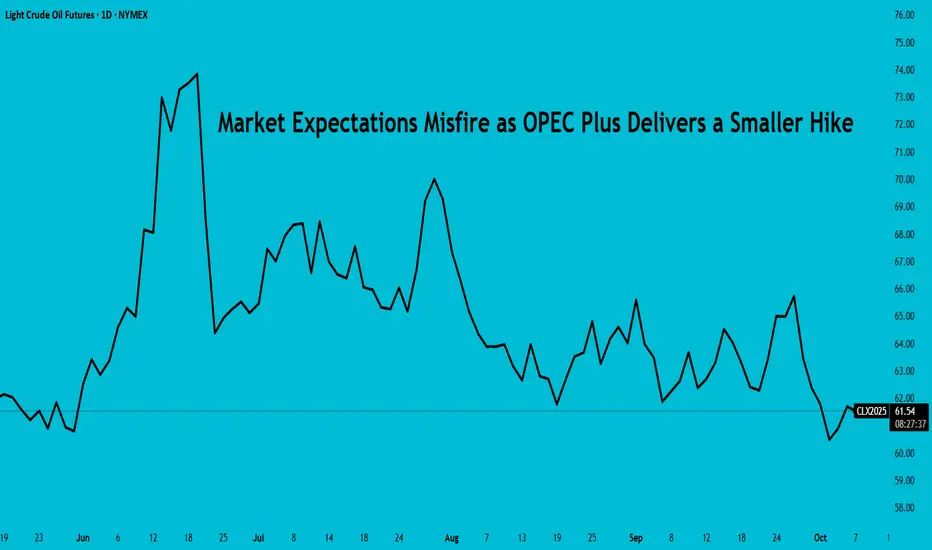
Market Expectations Misfire as OPEC Plus Delivers a Smaller HikeOPEC+ surprised markets on 05/Oct (Sun) with a smaller-than-expected output hike, triggering a rebound in crude prices the following day. In contrast, WTI had trended lower the previous week amid expectations of a larger supply increase, rising U.S. inventories, and cautious sentiment.
This paper examines the volatility surrounding OPEC+ meetings, highlighting how market expectations often diverge from actual decisions, driving sharp price swings and uncertainty.
WTI HIT 4-MONTH LOW ON OPEC+ HIKE SPECULATION
WTI crude oil futures fell 7.4% in the week ending on 03/Oct, with prices falling for four consecutive sessions between 29/Sep – 02/Oct. The decline was driven by expectations of a significant increase in OPEC+ supply.
OPEC+ surprised markets by announcing a modest 137,000 bpd output hike for November, matching October’s increase.
The markets initially anticipated a much larger adjustment for November, with speculation centering on a potential 500,000 bpd hike as Saudi Arabia pushed to regain market share.
Although OPEC dismissed media reports on X of such a move as “misleading,” traders continued to price in the possibility of a sizeable increase.
Source: CME Group OPEC+ Watch Tool as of markets on 3rd October 2025
Notably, CME’s OPEC Watch tool reflected a bearish sentiment on 03/Oct (Fri).
Source: CME Group OPEC+ Watch Tool as of markets on 3rd October 2025
Until 26/Sep, the consensus leaned toward a pause or small hike. However, since then, expectations for a moderate or significant increase rose sharply, adding further downward pressure on crude prices.
Nonetheless, the cartel’s decision was a surprise. According to Reuters , this was caused by internal disagreements between Russia and Saudi Arabia.
Russia pushed for a smaller hike to avoid pressuring prices, as sanctions limit its ability to raise output. Saudi Arabia, with ample spare capacity, preferred a larger increase to regain its market share more quickly.
Overall, OPEC+ maintained a positive outlook on the global economy, citing steady growth, healthy market fundamentals, and low oil inventories.
LOW INVENTORIES AND SOFTER U.S. OUTPUT OFFER SUPPORT FOR WTI
Amid expectations of a larger OPEC+ supply hike, WTI also faced pressure from cautious market sentiment as the U.S. government shutdown persisted, and weak economic data weighed on demand outlook.
However, prices found support from persistently low U.S. crude inventories, which remain well below the five-year average and near the lower end of the historical range.
Source: EIA
Despite a slight weekly build, overall supply conditions remain tight. With WTI prices easing, U.S. production has also edged lower, a trend that could further restrict inventory growth and lend near-term support to crude prices.
CONCLUSION
OPEC+ controls more than half of the global oil supply, making its output decisions a major driver of crude prices.
Source: CME’s CVOL Index
Since the group began unwinding supply cuts in 2025, each meeting has triggered noticeable price swings, underscoring the market’s sensitivity to these decisions.
Source: TradingView
While mapping price direction is challenging, options allow traders to gain exposure without directly owning the commodity. They provide flexibility to capitalise on increased volatility around OPEC+ meetings.
The following examples illustrate how options can be strategically used:
Long Call : Seeing the inventory lag, a trader could have taken a bullish stance on the OPEC meeting outcome through a long call on WTI Crude Monday weekly options. On 02/Oct (Thu), the option had settled at USD 0.77 per barrel, implying a premium of USD 770 per lot (contract size = 1,000). By 06/Oct (Mon), after a bullish OPEC outcome had lifted crude prices, the option traded at USD 1.12 per barrel as of 4 AM ET. A single-lot position would have gained USD 350 (USD 1,120 – USD 770). This showed a strong return relative to risk, with losses limited to the premium paid. It underscored how weekly options allowed precise positioning around specific events.
Long Put : Expecting a strong output hike from OPEC+, a trader could have taken a long put position on WTI Crude Monday weekly options. On 02/Oct (Thu), the option had settled at USD 1.07 per barrel, or USD 1,070 per lot (contract size = 1,000 barrels). By 06/Oct (Mon), after OPEC+ announced a smaller-than-expected output hike, the option traded at USD 0.01 per barrel as of 4 AM ET. A single-lot position would have lost USD 1,060 (USD 1,070 – USD 10). Although the trade resulted in a loss, the downside was limited to the option premium. In contrast, holding a futures position in the same direction would have led to significantly larger losses.
Overall, options allow traders to participate in volatile price movements while keeping potential losses limited, making them a valuable tool for strategic positioning around uncertainty.
This content is sponsored.
MARKET DATA
CME Real-time Market Data helps identify trading set-ups and express market views better. If you have futures in your trading portfolio, you can check out on CME Group data plans available that suit your trading needs tradingview.com/cme .
DISCLAIMER
This case study is for educational purposes only and does not constitute investment recommendations or advice. Nor are they used to promote any specific products, or services.
Trading or investment ideas cited here are for illustration only, as an integral part of a case study to demonstrate the fundamental concepts in risk management or trading under the market scenarios being discussed. Please read the FULL DISCLAIMER the link to which is provided in our profile description.
OIL FALLPreferably suitable for scalping and accurate as long as you watch carefully the price action with the drawn areas.
With your likes and comments, you give me enough energy to provide the best analysis on an ongoing basis.
And if you needed any analysis that was not on the page, you can ask me with a comment or a personal message.
Enjoy Trading ;)

Crudeoil Probable price levelsCrudeoil price tested 5400 -5450 levels many times.
1. if buyers couldnt support the level then the pirce moves down.
2. if buyers defend the position then the price moves up.
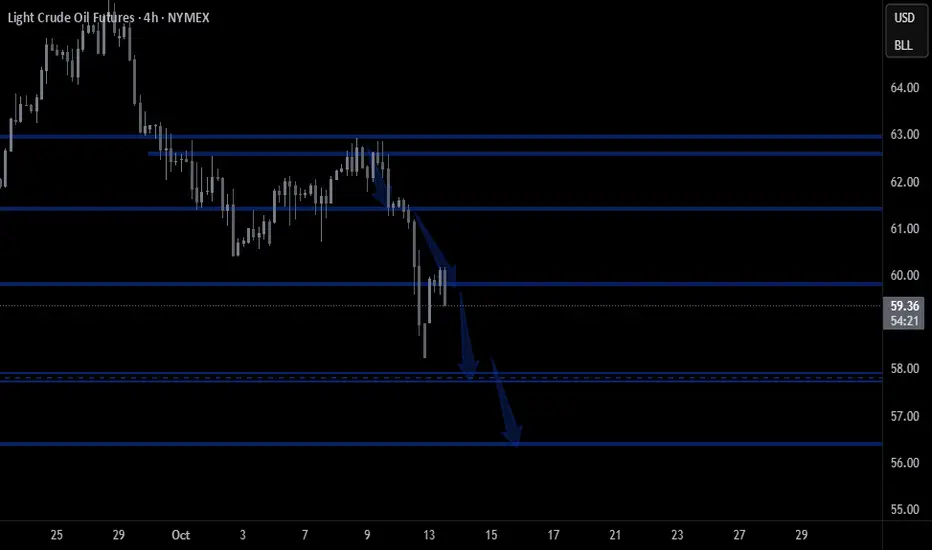
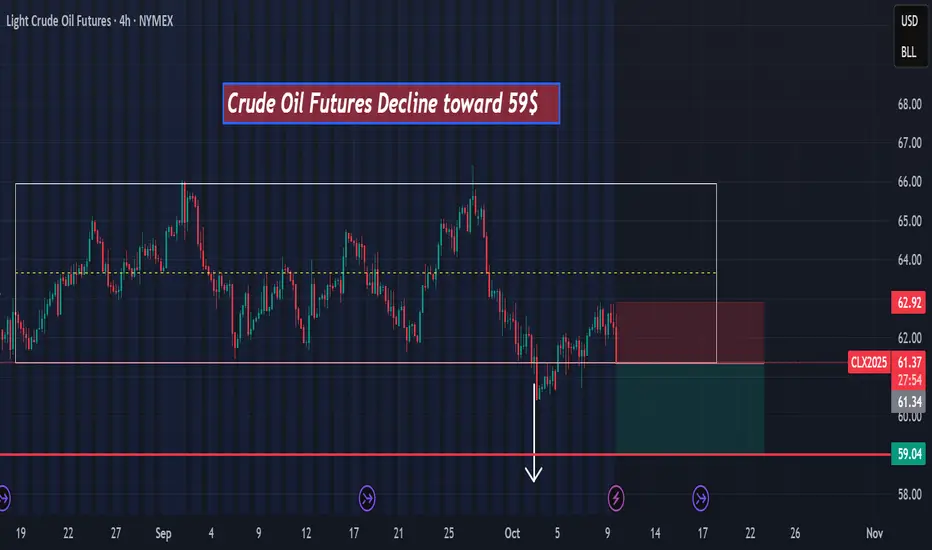
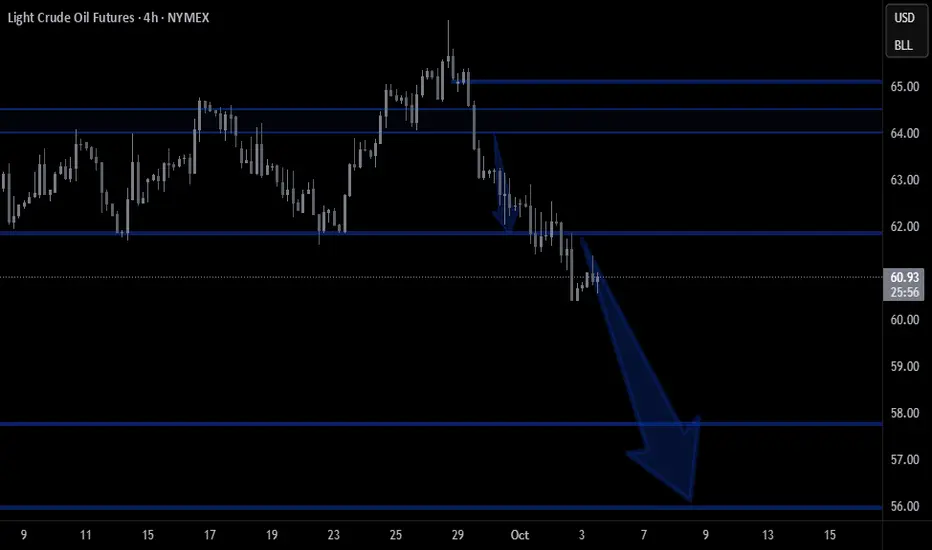
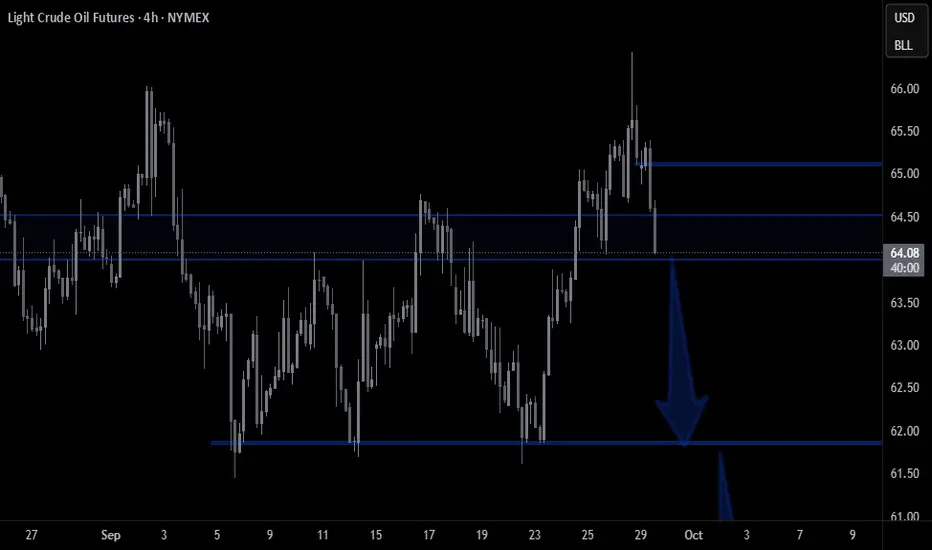
Crude oil future Decline toward 59$hello,
According to my technical analysis, there is a high probability of a decline toward $59 in the next few hours for two main reasons:
-A breakout below the support level.
-A pullback retesting that broken support.

Crude oil decline toward 59$hello,
According to my technical analysis, there is a high probability of a decline toward $59 in the next few hours,
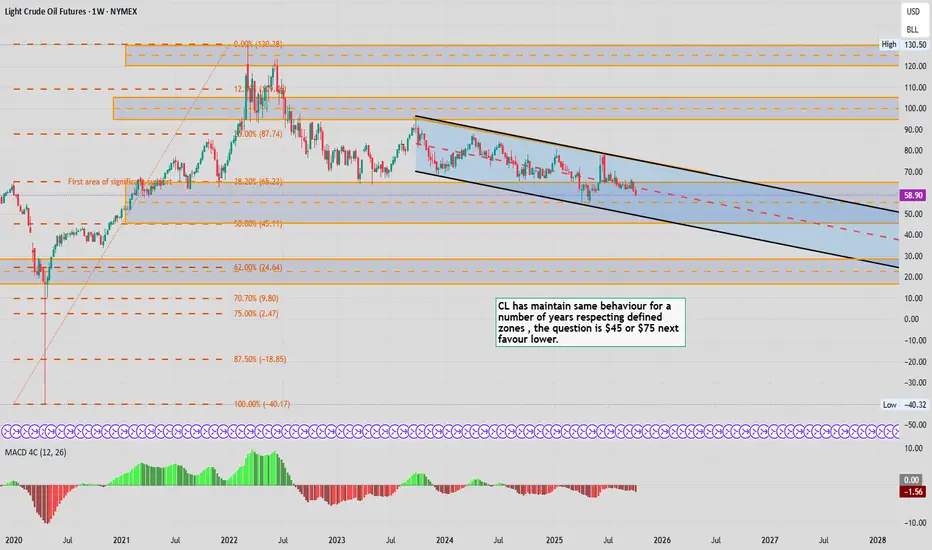
Updating Last months CL chart CL been behaving within defined ranges for the longest time and do not see anything changing just yet, and look like we willprobe lower in the short term
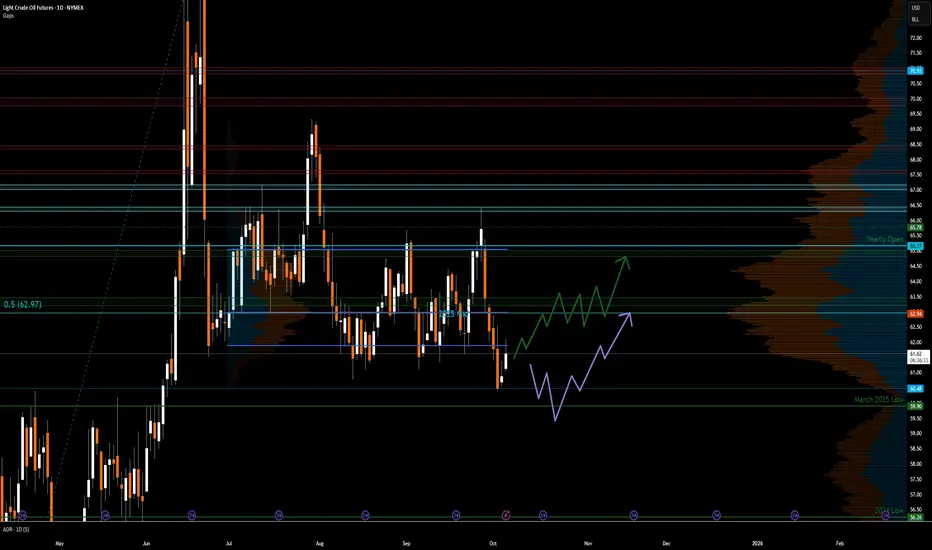
Macro Recap & Crude Oil Trade SetupNYMEX:CL1! NYMEX:MCL1!
Markets Overview
Markets have largely shrugged off the U.S. government shutdown, with major indices pressing to fresh all-time highs. While the headline optimism continues, it’s important to note that over one million federal employees remain furloughed, leading to delays in key economic data releases and potential short-term distortions in macro readings.
Despite the Atlanta Fed GDPNow model projecting stronger growth, underlying household dynamics suggest stress ahead. Lower-income consumers, already contending with tighter credit and depleted savings, are likely to see further deterioration in spending and sentiment, which may weigh on Q4 consumption trends.
Market Positioning & Flows
While equities appear to be in a new leg of the bull market, positioning data suggests this may not be entirely organic. According to publicly available data many hedge funds continue to under-perform the S&P 500, forcing catch-up buying after missing the April lows. This dynamic may also be contributing to the current momentum-driven equity strength, even as macro headwinds persist.
Metals Performance
Precious metals have been standout performers year-to-date, reflecting declining real yields and persistent inflation hedging flows:
• Gold: +42.46% YTD
• Silver: +56.88% YTD
• Platinum: +71.29% YTD
(Source: Finviz YTD Futures Performance)
This rally underscores a broader rotation toward real assets, consistent with expectations of lower real interest rates and a weaker U.S. dollar trajectory.
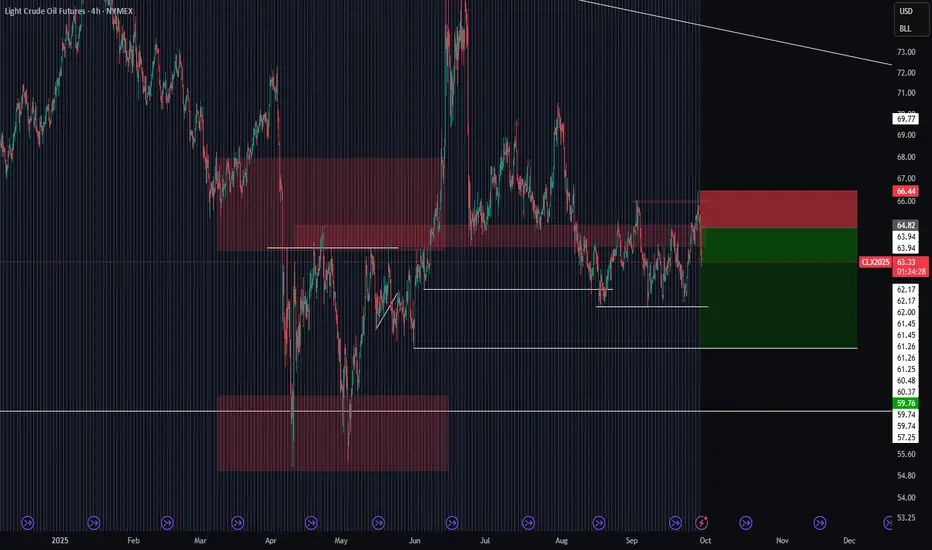
Crude Oil Technical & Trade Setup
Crude oil prices reached $66.42 in September before retracing lower. The recent OPEC+ announcement of additional voluntary cut unwinding at a pace of 137 kbpd for November adds a modest supply-side loosening.
From a technical perspective, price action has bounced at the yearly Volume Profile’s Value Area Low (VAL), a key area of structural support.
Current positioning shows:
• Price trading below Q2 VAL
• Price trading above yearly VAL (yVAL)
Scenario 1: Long on Reclaim of Q2 VAL
• Setup: Watch for crude to confirm acceptance back above the Q2 VAL as a support level.
• Trigger: Long entry on confirmation of acceptance above VAL.
• Target:
o First target: 2025 mid-range at $62.97
o Secondary target: Yearly open at $65.17
Scenario 2 : Long on Deeper Retest
• Setup: Should price reject Q2 VAL, patience is warranted.
• Entry Zone: Wait for price to move lower toward yVAL and March 2025 low confluence.
• Target: Return move toward 2025 mid-range ($62.97).
Despite near-term noise from policy uncertainty and supply adjustments, the broader technical structure favors accumulation on weakness rather than chasing momentum.
Crude remains range-bound but biased for upside stabilization into Q4, supported by resilient demand and disciplined OPEC+ management.
MCX Crude Oil Options (16th Oct Expiry)MCX Crude Oil Options (16th Oct Expiry)
Buy 5400 Call option only if price breaks above 188.60
Target: 208.60
Trade must activate tomorrow (6th Oct 2025), else the view is canceled.
Once activated, target remains valid till 15th Oct session.
📌 Disclaimer: This is a directional view, not a recommendation. Do your own analysis before taking any position.
#crudeoil
CL oil & Inflation are cooling-off towards $55!1). Corrective wave 4 is likely over! 2). MACD is divergent, as price inches up 3). Retail candle is an indecisive spinning top. 4). Overall correction needs a wave 5 south. 5). Volume is dropping. 6). Oil is an Inflation barometer, which is dropping. 7).I've been analyzing charts for over 20 yrs. as my strategies "trend" to be very accurate! A lot of effort goes into this, so please consider a "Boost".

CRUDE OILPreferably suitable for scalping and accurate as long as you watch carefully the price action with the drawn areas.
With your likes and comments, you give me enough energy to provide the best analysis on an ongoing basis.
And if you needed any analysis that was not on the page, you can ask me with a comment or a personal message.
Enjoy Trading ;)
Oil Playing Twister: Triple Bottom or Quadruple Pretzel?A Triple Bottom Walks Into a Bar…
Crude Oil (CL) has been busy doing something traders love and hate at the same time: building bottoms. First, it carved a neat Triple Bottom on the daily chart — textbook stuff. Everyone lined up at 66.68 waiting for the breakout champagne to pop.
But what did price do? Instead of exploding higher, it slammed on the brakes and took a detour straight back to support. Typical CL — always keeping traders on their toes.
Now we’re staring at the possibility of a Quadruple Bottom. Not a typo. Yes, they exist, but you don’t see them every day. Like spotting a unicorn in Times Square.
Why We Care About 66.68
That level isn’t just random. It’s the line where:
The Triple Bottom neckline lives.
The Supertrend upper band hangs out.
And, conveniently, the breakeven of our options spread sits.
In other words: get above 66.68 and suddenly this setup has wings. Target? Around 70.63, where UFO resistance is waiting to greet us.
The Fun Part: Bull Call Spread
Instead of swinging a giant futures bat and risking unlimited pain, we play it smarter with a Bull Call Spread:
Buy the 65 Call (Nov-17)
Sell the 71 Call (Nov-17)
Pay about 1.75 points (≈ $1,750 per standard spread, ≈ $175 if you go micro).
That’s it. Risk capped, reward mapped. Max loss? $1,750. Max gain? $4,250.
And yes, the breakeven is… drumroll… 66.8. Same line as the chart breakout. Love when math and pictures line up.
Plot Twist: Cheaper Now, But…
Here’s the kicker: because price dipped back into support, the spread might actually be cheaper right now. Sounds good, right?
But there’s a catch. Waiting for the breakout confirmation could make the spread pricier later, shrinking your reward-to-risk. Classic trading dilemma: do you want cheaper tickets with less confirmation, or more expensive tickets after the bouncer checks your ID?
Risk in 3 Sentences
Keep your trade size sane.
Don’t marry the setup if price dumps below the bottoms.
If CL rushes toward 70, take the money and run (or at least roll the short strike higher).
Bottom Line
Crude Oil is still building its base. Maybe it’s a Triple Bottom. Maybe it becomes the rare Quadruple Bottom collectors dream about. Either way, the play is the same: breakout above 66.68, aim for 70.63, and do it with a defined-risk Bull Call Spread that doesn’t keep you up at night.
Sometimes the market is dramatic. That’s why we trade it. 🎭
Want More Depth?
If you’d like to go deeper into the building blocks of trading, check out our From Mystery to Mastery trilogy, three cornerstone articles that complement this one:
🔗 From Mystery to Mastery: Trading Essentials
🔗 From Mystery to Mastery: Futures Explained
🔗 From Mystery to Mastery: Options Explained
When charting futures, the data provided could be delayed. Traders working with the ticker symbols discussed in this idea may prefer to use CME Group real-time data plan on TradingView: www.tradingview.com - This consideration is particularly important for shorter-term traders, whereas it may be less critical for those focused on longer-term trading strategies.
General Disclaimer:
The trade ideas presented herein are solely for illustrative purposes forming a part of a case study intended to demonstrate key principles in risk management within the context of the specific market scenarios discussed. These ideas are not to be interpreted as investment recommendations or financial advice. They do not endorse or promote any specific trading strategies, financial products, or services. The information provided is based on data believed to be reliable; however, its accuracy or completeness cannot be guaranteed. Trading in financial markets involves risks, including the potential loss of principal. Each individual should conduct their own research and consult with professional financial advisors before making any investment decisions. The author or publisher of this content bears no responsibility for any actions taken based on the information provided or for any resultant financial or other losses.

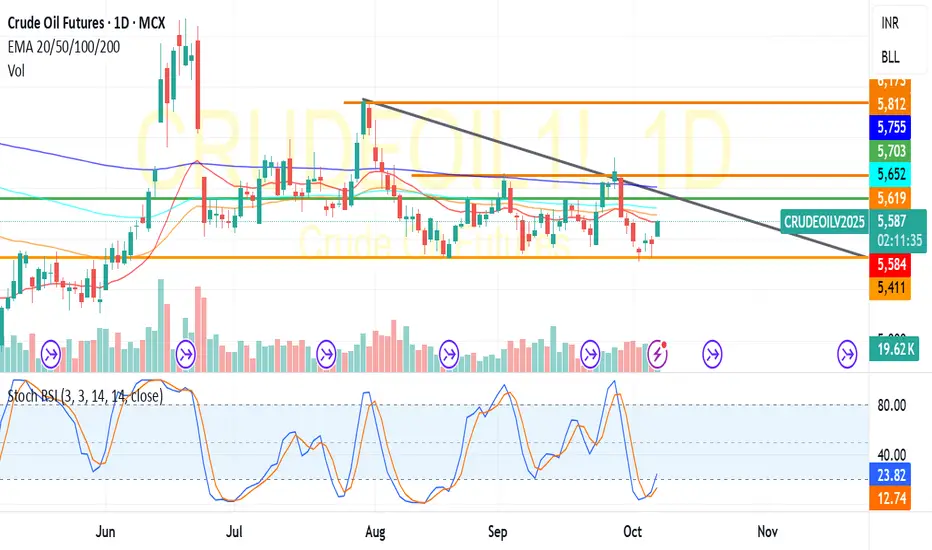
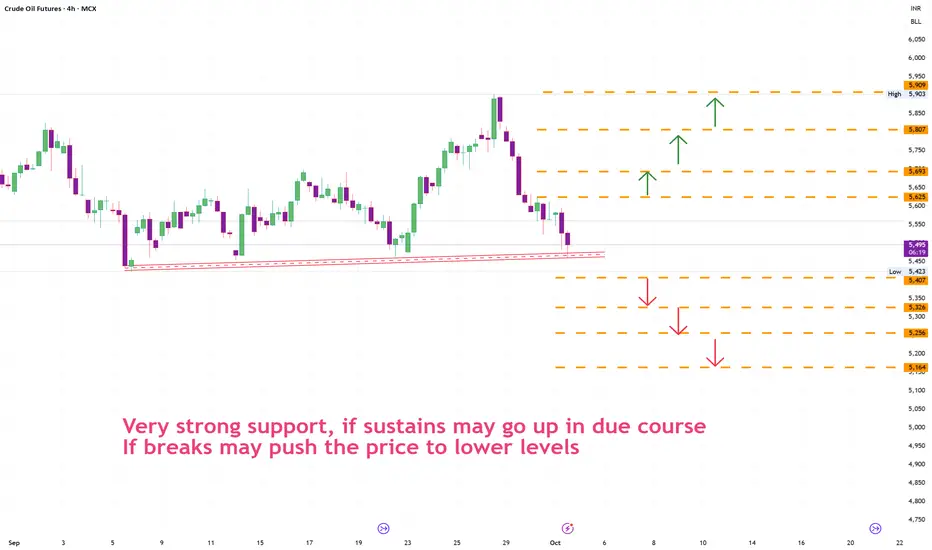
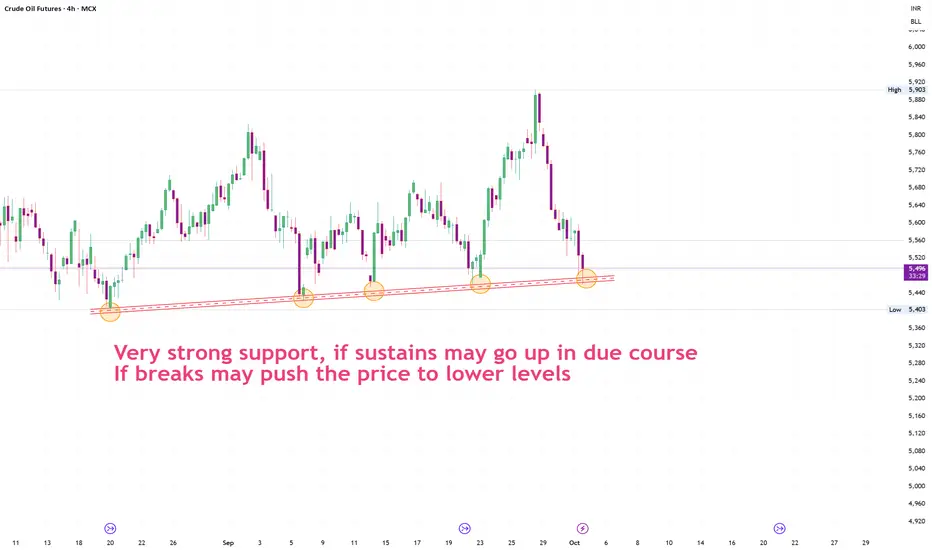
CureOil at support levelCrudeoil price depends on global scenario , as we see crudeoil is at Very strong support,
1. if sustains above the support may go up in due course
2. If breaks may push the price to lower levels
CRUDE OILPreferably suitable for scalping and accurate as long as you watch carefully the price action with the drawn areas.
With your likes and comments, you give me enough energy to provide the best analysis on an ongoing basis.
And if you needed any analysis that was not on the page, you can ask me with a comment or a personal message.
Enjoy Trading ;)

OILPreferably suitable for scalping and accurate as long as you watch carefully the price action with the drawn areas.
With your likes and comments, you give me enough energy to provide the best analysis on an ongoing basis.
And if you needed any analysis that was not on the page, you can ask me with a comment or a personal message.
Enjoy Trading ;)
[CL] USOIL Trade ideaI can even see a target much lower but fondamentally for now I am not sure it will be reasonable ... let's adapt to the market conditions.
Great Trade !
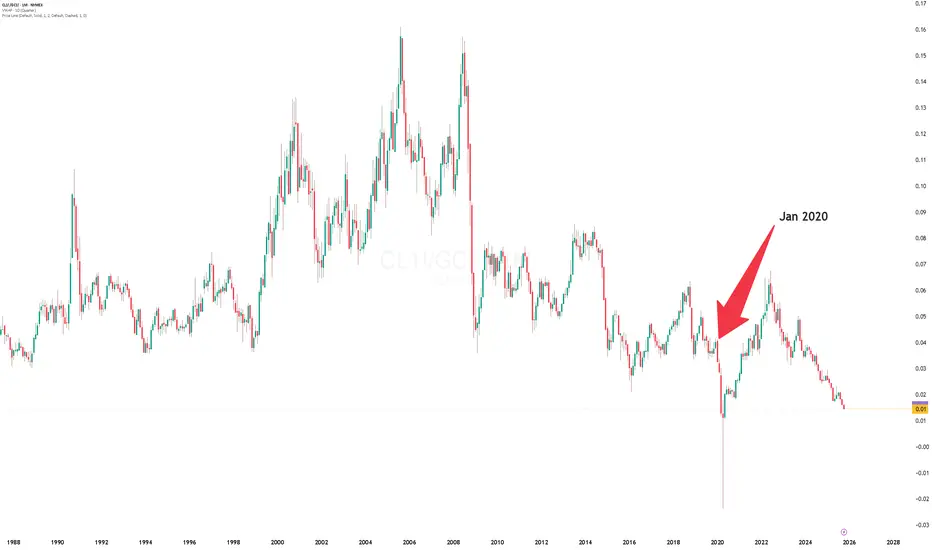
Oil/ Gold relative value chart. Back to early pandemic levels of value here, no doubt driven by outstanding gold performance.
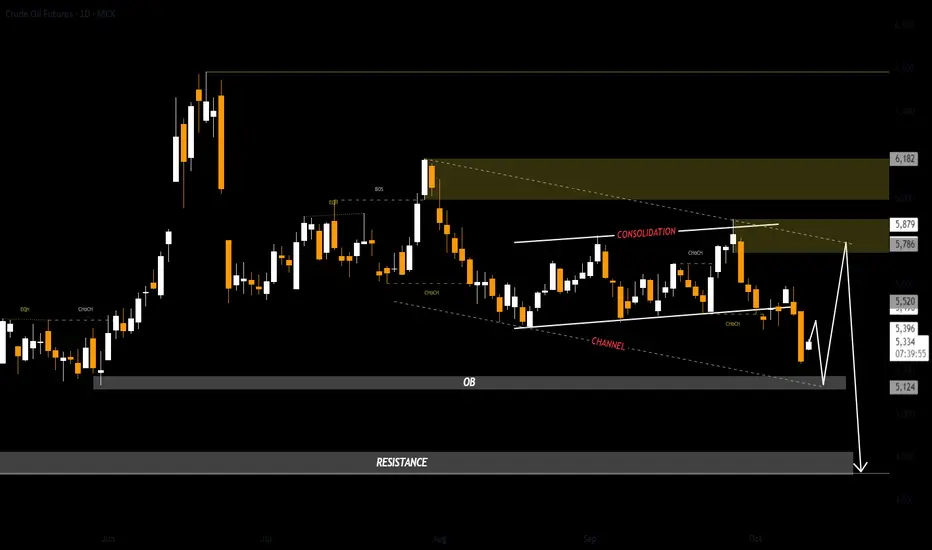
US OilCrude Oil
- Consolidation Phase
- Break of Structure
- Bearish Channel as an corrective pattern in Short Time Frame
- Order Block
- Resistance Level
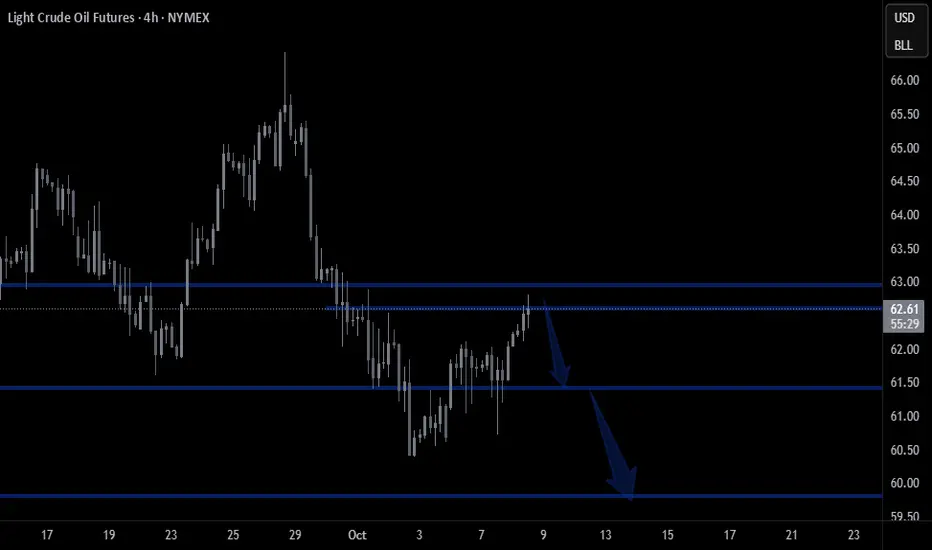
Lower Highs Signal Weakness: Crude Oil Bears Eye $61 Support
The recent attempt to rally stalled around $65–66, failing to break above the mid-Bollinger band resistance.
Multiple long upper wicks show selling pressure on rallies.
Price is moving closer to the lower band after failing to hold above the middle band.
The market shows weak upside momentum and dominant selling pressure.
As long as price stays below $65.50, bears maintain control.
If $61.00 support breaks, downside targets are $59.00, then $57.00.
