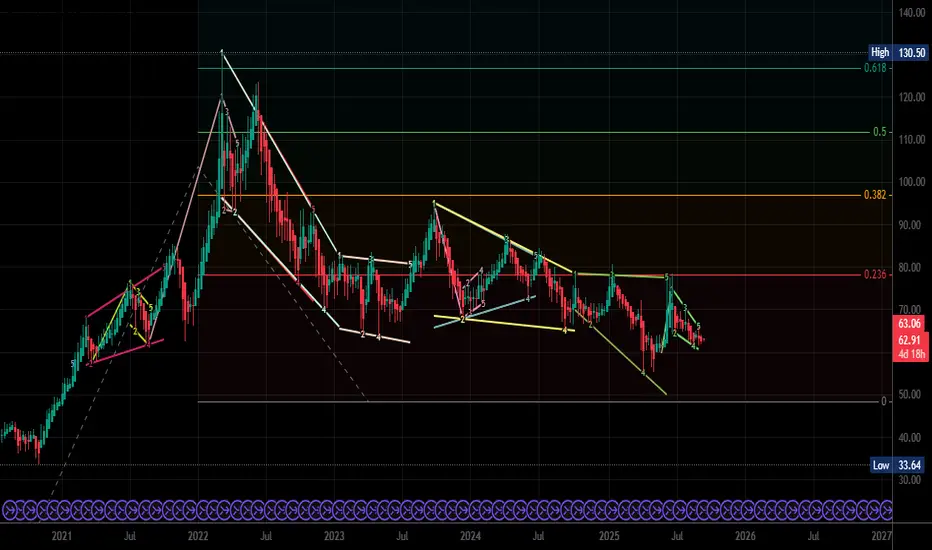
Crude: Importance Of The 61.8% Shows Resistance at 64Crude, always came close to the important 61.8% Fib, then it turned lower, broke the channel. Resistance is at $64.
CLN2022 trade ideas

Manage Crude Oil Risk with Weekly Energy OptionsOn Sunday Opec+ agrees further oil output boost by 137K barrels per day, but less than Sep / Aug output, when market open it went higher.
How to manage short-term risk, in this case opportunity with CME Group weekly energy options on such a scheduled announcement?
Crude Oil Futures & Options
Ticker: CL
Minimum fluctuation:
0.01 per barrel = $10.00
Disclaimer:
• What presented here is not a recommendation, please consult your licensed broker.
• Our mission is to create lateral thinking skills for every investor and trader, knowing when to take a calculated risk with market uncertainty and a bolder risk when opportunity arises.
CME Real-time Market Data help identify trading set-ups in real-time and express my market views. If you have futures in your trading portfolio, you can check out on CME Group data plans available that suit your trading needs www.tradingview.com

Chopped into Indecision - Some Thoughts on jacesabr_real's queryIf you’ve even felt chopped up with your trading, particularly with a situation where no matter what you do you ‘feel like your stop is getting picked off’ then you would not be alone.
jacesabr_real reached out with such a challenge last week and so I’ve offered to share a few thoughts for what they're worth. Please feel free to take what resonates and ignore the rest.
here's the original idea post :
There are 3 areas a trader needs to understand and align with in order to be able to trade successfully:
Market - The market condition: Bull, Bear, Sideways, Quiet Volatile, etc
Method - Your process/strategy for engaging with the market (breakout, mean revert, etc)
Mindset
- The emotional state of the trader throughout the lifecycle of the trade
These 3 areas overlap and despite being last in the list, I suggest that Mindset is the most important as it underpins everything. The late (great) Dr Van Tharp (featured in the original Market Wizards book) used to say that Mindset accounted for 80% of performance but later amended that to 100%.
So I’ll address this from that focal point. The reason? It’s the mind from which the process/strategy is selected, the ‘impulse’ to trade emanates and then the lived experience resides.
If a trader is having challenges with being stopped out frequently - it can result in a trader feeling like…
‘They’re picking me off’
'I was ticked out'
'The idea hasn’t failed, I’m just going to get back in again'
And it's easy to get into a revenge cycle of ‘doing the right thing’ but suffering fractional loss accumulation that adds up to a decent sized (even catastrophic) loss.
Which can lead to a loss in confidence, energy and discipline.
It’s a slippery slope. Which can lead to behaviours such as moving stops, sizing up bigger to make back, taking stops off entirely - continuing to take more trades as one is feeling ‘invested’ in the idea by sheer virtue of time spent in the process. Continue like this - maybe we get lucky and get the odd win to flatten out. Over time however, the risk is Tilt.
As you will likely understand, this is a massive area, so, a few general points that I’ll invite you to consider:
Approach your trading in this order: Mindset → Market → Method
Your Mindset may start out strong but the Market will try to wear it down
Protect your Mindset at all costs
Build steps into the process to simplify decision making.
Be clear on your rules for entry, management and exit. If you're unclear - you'll ask questions of yourself in the moment of the trade when it's hard to think clearly.
Ensure there are rules around capital preservation.
Some Suggestions:
Don’t allow revenge trading to take over… create breaker switches. (i.e. walk away!, take breaks)
Allow a re-entry of the same idea as part of your Method… but cap the number of attempts at the same trade idea to preserve capital and sanity (to perhaps 2 or 3 attempts).
Don’t remove (or move) stops… ever. Always have a worst case stop for risk management
If you’re getting stopped out frequently but the trade idea ultimately goes in your favour then your stop may be too tight (more to do with Market & Method)
Use a larger worst-case stop… and reduce position size if necessary
Monitor changes in volatility for your market (the Market condition may have changed and require an adaptation to your stop sizing to accommodate
With regards to your specific questions the following thoughts came up for me.
Many of your what if scenarios suggest that you may still need to look at your method. Pick an exit mechanism and stick with it. Collect the data points that will help inform whether your strategy is positive expectancy or not. If you keep changing the variables its really tough to track what works and what doesn't.
Get to understand your strategy and the stats around it. What is ‘normal’ in the way of number of losses. I’d suggest that seeing 4-5 losses of the same trade type a number of times a week might be a lot.
Consider the language that you are using. I notice the phrase ‘suicide stop’. Consider what that does to psychology subliminally. Perhaps use something like ‘hard stop’ or ‘capital preservation stop’ to keep your emotional balance and professionalism in your craft.
I hope this is helpful.
I have a dream - OIl below $50I have a dream OIl below $50
since US strike on Iran OIl hit $76 per barral for several days
after down only
I think that trend would go on
and in a case of reaching $50 per barrel WAr in Ukraine would stop

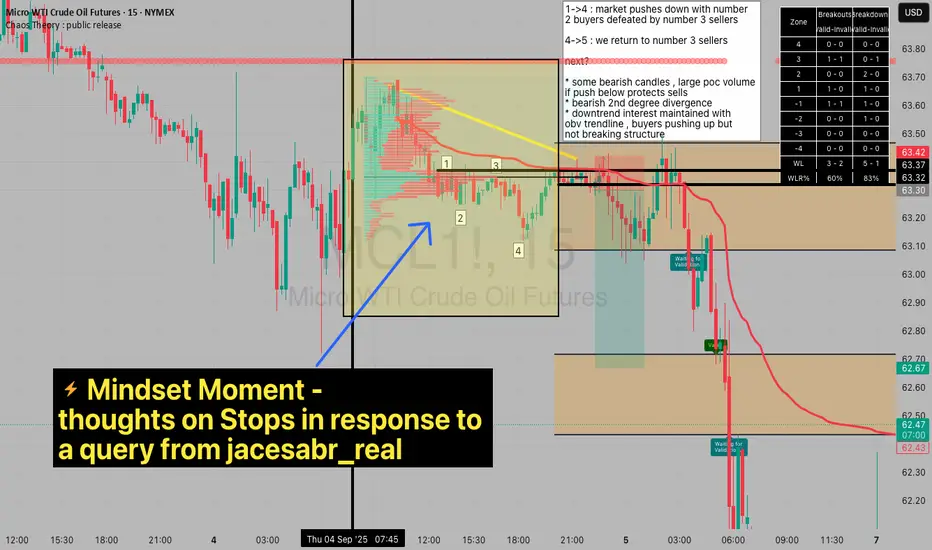
potential for push down in bearish continuation 1->4 : market pushes down with number
2 buyers defeated by number 3 sellers
4->5 : we return to number 3 sellers
next?
* some bearish candles , large poc volume
if push below protects sells
* bearish 2nd degree divergence
* downtrend interest maintained with
obv trendline , buyers pushing up but
not breaking structure

Crude Oil - Eye twinkle to go long?The Test/Retest was expected, and it was not that clean as it is mostly. Usually I don't want to see price trading back into the fork again.
This time, price managed to jump out of it again and opened above the U-MLH. If it can close outside the fork too, then this would be a good hint for me to load the boat.
The 80% target is the yellow Centerline, or even higher, since the drillers moan about a too low price (Fundamental Fact).
Let's see if we find some petro dollars.

Crude Oil Idea of week 08-12/09/25This week I see Oil continuing lower with a potential bullish reaction after reaching lower price areas of interest. Monitoring price action on Monday to decide what we will attack and trade. I wouldn't be surprised if this week is choppy!
Always caution, patience and risk!
GL!
If you like the content give me a follow on X!
Check Bio. Cheers!
Light Crude Oil | Buy & Sell Setup | 09 Sep 2025 – 10:60 EDTLight Crude Oil Futures | Buy & Sell Setup | 09 Sep 2025 – 10:60 EDT
Ressitance Zone: 63.55 – 63.00
Scenario 1 : Buy
Entry: 63.55
Stop Loss: 63
Targets:
TP1 → 64.82
TP2 → 65.54
TP3 → 66.00
Analysis:
From Buy Zone (63.55 – 63) creates possibilities for a buy move.
Scenario 2 : Sell
Entry: 63
Stop Loss: 63.55
Targets:
TP1 → 62.37
TP2 → 61.85
Analysis:
Below Resistance Zone (63.55 – 63) creates possibilities for a sell move.
Stay alert on updates here.
⚠️ Disclaimer: This idea is shared for educational purposes only and should not be considered financial advice. Please do your own analysis before making trading decisions.

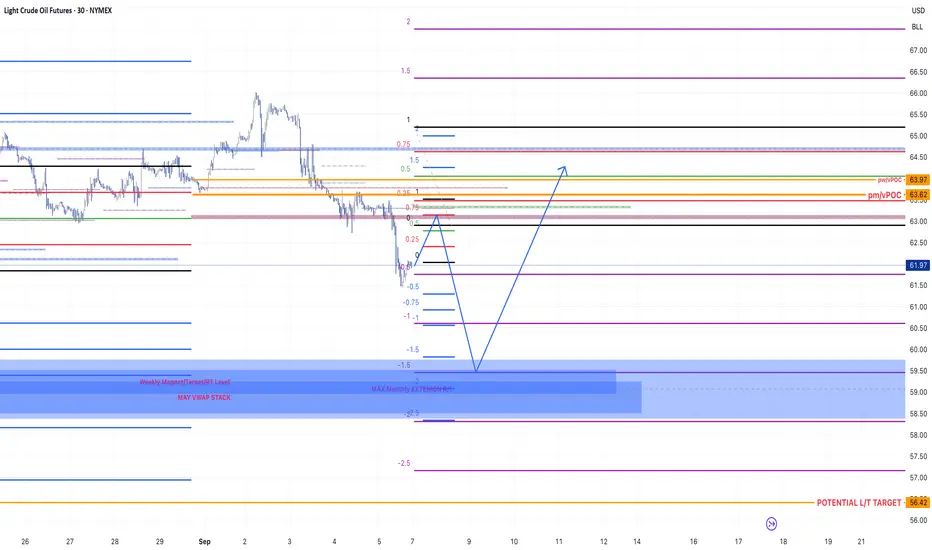
return to proven buyers provides continuation cheap entry 1->4 : return to number 2 proven buyers
next :
* hidden bull rsi and mfi
* freq shifted touch of lin regression line
* poc defending buyers
*obv in uptrend
*pullback to vwap

Crude Oil: Bullish Reversal Signals Upside Opportunity Current Price: $63.0
Direction: LONG
Targets:
- T1 = $65.0
- T2 = $68.0
Stop Levels:
- S1 = $61.5
- S2 = $60.0
**Wisdom of Professional Traders:**
This analysis synthesizes insights from thousands of professional traders and market experts, leveraging collective intelligence to identify high-probability trade setups. The wisdom of crowds principle suggests that aggregated market perspectives from experienced professionals often outperform individual forecasts. In Crude Oil markets, this intelligence highlights key technical and fundamental factors driving positioning.
**Key Insights:**
Crude Oil prices have recently shown signs of consolidation at lower levels after sharp declines throughout Q2. Market participants are assessing the ongoing macroeconomic factors, particularly softer inflation readings and a potential slowdown in global economic activity. However, bullish sentiment is beginning to grow as speculation increases around potential supply cuts by major oil-exporting nations, particularly OPEC and its allies. Historically, coordinated efforts by OPEC have served as a strong catalyst for price recovery during periods of steep declines.
Technically, Crude Oil's current price is showing the formation of a bullish reversal pattern near the $63.0 support zone. The RSI (Relative Strength Index) is exiting oversold territory, hinting at renewed buying interest. Additionally, moving averages suggest a potential crossover that aligns with upward price momentum over the short term. Key resistance levels sit at $65.0 and $68.0, with price targets tied to these benchmarks as oil prices gather steam for a rebound.
**Recent Performance:**
Crude Oil has dropped significantly from its highs of $75 earlier this year, as widespread fears of demand destruction and uncertainty in economic outlook weighed on energy markets. In recent weeks, prices have stabilized around the $63-65 range, signaling potential exhaustion from sellers. The market saw a modest relief rally during previous trading sessions, indicating a shift in sentiment and readiness for new upward momentum.
**Expert Analysis:**
Seasoned market experts suggest that the timing aligns for a strategic upside play in Crude Oil. Technical analysts point to supportive factors such as reversal candlestick formations around key support levels, combined with an uptick in trading volume hinting at stronger buyer participation. On the fundamental side, analysts anticipate OPEC's upcoming meeting could yield favorable supply cuts, reinforcing the bullish case. Additionally, the prospect of stimulus measures in major economies could positively impact overall demand for energy-related commodities, including crude.
**News Impact:**
Recent headlines have focused on political tensions in major oil-producing regions, which could disrupt supply chains. Additionally, OPEC members are reportedly leaning toward further production cuts to prop up prices. Simultaneously, discussions surrounding a potential soft landing for the U.S. economy and higher-than-expected Chinese demand are fostering optimism. Such developments may provide the catalyst needed for Crude Oil to break resistance areas in the near term.
**Trading Recommendation:**
Given Crude Oil’s stabilization near key technical support and bullish macro catalysts, a LONG position is recommended. Traders can expect momentum-driven price action toward initial targets at $65.0 and then further to $68.0, contingent on sustained strength. Stops are advised just below recent price lows at $61.5 and $60.0 to mitigate downside risks. This setup provides a favorable risk-reward ratio as market conditions hint toward upward bias.
Do you want to save hours every week?

US CPI Number? Lets see What Crude Is Telling us... Today is the US CPI one of the most important events before the Fed’s next move
I’ve often used the relationship between US CPI and Crude oil, and it has been a reliable guide many times before.
Key points
👉Crude was down -8.5% in August → we may see a suprise with lower CPI
👉 Official expectations are for higher CPI: from 2.7% to 2.9% y/y → risk of a miss
👉Even if CPI hits 2.9%, dollar may not rally far → because its expected number
👉Dollar bottomed in Sep 2024 after Fed made 1st cut in while→ weak USD risk remains till FED cuts, then reversal

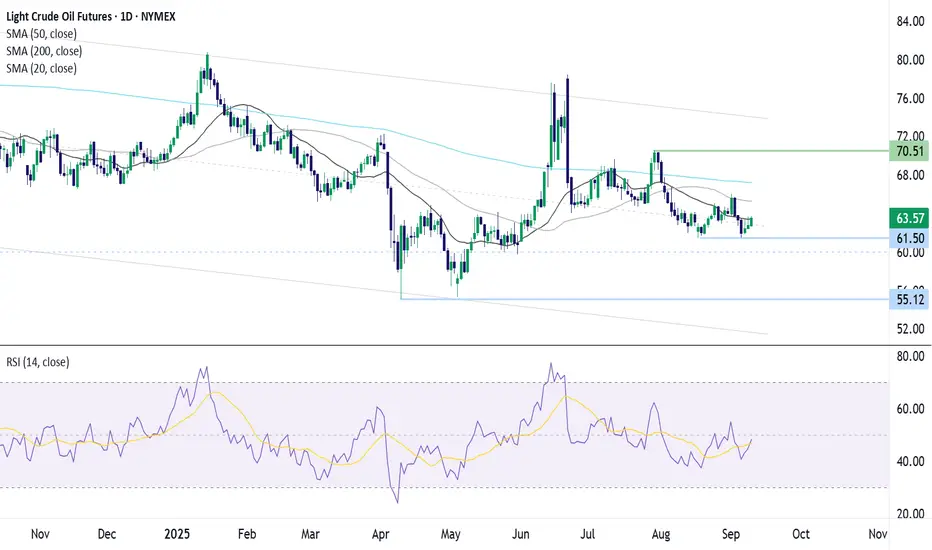
Oil tests 20 SMA resistanceOil trades within a descending channel dating back to 2023. The price also trades below its 20, 50, and 200 SMA in a bearish trend. Oil faced rejection at the 50 SMA and rebounded lower before finding support at 61.50, the August low. The price has recovered higher and is testing the 20 SMA resistance and the mid-point of the descending channel.
Buyers will need to close above 63.50 to extend gains towards 65.00, the 50 SMA, and the September high. A rise above here creates a higher high and exposes the 200 SMA.
Selles will need to break below 61.50 to create a lower low and extend the bearish trend.
FC
CRUDE OILPreferably suitable for scalping and accurate as long as you watch carefully the price action with the drawn areas.
With your likes and comments, you give me enough energy to provide the best analysis on an ongoing basis.
And if you needed any analysis that was not on the page, you can ask me with a comment or a personal message.
Enjoy Trading ;)
Crude oil - Potential UPThe break of breakeven must be give a push UP of price until next resistence area

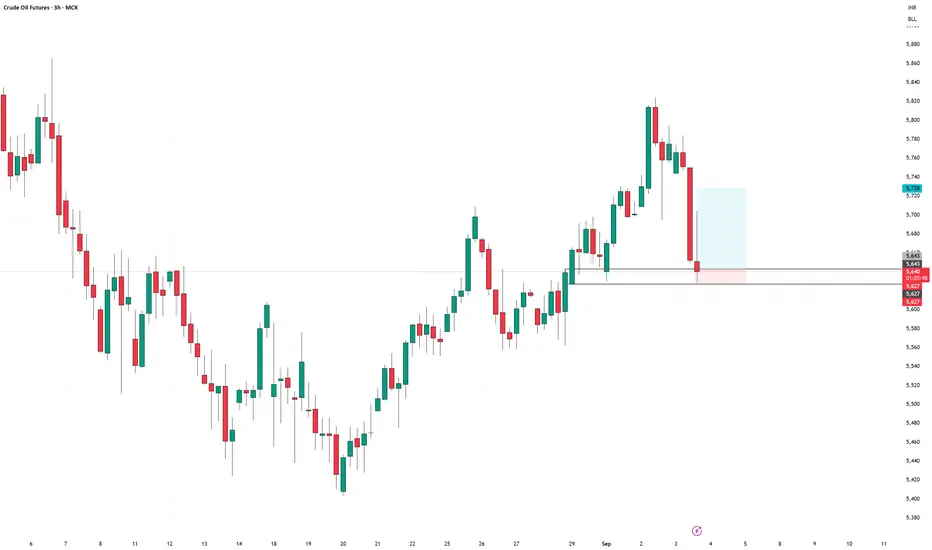
CRUDEOIL September Futures long setupCRUDEOIL September Futures long setup
Entry - 5643
Stop Loss - 5627
Target - 5728
Risk Reward - 1:5.3
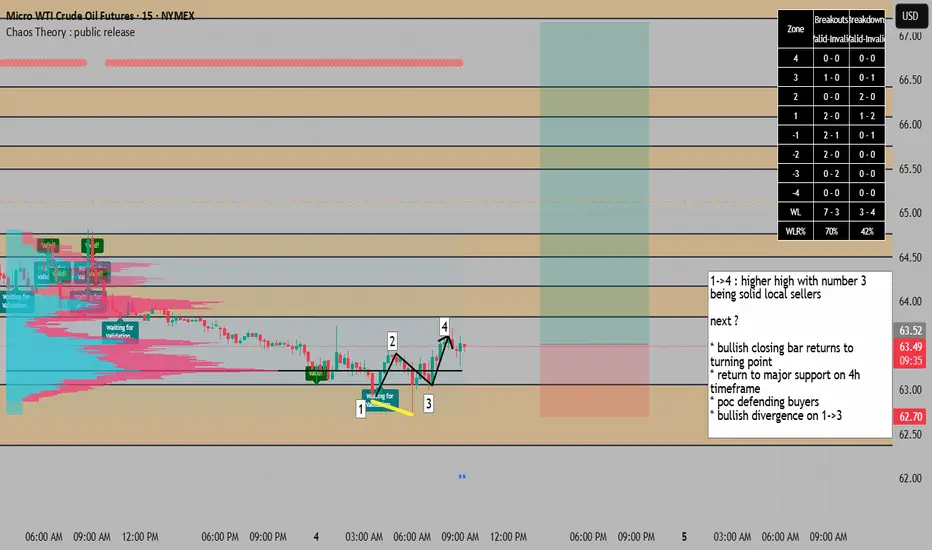
potential uptrend continuation on 15M from 4H structure 1->4 : higher high with number 3
being solid local sellers
next ?
* bullish closing bar returns to turning point
* return to major support on 4h timeframe
* poc defending buyers
* bullish divergence on 1->3
Oil Long Setup (A Setup)Oil is basically in a sideways price action following a predictable range. Overall, there isn't much momentum. However, considering the current sideways move, and taking into consideration key demand levels, it seems it has a high probability of a move to the upside to next supply zone.
I give this setup an 80% chance (A setup). My buy limit has already been triggered, with TP1 and TP2 levels I indicated on chart.
Let's see how it goes.
return to proven buyers presents trend continuation opportunity 1->3 : higher high , number 2 proven buyers
3->4 : reutrn to buyers
what do I think will happen next ?
* push above vpoc
* hidden bullish divergence
* obv support line predicting buying interest

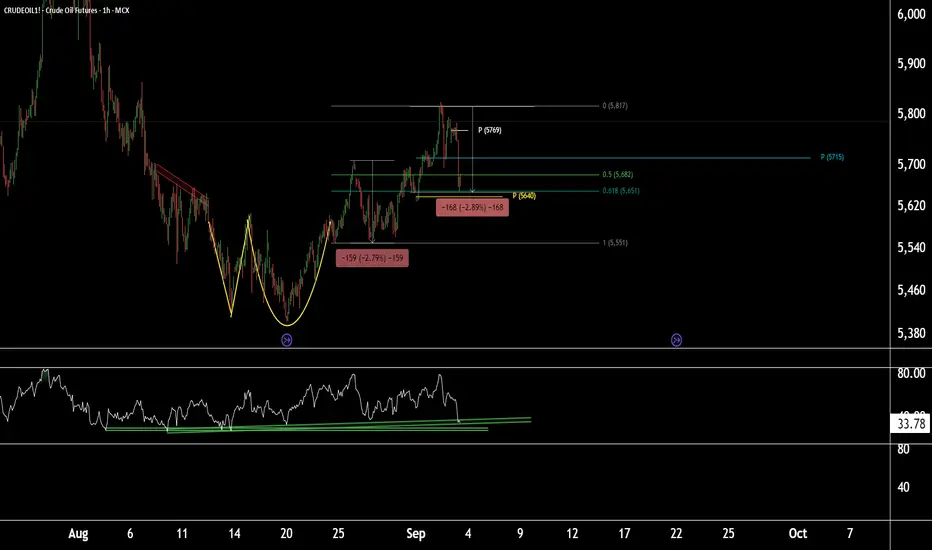
Price action + RSI support = fresh buy opportunity in CrudeOil1!CrudeOil1! (1-Hour Timeframe) Technical Outlook
CrudeOil1! is currently sustaining at the Fibonacci Golden Ratio level of 0.618, with the weekly pivot placed near 5640. Based on Fibonacci projections and price action, this 5640 zone appears to be a crucial area, as it aligns with a 2.8% retracement completion.
On the 1-hour timeframe, the RSI is showing a decline but may take support near the current levels, adding further weight to this support zone.
All technical indicators together suggest that the 5640–5650 zone could act as a strong support in the short term. If this support holds, we may see upside targets at 5715 and 5750, with the potential for CrudeOil1! to make a new high if the bullish momentum continues.
Thank you.
WTI Crude Oil - Bearish Outlook: Potential Short SetupOverview:
WTI Crude Oil (CL1!) is showing signs of weakening momentum amid a bearish fundamental backdrop. With prices hovering around $63 as of September 15, 2025, I'm eyeing a short opportunity near the $64 resistance zone. This view is supported by deteriorating market sentiment and technical patterns suggesting further downside.
Key Fundamentals Driving the Bear Case: CFTC Speculative Net Positions at 15-Year Low: The latest CFTC Commitments of Traders (COT) report shows speculative net long positions in crude oil futures dropping to around 81.8K contracts as of September 12, 2025—the lowest level in 15 years.
This sharp unwind of longs indicates fading bullish conviction among speculators, often a precursor to sustained price declines.
Global Supply Outpacing Demand: According to the IEA's September 2025 Oil Market Report, global oil supply is projected to rise by 2.7 million bpd in 2025, while demand growth remains subdued at just 700 kb/d.
This imbalance is creating a larger-than-expected surplus, exacerbated by OPEC+ production hikes and resilient non-OPEC supply. Weaker U.S. demand signals from recent EIA data further tilt the scales toward oversupply.
Expect inventory builds to pressure prices lower into Q4.
Technical Setup: Nullified Head & Shoulders Pattern?
The chart highlight a potential head and shoulders top formation on the 4hr-8hr timeframe, with:
Left Shoulder: Formed in late August around $64.
Head: Peak at ~$66 in early September, followed by a rejection.
Right Shoulder: Currently developing near $64, with the neckline around $62.50–$63.
A breakdown below the neckline could target $59–$60 initially. Volume has been declining on the upside, supporting the bearish reversal.
Invalidation: The pattern would be nullified if price closes decisively above $66 (the head high), potentially signaling a bullish continuation toward $70. But with current momentum fading and RSI diverging bearishly, the odds favor the downside.
Trade Idea: Entry: Short around $64 on a rejection (e.g., failed retest of resistance).
Stop Loss: Above $66.50 (head high + buffer).
Target: $60 (neckline projection), with extension to $58 if momentum builds.
This setup combines weak specs, supply glut, and classic reversal TA—primed for a short. What's your take? Bullish counterarguments welcome! #USOIL #CrudeOil #Bearish #TradingView

Crude oil - Sell around 64.00, target 62.00-60.00Crude Oil Market Analysis:
Recently, crude oil buying remains strong. After three days of gains, it was followed by a market crash and then fell again. Crude oil is still fluctuating on the daily chart. The overall trend is bearish, and short-term volatility is expected. Crude oil has recently been hovering between 65.00 and 60.00. Sell near 65. Consider selling if it breaks 60. The intraday resistance level is 64. During the Asian session, we are considering selling around 64.
Fundamental Analysis:
Japan is closed today. This week, we will focus on the Federal Reserve's FOMC interest rate decision and economic outlook summary, as well as the very important speech.
Trading Recommendations:
Crude oil - Sell around 64.00, target 62.00-60.00

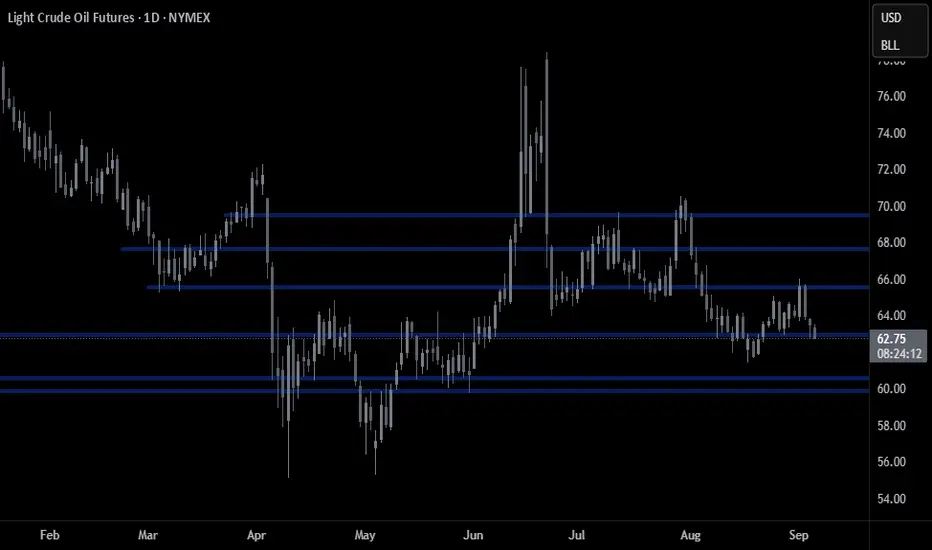
Crude Beginning—or Continued Beating?CL1! Weekly — Is today the buy day?
Bullish flag on the weekly, daily CVD higher-low divergence, and a possible monthly 45° (Gann 1×1) reclaim. I’m exploring the long case and mapping what needs to happen.
What I think I’m seeing
Structure: Weekly bull flag compressing under 63.3–64.5.
Flow: Daily CVD made a higher low while price made equal/lower lows → buyers absorbing at the base.
Angle: Price is testing the monthly Gann 1×1 (45°). Reclaim/hold tends to start an advance toward the next fan angles.
Gann breakdown
Horizontal (price resonance)
Trigger band: 63.30–63.40
Guardrails above: 63.56 / 63.63 → 64.24 → 64.49 (convert to support = go mode)
Upside ladder once 64.49 holds: 66.27 → 67.76 → 72.90 → 79.90 → 86.57 → 92.15
Vertical (time)
Watching weekly windows from the last swing low: ~13 / 21 / 34 / 52 weeks (Gann & Fib counts). If a push through 63s–64s aligns with one of these, I’ll weight it higher.
Angle (fan)
A monthly close back above the 1×1 (45°) often points to a rotation toward the 1×2 / 2×1 fans—which line up with the ~66–68 → 72–73 areas on my chart.
Long plan (step-by-step)
Trigger: Push through 63.30–63.40 with CVD printing a higher high versus the prior 2 sessions.
Confirmation steps:
Hold above 63.56 / 63.63
Then 64.24
Promotion to “trend-up” when the daily/4H close > 64.49 and it holds on retest.
Entries (staged):
Buy stop 63.36–63.44
Add on strength 63.58–63.63
Add on successful retest 64.24–64.49
Risk (tight, mechanical):
Initial stop 62.74 (beneath the 0.618/CVD pivot).
After a hold above 64.49, trail under prior day’s low or a rising 1-hr VWAP/EMA.
Targets / scale-outs:
63.97 → 64.49 (convert)
66.27 (first major take-profit)
67.76 (second)
Leave a runner toward 72.90 if the monthly 45° is reclaimed and respected.
Live checklist I’ll monitor
CVD: higher highs on each push through 63.3 / 63.6
VWAP: intraday VWAP rising and respected on dips
Closes: daily/4H > 64.49 and a weekly that keeps 64s as support
Angle: monthly candle tracking above the 45°
I’m treating this as a long setup that needs confirmation: let the tape prove it through 63s → 64.49, then walk the ladder 66.27 → 67.76 → 72.90 with disciplined risk.
Long CL1!📌 When is Crude Oil & Heating Oil in High Demand & How Does It Cycle Internationally?
Crude oil and heating oil (a refined distillate product) are two of the most widely traded energy commodities in the world. Their demand is shaped not only by seasonal factors like winter heating or summer travel but also by global economic activity, geopolitical shocks, and OPEC production quotas. Traders who understand these recurring patterns can rotate positions between crude oil futures, heating oil spreads, energy ETFs, and oil major stocks, capturing profits from seasonal demand surges and international supply cycles.
🔹 1. When is Crude Oil & Heating Oil Demand Highest?
(Bullish for Crude Oil Prices, Heating Oil Futures & Energy Stocks)
✅ Q4–Q1 (October – March) → Winter Heating Season
Heating oil demand peaks in the U.S. Northeast, Europe, and Northern Asia, where it is a primary source of winter fuel.
As temperatures drop, residential and commercial heating needs surge, straining inventories.
Cold snaps and “polar vortex” events can cause sudden price spikes as heating oil consumption overshoots refinery output.
Futures traders often buy HO (Heating Oil Futures) contracts in anticipation of winter demand.
📌 Example:
January 2014 → An extremely cold U.S. winter drove heating oil up 18% in six weeks.
February 2021 → Texas freeze caused heating fuel shortages and refinery outages, spiking distillate prices.
✅ Q2–Q3 (April – September) → Driving & Travel Season
During summer, gasoline consumption surges due to U.S. driving season and global air travel demand.
Refineries run at higher capacity to meet gasoline needs, which also increases crude oil intake.
Crude oil prices tend to rise seasonally in spring/summer as gasoline crack spreads widen.
Jet fuel consumption also peaks due to increased tourism, which lifts overall refined product demand.
📌 Example:
Summer 2008 → Gasoline and jet fuel demand pushed WTI crude to its all-time high of $147/barrel.
Summer 2022 → Reopening travel demand post-COVID sent crude over $120/barrel.
✅ Year-Round Demand Drivers
1️⃣ OPEC Production Decisions – Monthly meetings determine quotas. Any announced cut usually boosts crude prices.
2️⃣ Geopolitical Risk Premiums – Middle East tensions, sanctions on Russia or Iran, or shipping lane disruptions (Suez, Strait of Hormuz) can instantly spike crude/HO prices.
3️⃣ Refinery Maintenance – Refineries shut down twice a year (spring & autumn) for maintenance. This lowers crude demand temporarily but tightens refined product supply, often bullish for heating oil and gasoline.
4️⃣ Global Economic Cycles – A booming economy increases freight, shipping, and industrial demand, supporting both crude and distillates.
🔹 2. How Crude Oil & Heating Oil Cycle Internationally
(Month-to-Month Trading Strategy)
Unlike agricultural commodities like corn that follow harvest rotations, energy commodities follow consumption and refining rotations. Traders rotate focus between crude oil, gasoline, and heating oil depending on the month:
Month Seasonal Demand Driver Strategic Trading Focus
Jan–Feb Winter heating peak in U.S. & EU Long HO futures, long refiners (MPC, VLO, PSX)
Mar–Apr Refinery maintenance lowers crude intake Watch for crude dips, trade refiner volatility
May–Jun Gasoline build for driving season Buy XLE ETF, long COP, CVX, and integrated majors
Jul–Aug Peak travel & driving season Long crude ETFs (USO), bullish on airlines & refiners
Sep–Oct Hurricane season risks in Gulf Coast Long refining stocks (MPC, VLO), heating oil spreads
Nov–Dec Start of heating oil buildup & exports Long HO futures, long exploration & production stocks
📌 Example:
Sept 2017 → Hurricane Harvey crippled Gulf Coast refineries → Gasoline & heating oil jumped 20% while crude briefly fell from lack of demand.
🔹 3. Best Stocks & ETFs to Trade Crude & Heating Oil Cycles
🌎 U.S. Oil Majors (Crude-Sensitive)
ExxonMobil (XOM) – World’s largest oil company, stable dividends, benefits from higher crude.
Chevron (CVX) – Strong upstream focus, leveraged to crude price rises.
ConocoPhillips (COP) – Heavy shale exposure, reacts quickly to oil price changes.
📌 Best Time to Buy: Q2–Q3 (driving season, higher crude demand).
🌎 U.S. Refiners (Heating Oil & Gasoline-Sensitive)
Valero Energy (VLO) – Largest independent U.S. refiner, strong heating oil exposure.
Marathon Petroleum (MPC) – Big heating oil and gasoline player.
Phillips 66 (PSX) – Integrated refiner with strong Gulf Coast presence.
📌 Best Time to Buy: Q4–Q1 (heating oil demand) & Summer (gasoline margins).
🌎 International Oil & OPEC Plays
Saudi Aramco (2222.SR) – Global OPEC leader, tied to quota shifts.
Petrobras (PBR) – Major Latin American exporter, affected by Brazilian politics.
BP (BP) & Shell (SHEL) – Diversified international majors with refining & upstream assets.
📌 Best Time to Buy: Around OPEC meetings or geopolitical volatility.
🌎 Energy ETFs & Futures
USO – U.S. Oil Fund ETF (tracks crude futures).
XLE – Energy Select SPDR ETF (oil majors).
XOP – Oil & Gas Exploration ETF (independents).
HO Futures (NYMEX) – Direct exposure to heating oil prices.
📌 Best Time to Trade:
HO Futures → Winter (Q4–Q1).
USO/XLE → Summer (Q2–Q3).
📌 Conclusion: Best Crude & Heating Oil Seasonal Strategy
✅ Winter (Oct–Mar): Focus on Heating Oil Futures (HO), Refiners (MPC, VLO, PSX) → strong distillate demand.
✅ Summer (Apr–Sep): Focus on Crude Oil (USO, COP, CVX, XLE) → gasoline & travel demand.
✅ Geopolitical/OPEC Events: Year-round opportunities to rotate into majors (XOM, BP, SHEL) and crude futures on supply disruptions.
✅ Refinery Cycles: Play spring/autumn refinery maintenance by trading spreads between crude and heating oil/gasoline.
🔹Trading Strategies Beyond Seasonality
📈 Strategy #1: The Dollar-Oil Inverse Correlation
Oil is priced globally in USD → when the dollar weakens, crude usually rises, as it becomes cheaper for foreign buyers.
Traders can exploit this by tracking both UUP (Dollar ETF) and USO (Oil ETF) together.
Rules:
If UUP ↑ > 0.25% AND USO ↑ > 0.25% from yesterday’s close → short USO at today’s close, exit next day. The vice-versa works as well, if they both fall at once.
If dollar falls and crude rises → usually long oil positions perform best.
📌 Note: USO doesn’t perfectly track oil due to roll costs and ETF structure, so results vary.
📈 Strategy #2: Friday Seasonality in Crude Oil
Crude oil has a well-documented tendency to rise on Fridays.
The edge is stronger if Thursday closes down (profit-taking + positioning for weekend risks).
Rules:
Buy on Thursday’s close if USO falls ≥ 25-day hl2 Keltner Channel, 0.75 ATR.
Exit on Friday close (or Friday open if a gap-up occurs).
📌 Best Performance: During SPY bull markets, when risk appetite is higher.
📈 Strategy #3: Heating Oil Seasonal Buy Window
Surprisingly, Heating Oil performs better before winter (Feb–Aug) rather than during.
Traders stock up ahead of the cold, creating an anticipatory rally.
Historical Edge:
Buying Heating Oil on Jan 11 and selling Aug 30 would have yielded +361% between 1999–2009 (EquityClock data).
