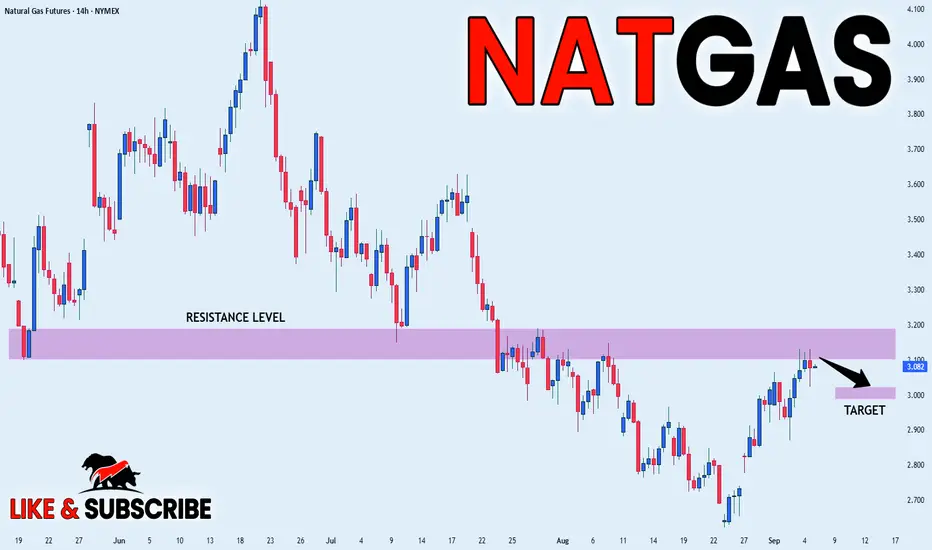
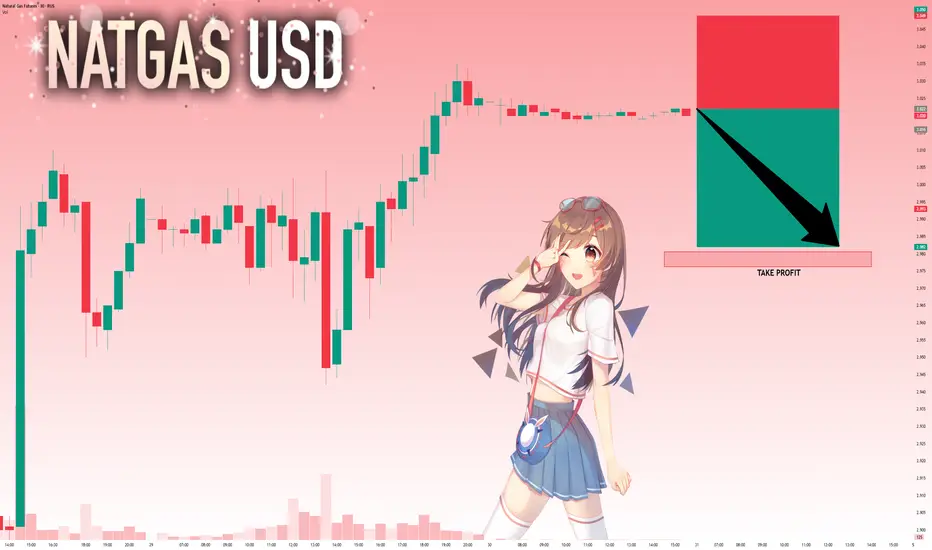
NATGAS WILL FALL|SHORT|
✅NATGAS has been growing recently
And the Gas seems locally overbought
So as the pair is approaching
A horizontal resistance of 3.136$
Price decline is to be expected
SHORT🔥
✅Like and subscribe to never miss a new idea!✅
Related commodities
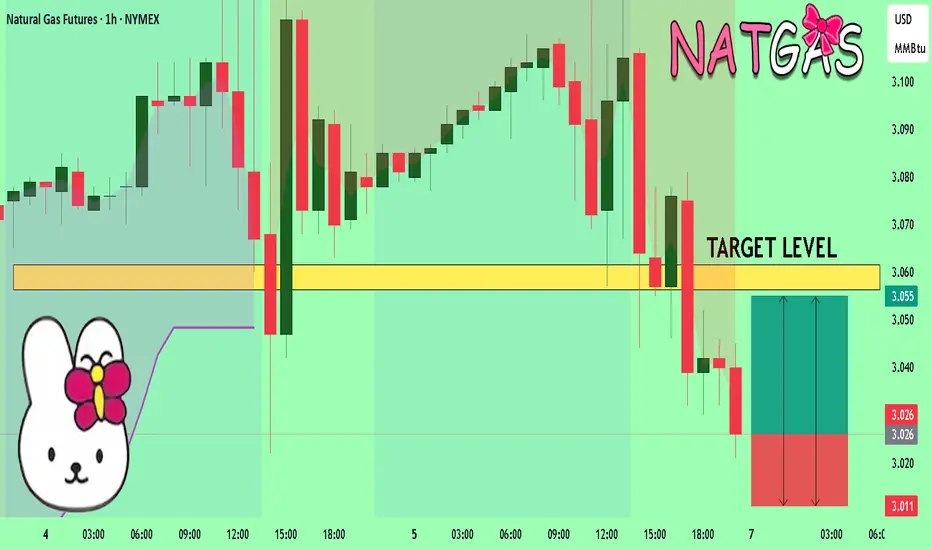
NATGAS Sellers In Panic! BUY!
My dear subscribers,
My technical analysis for NATGAS is below:
The price is coiling around a solid key level - 3.026
Bias - Bullish
Technical Indicators: Pivot Points Low anticipates a potential price reversal.
Super trend shows a clear buy, giving a perfect indicators' convergence.
Goal - 3.
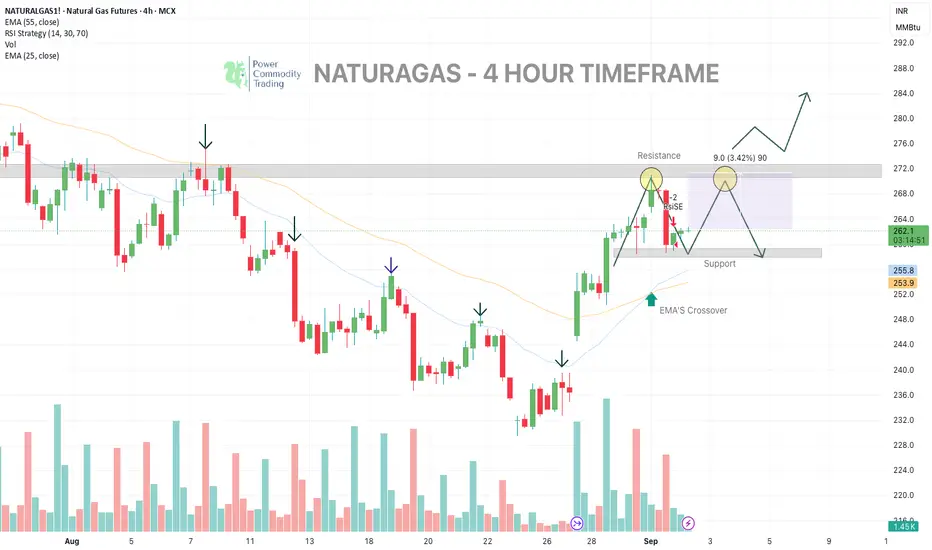
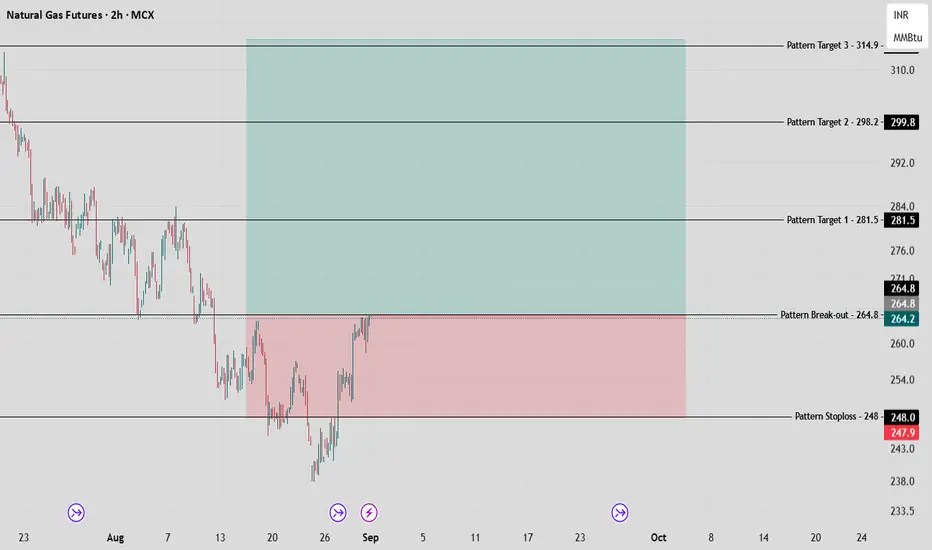
NATURALGAS : A DOUBLE - TOP PATTERN
We are tracking a possible double-top pattern here (4 hr timeframe)
Bearish Case: If price fails to sustain above resistance and later breaks support (252–256) → confirmation of double-top → downtrend likely to follow.
Entry 263
Target 268 - 271
Invalidation: sustains above resistance, the double
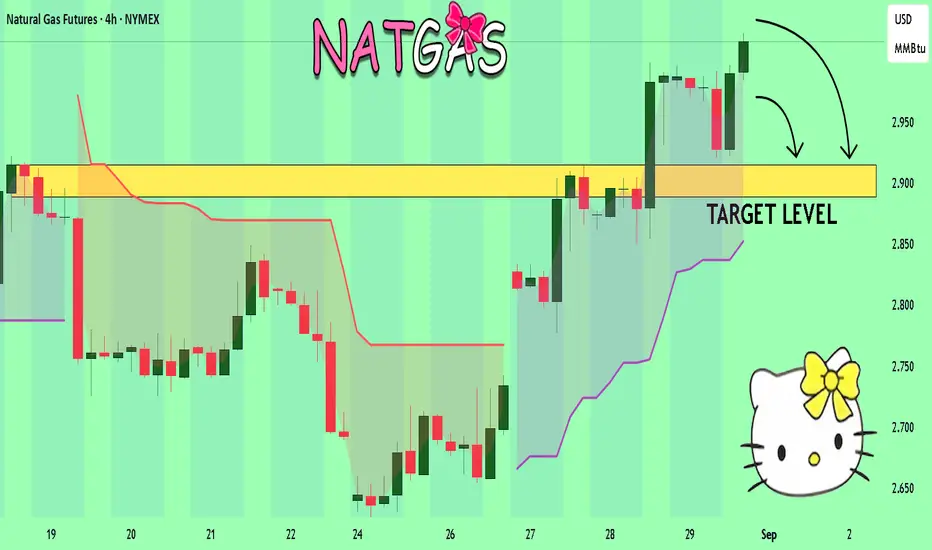
Natural Gas Market Outlook — September 01, 2025.VANTAGE:NG #NaturalGas #NatGas (NYMEX:NG1!) 🔵 Natural Gas Market Outlook — September 01, 2025.
Alright, here’s the skinny on NatGas. Back on April 28, 2025, I was calling for a dip into the $2.74 zone—and guess what? We tagged it right on schedule.
Now the game flips: I’m hunting long entries wi
NATGAS My Opinion! SELL!
My dear subscribers,
My technical analysis for NATGAS is below:
The price is coiling around a solid key level - 3.016
Bias - Bearish
Technical Indicators: Pivot Points Low anticipates a potential price reversal.
Super trend shows a clear sell, giving a perfect indicators' convergence.
Goal - 2
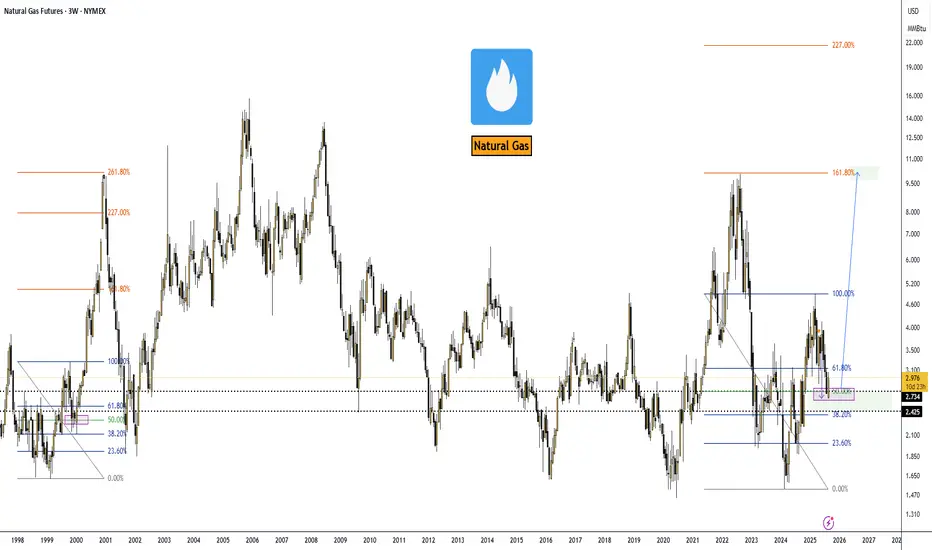
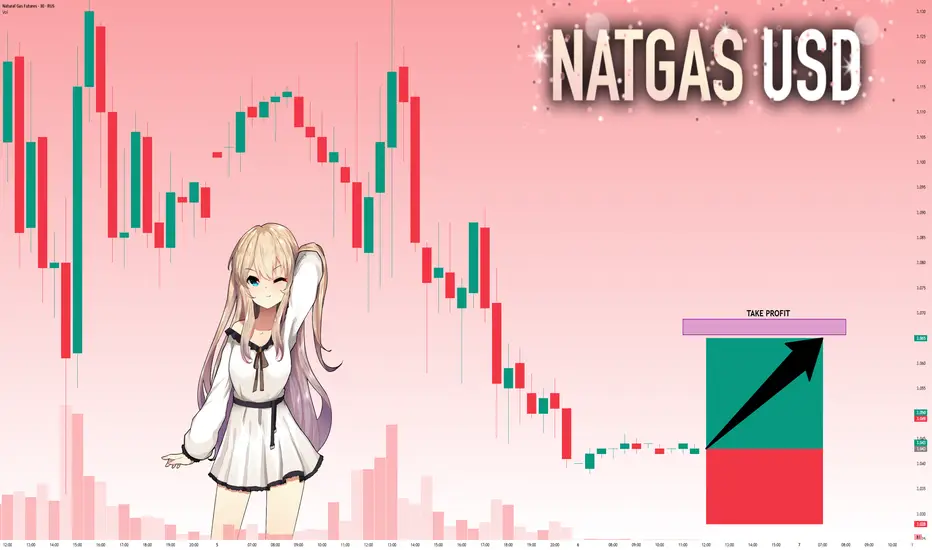
Natural Gas Positional Giant Lap Awaited in Coming Days! MCX:NATURALGAS1! Natural Gas Futures have printed a strong bullish engulfing pattern on the weekly chart, emerging after a prolonged downtrend—a classic sign that momentum may be shifting in favor of the bulls.
Pattern & Setup Analysis
The appearance of a large green candle fully engulfing the pre
Gold | Oil | Dollar | Silver | Natural Gas Price ForecastGold | Oil | Dollar | Silver | Natural Gas Price Forecast
COMEX:GC1! COMEX:SI1! AMEX:UNG NYMEX:CL1!

NG1!: Next Move Is Up! Long!
My dear friends,
Today we will analyse NG1! together☺️
The price is near a wide key level
and the pair is approaching a significant decision level of 3.043 Therefore, a strong bullish reaction here could determine the next move up.We will watch for a confirmation candle, and then target the n
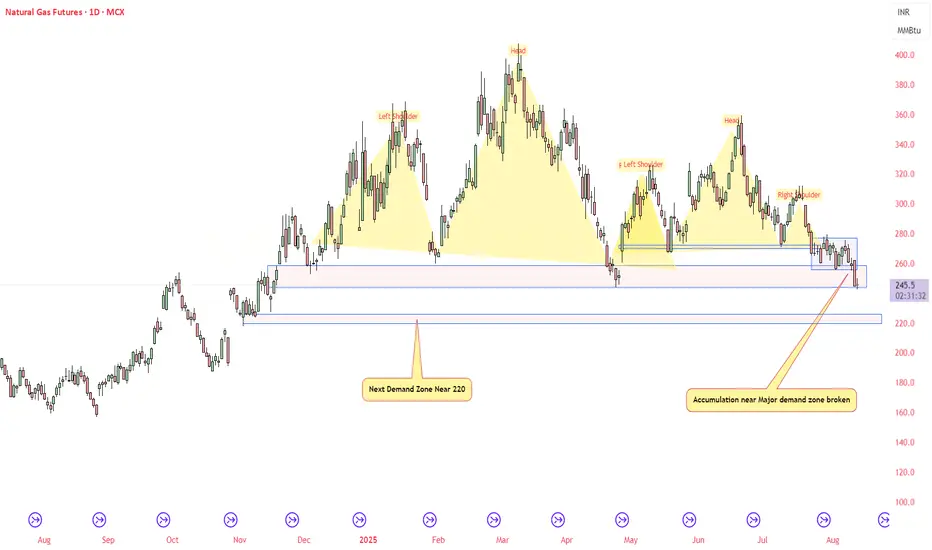
NATURAL GAS - Head and Shoulder PatternNatural Gas being in slow demand may see more bearishness near 220, fresh accumulation near major demand zone broken.
Do your own study before taking any trades
NG1!: Move Down Expected! Short!
My dear friends,
Today we will analyse NG1! together☺️
The market is at an inflection zone and price has now reached an area around 3.022 where previous reversals or breakouts have occurred.And a price reaction that we are seeing on multiple timeframes here could signal the next move down so
See all ideas
Summarizing what the indicators are suggesting.
Neutral
SellBuy
Strong sellStrong buy
Strong sellSellNeutralBuyStrong buy
Neutral
SellBuy
Strong sellStrong buy
Strong sellSellNeutralBuyStrong buy
Neutral
SellBuy
Strong sellStrong buy
Strong sellSellNeutralBuyStrong buy
A representation of what an asset is worth today and what the market thinks it will be worth in the future.
Displays a symbol's price movements over previous years to identify recurring trends.
Frequently Asked Questions
The current price of Dutch TTF Natural Gas (USD/MMBtu) Futures is 10.985 USD — it has fallen −0.39% in the past 24 hours. Watch Dutch TTF Natural Gas (USD/MMBtu) Futures price in more detail on the chart.
Track more important stats on the Dutch TTF Natural Gas (USD/MMBtu) Futures chart.
Open interest is the number of contracts held by traders in active positions — they're not closed or expired. For Dutch TTF Natural Gas (USD/MMBtu) Futures this number is 330.00. You can use it to track a prevailing market trend and adjust your own strategy: declining open interest for Dutch TTF Natural Gas (USD/MMBtu) Futures shows that traders are closing their positions, which means a weakening trend.
Buying or selling futures contracts depends on many factors: season, underlying commodity, your own trading strategy. So mostly it's up to you, but if you look for some certain calculations to take into account, you can study technical analysis for Dutch TTF Natural Gas (USD/MMBtu) Futures. Today its technical rating is sell, but remember that market conditions change all the time, so it's always crucial to do your own research. See more of Dutch TTF Natural Gas (USD/MMBtu) Futures technicals for a more comprehensive analysis.