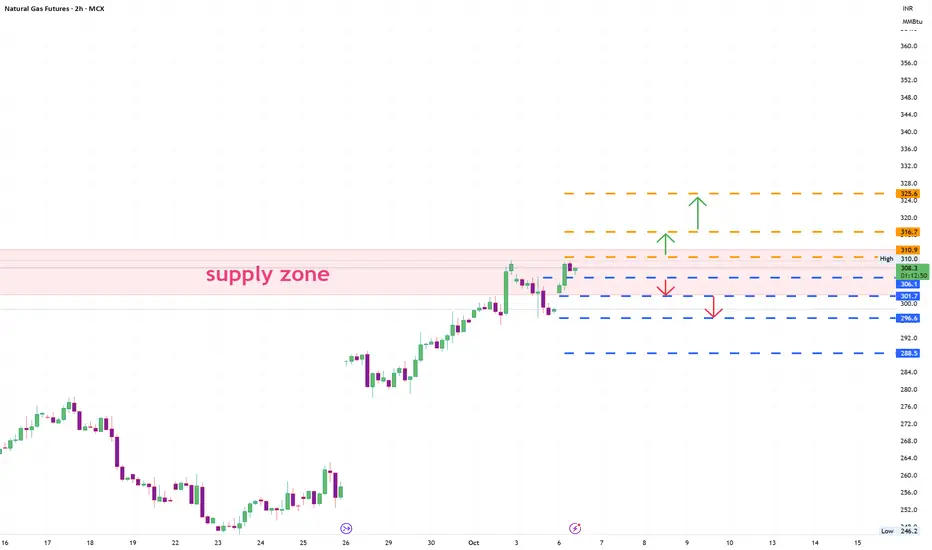
Naturalgas probable price movementAs of now price is at previous supplyzone
1. if crosses above price may test upper levels
2. if price goes below price may touch lower levels
Note. : price looks very strong and supplyzone may or maynot be respected.
Contract highlights
Related commodities
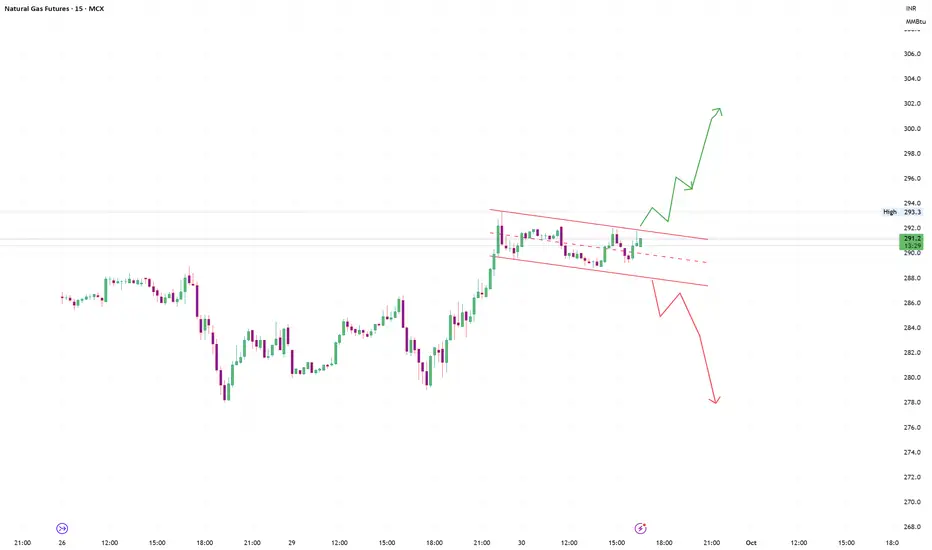
Natural gas Probable price movement1. above the parallel channel . price may move upwards
2. below it. price may move downward.
NATURAL GAS BULLISH CYCLEWith the continuous growing demand for electricity supply across the US for data centers, natural gas seems to be the fuel that will provide sufficient energy for the next 2 or 3 years for power plants that will generate many GWhs for these data centers. Here on the chart you can see that the curren

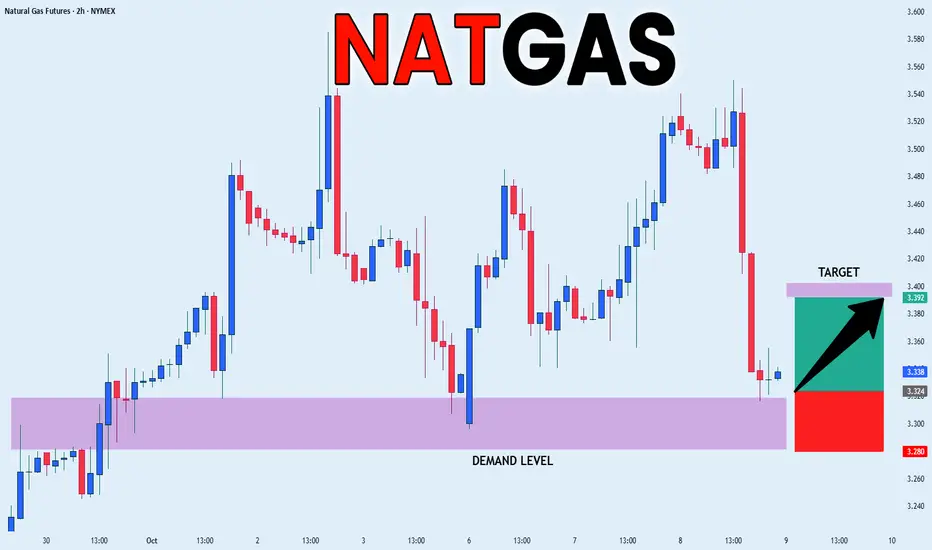
NATGAS FREE SIGNAL|LONG|
✅NATGAS reacts perfectly from the demand level, confirming bullish intent after liquidity sweep below structure. Buyers step in from discounted pricing, aiming for a recovery toward the 3.39$ target zone.
—————————
Entry: 3.33$
Stop Loss: 3.28$
Take Profit: 3.39$
Time Frame: 2H
—————————
LONG🚀
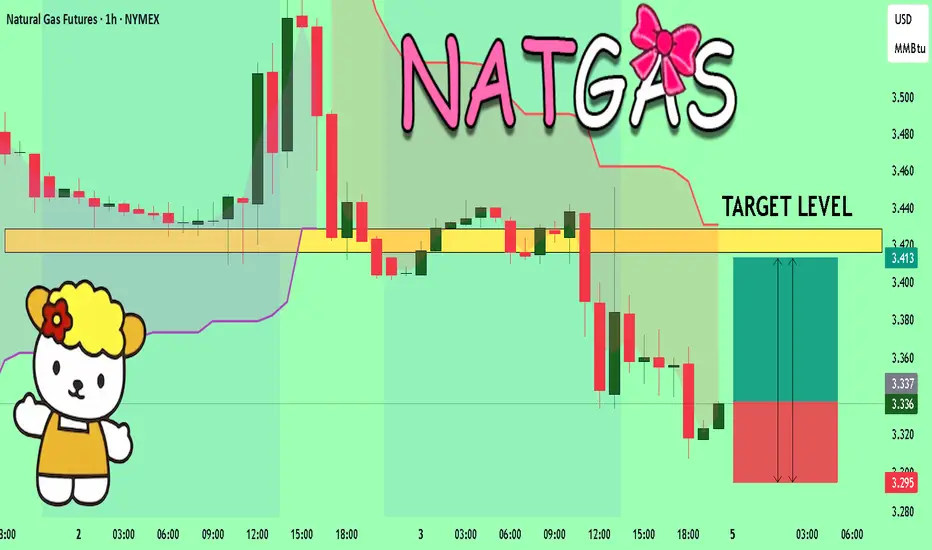
NATGAS Trading Opportunity! BUY!
My dear subscribers,
NATGAS looks like it will make a good move, and here are the details:
The market is trading on 3.336 pivot level.
Bias - Bullish
My Stop Loss - 3.295
Technical Indicators: Both Super Trend & Pivot HL indicate a highly probable Bullish continuation.
Target - 3.416
About U
NATURAL GAS BULLISHA great level to take entry for a bullish breakout as winter is ahead for the northern hemisphere, and the constant geopolitical conflicts are creating an environment for very bullish moves in commodities. I think that in the next 6 months, Natural gas futures will reach easily the 6.5$ level.

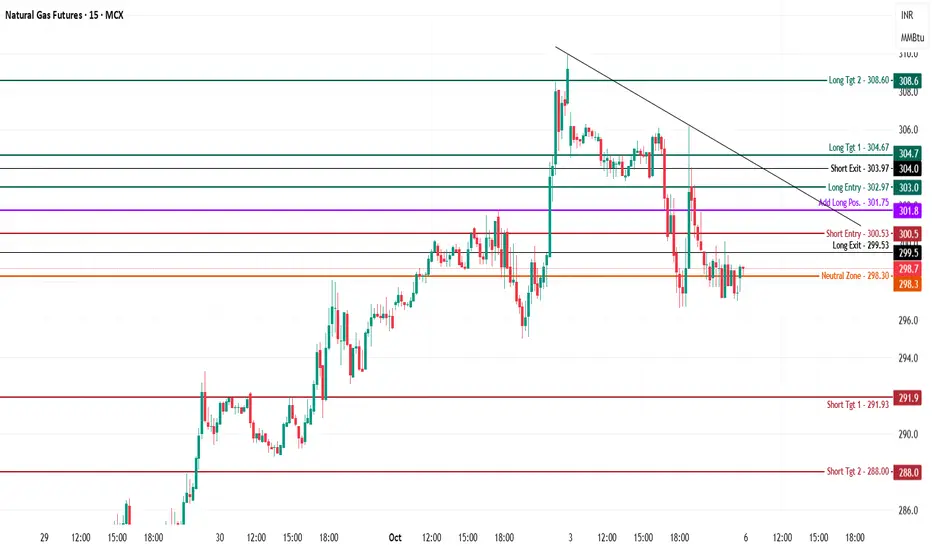
Natural Gas Futures (MCX) – Intraday Analysis - 6th Oct., 2025MCX:NATURALGAS1!
Natural Gas is trading at 298.7, consolidating below recent resistance and major supply after a minor downtrend, with price action holding around the neutral zone and awaiting a directional breakout.
Bullish (Long) Setup
Long Entry (303.0):
Initiate long trades above 303.0, whic
Gold | Oil | Dollar | Silver | Natural Gas Price ForecastGold | Oil | Dollar | Silver | Natural Gas Price Forecast
COMEX:GC1! COMEX:SI1! AMEX:BOIL AMEX:KOLD

NATGAS - LONG LONG TERM targetNATGAS - LONG LONG TERM target
This is my evaluation about NatGas for the next week with a long term vision for this winter.
So I think we are in final 5° wave and probably we can break resistence area in 4$ zone

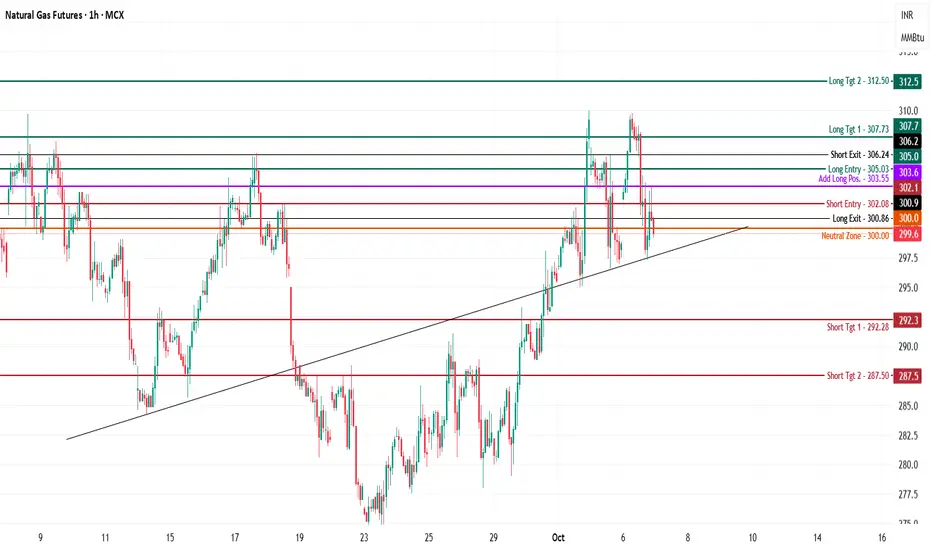
Natural Gas Futures (MCX) – Intraday Analysis for 7th Oct., 25 MCX:NATURALGAS1!
Natural Gas is trading at 299.6, consolidating just below the Neutral Zone (300), after failing to hold above resistance and forming lower highs in recent sessions. The chart shows increasing risk of volatility near the session trendline pivot.
Bullish Setup
Long Entry (305.03):
See all ideas
Summarizing what the indicators are suggesting.
Neutral
SellBuy
Strong sellStrong buy
Strong sellSellNeutralBuyStrong buy
Neutral
SellBuy
Strong sellStrong buy
Strong sellSellNeutralBuyStrong buy
Neutral
SellBuy
Strong sellStrong buy
Strong sellSellNeutralBuyStrong buy
A representation of what an asset is worth today and what the market thinks it will be worth in the future.
Displays a symbol's price movements over previous years to identify recurring trends.
Frequently Asked Questions
The current price of E-mini Natural Gas Futures (Jul 2030) is 3.415 USD / MMBTU — it has fallen −0.15% in the past 24 hours. Watch E-mini Natural Gas Futures (Jul 2030) price in more detail on the chart.
Track more important stats on the E-mini Natural Gas Futures (Jul 2030) chart.
The nearest expiration date for E-mini Natural Gas Futures (Jul 2030) is Jun 25, 2030.
Traders prefer to sell futures contracts when they've already made money on the investment, but still have plenty of time left before the expiration date. Thus, many consider it a good option to sell E-mini Natural Gas Futures (Jul 2030) before Jun 25, 2030.
Buying or selling futures contracts depends on many factors: season, underlying commodity, your own trading strategy. So mostly it's up to you, but if you look for some certain calculations to take into account, you can study technical analysis for E-mini Natural Gas Futures (Jul 2030). Today its technical rating is buy, but remember that market conditions change all the time, so it's always crucial to do your own research. See more of E-mini Natural Gas Futures (Jul 2030) technicals for a more comprehensive analysis.