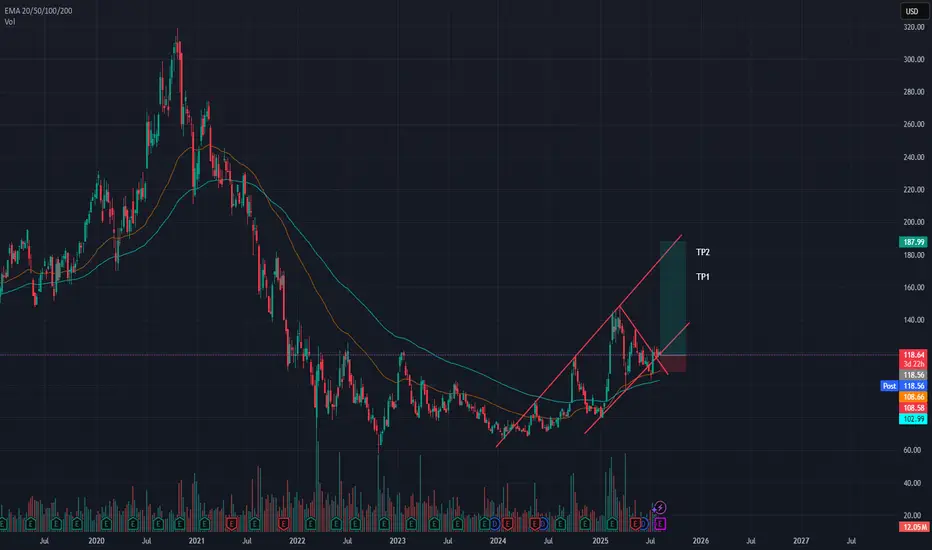
Alibaba Group Holding buying opportunityAlibaba is potentially in the process of making a head and shoulder patten.
Break of neckline should be with heavy volume to be successful.
Key facts today
Next report date
—
Report period
—
EPS estimate
—
Revenue estimate
—
8.84 USD
17.94 B USD
138.03 B USD
2.24 B
About Alibaba Group Holdings Ltd.
Sector
Industry
CEO
Yong Ming Eddie Wu
Website
Headquarters
Hangzhou
Founded
1999
ISIN
US01609W1027
FIGI
BBG006G2JVL2
Alibaba Group Holding Ltd engages in providing online and mobile marketplaces in retail and wholesale trade. It operates through the following business segments: Core Commerce; Cloud Computing; Digital Media & Entertainment; and Innovation Initiatives and Others. The Core Commerce segment comprises of platforms operating in retail and wholesale. The Cloud Computing segment consists of Alibaba Cloud, which offers elastic computing, database, storage and content delivery network, large scale computing, security, management and application, big data analytics, a machine learning platform, and other services provide for enterprises of different sizes across various industries. The Digital Media & Entertainment segment relates to the Youko Tudou and UC Browser business. The Innovation Initiatives and Others segment includes businesses such as AutoNavi, DingTalk, Tmall Genie, and others. The company was founded by Chung Tsai and Yun Ma on June 28, 1999 and is headquartered in Hangzhou, China.
Related stocks

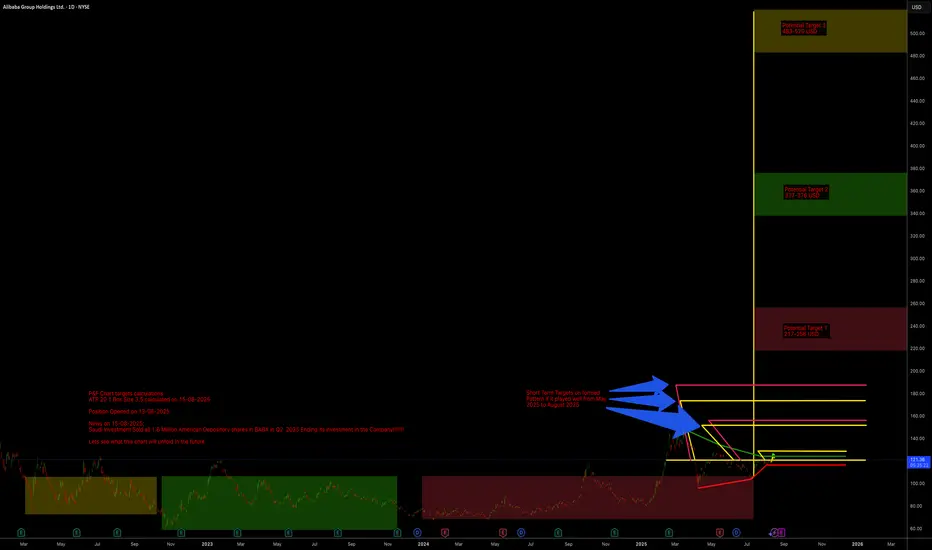
Ali BABA Potential Huge Up Targets ALi BABA have Potential Huge Up Targets with potential 3 years accumulation range from March 2022 to today 15 August 2025.
P&F Chart targets calculations
ATR 20 1 Box Size 3.5 calculated on 15-08-2025
Position Opened on 13-08-2025
News on 15-08-2025:
Saudi Investment Sold all 1.6 Million Americ
Trade With the Tide, Not the Ripple
Most traders misread the idea of “trading with the trend.” Instead of aligning with the primary trend, they zoom into the shortest time frame that agrees with their bias. That’s not discipline—it’s ego at work.
On my desk, the best tool isn’t an indicator or AI—it’s my red couch. I scroll through
Time for reversal?Lots of accumulation on a strong support line from 2015 and almost meets the conditions for a perfect harmonic bat pattern.

BABA: triangle with tensionOn the weekly chart, BABA has already formed a golden cross - price is above both MA50 and MA200, confirming a bullish trend shift. The stock is now approaching the upper edge of the symmetrical triangle and the key resistance at $122, which also aligns with the 0.5 Fibonacci level.
The numbers ins

Alibaba probably near “bottom”. 19/Oct/22As Alibaba previous long term impulsive move was a “leading diagonal” pattern. So there is high “possibility” that its stock price “might hold” above 57.20..

BABA ending a very clean Wyckoff Acumulation schematic here?As the title says. Appears to be a very clean accumulation schematic. Currently in the SOS area. Consolidation could continue for months here. Timing is hard, let's see what happens over the next weeks and months.

Alibaba Weekly Elliot Waves AnalysisBABA is currently in Wave 5. I believe BABA Wave 5 will be an ABC correction. With that being said, I expect a relief pump (wave B) to happen which will last for 1-2 weeks before we continue dumping. I have buy orders set for $85/$86 and at worse, $58. $100 support looks weak based on the lower Fibo

BABA Perfect long positionNYSE:BABA is at a strong level ahead of its next upcoming earnings, I am looking for it to continue within its already formed parallel channel on the weekly chart. The daily shows a strong rejection of its 50ema, consequently breaking a previous swing high. the break indicates possibility of bullis
BABAMy view of the stock BABA for the coming period may be that during the next month, the goals will be achieved

See all ideas
Summarizing what the indicators are suggesting.
Neutral
SellBuy
Strong sellStrong buy
Strong sellSellNeutralBuyStrong buy
Neutral
SellBuy
Strong sellStrong buy
Strong sellSellNeutralBuyStrong buy
Neutral
SellBuy
Strong sellStrong buy
Strong sellSellNeutralBuyStrong buy
An aggregate view of professional's ratings.
Neutral
SellBuy
Strong sellStrong buy
Strong sellSellNeutralBuyStrong buy
Neutral
SellBuy
Strong sellStrong buy
Strong sellSellNeutralBuyStrong buy
Neutral
SellBuy
Strong sellStrong buy
Strong sellSellNeutralBuyStrong buy
Displays a symbol's price movements over previous years to identify recurring trends.
Curated watchlists where BABA is featured.


