$BAC 1W Short IdeaBecause of the way this is grinding at diagonal support looks like it was ready to continue dumping. Not financial advice.
Bank of America Corporation Depositary Shares (Each representing a 1/1200th interest in a Share of Floating Rate Non-Cumulative Pref
No trades
Trade ideas

BAC long positionHello traiders!
BAC is in the up trend. The price bounced from the support as you can see and it is expected to go up to the upsloping resistance which would be a target for longs and an entry for shorts.
If the price closes below the upsloping support, the trade setup is gonna be invalidated.
Good luck!

Distribution Curves and Investing I recently released an indicator called the Cumulative Distribution Density of Dataset indicator. One of the main highlights of this indicator is its, at the time of writing, the only indicator available on Tradingview/Pinescript that assesses the degree of normality as well as the type of distribution of a ticker, index or economic variable. Before this, you would need to export data into a statistical package such as Excel, SPSS, R or SAS to perform such an analysis. So I figured its probably time to talk about the bell curve again.
Some of you may remember, I released an educational video called “Trading Using Bell Curves”:
In this video, I discuss the implications of using bell-curves for trading.
However, I want to reel it back and talk more specifically about distributions and trading, and why you, the investor and/or trader, should be paying attention to them. This is something I honestly have never seen talked about and really, you are doing yourself a huge disservice as a trader AND an investor for ignoring it. so let’s get into it! But before we start, I won't review the basics of the bell curve, but if you are interested, consider watching the video above.
Alright, now on with the math!
Understanding stock distributions, which come in various forms such as leptokurtic, platykurtic, and more, will provide you with valuable insights into market behavior and risk management. Did you know that certain distribution types can alert you that a stock generally has an unstable trajectory? And by looking at the distributions, you can also tell which stocks are more prone to aggressive crashes and which are more stable?
Well you can, and I am going to teach you how! So let’s go over the main types of distributions in stocks and their implications for you as a trader.
Types of Stock Distributions
Normal Distribution
This is probably the one you hear talked about a lot. A normal distribution, also known as Gaussian distribution or bell curve, is characterized by its symmetrical shape. In a normal distribution, the mean, median, and mode are all equal, and data points are evenly distributed around the central value. This distribution tends to be common in nature but tends to be not all that common in long term stocks. There are some exceptions; however. For example, NYSE:BAC (Bank of America) actually has a normally distributed dataset from initial listing to now:
When stock returns follow a normal distribution, it becomes easier to predict future price movements and assess risk more easily. One way to do this is by using the cumulative distribution function (or CDF). Which is a mathematical function that provides the probability that a random variable takes on a value less than or equal to a specific value. For example, if we have 10 students with various test scores, we can plot all test scores using CDF and determine what the probability is that a random student’s test score will be above 90% or below 20%.
We can visualize this on NYSE:BAC by having the indicator plot the CDF for NYSE:BAC :
The image above plots the CDF distribution for NYSE:BAC on the monthly timeframe since its IPO. Because BAC is normally distributed, we can place a high level of confidence in the results of the CDF. We can also use the CDF to our advantage. How? By planning where we could buy.
We should buy when the price is at a level where 50% to 60% or more of the time the price will fall above. Turning back to our BAC example, we can display this with a simple trendline:
We can also operate on the assumption that NYSE:BAC is likely to go lower from here. Why? Because the normal distribution is not yet invalidated. As of right now, BAC retains a normal distribution. Thus, we can expect BAC to cycle back down to bring its CDF back towards 50% and 60%. We can see another example below, AMEX:XLE :
Key Points for Tickers that are Normally Distributed:
They tend to be more cyclical, having periods of sustained decline, followed by periods of sustained rise.
They are the most stable and predictable type of ticker to invest or trade in, but tend to be general underperformers (because of their cyclical behaviour of decline and then rise). However, this is not always the rule, the advantage to a normally distributed ticker is you can calculate your likely returns to a high degree of accuracy!
Some examples of stocks that have a normally distributed history are NYSE:T (AT&T), NYSE:BAC (Bank of America), AMEX:XLE (Energy ETF), T-Mobile and $BABA.
You will generally notice that, if a ticker in one industry is normally distributed, chances are other tickers in the same sector is as well, even international tickers in the identical sector. For example, T-Mobile (TMUS), T (AT&T) and TSX:T (Telus) all are telecommunication providers and all have normally distributed data.
They respond very well to log-linear and linear regression methods.
But what about other distributions? Let’s talk about them.
Leptokurtic Distribution
A leptokurtic distribution is characterized by a higher peak and fatter tails than a normal distribution. In this distribution, extreme events, such as market crashes or rapid price spikes, are more likely to occur compared to a normal distribution. From my experience, most stocks fit this description, but one of major note is NYSE:BA :
Leptokurtic distributions indicate higher volatility and a higher likelihood of extreme price movements. In general, you need to be more cautious with leptokurtic distributions because there is generally heightened volatility. A CDF on a leptokurtic distribution is not as clean, as we can see from plotting BA’s CDF:
Because BA’s distribution is not normal, the CDF becomes slightly unreliable and we cannot employ the 60% rule. So can we still use the distribution to help us gauge entries? Yes! We can! However, it’s a bit more nuanced with leptokurtic distributions.
The first thing to remember with leptokurtic distributions is… they crash… a lot. We can see this with BA:
The flags in this chart represent areas BA has crashed. Crashes in leptokurtic distributions are usually characterized by a drop on the CDF of the probability a stock will go lower to around 75% to 85%. We can see this if we overlay the CDF for BA with the chart:
These are the dips you would want to buy in a leptokurtic distribution. If we take a look at another example, AMD:
Key Takeaways from Leptokurtic Tickers:
They are among the most unstable tickers and experience among the most crashes. Your risk as an investor is heightened on any ticker that is leptokurtic.
They do not respond well at all to log-linear or linear regression methods.
Unlike normal distributions, leptokurtic distributions don’t generally follow sectors and they tend to be company specific tickers (which explains their proneness to crashing and volatility).
Some major examples of leptokurtic distributions are NYSE:BA , NASDAQ:AMD , NASDAQ:MSFT ,
Platykurtic Distribution
A platykurtic distribution has a flatter and wider shape compared to a normal distribution. In this case, the data points are more spread out, and extreme events are less likely to occur.
As such, platykurtic distributions suggest lower volatility and a more stable market environment. However, it is important to know that prolonged periods of low volatility can be followed by sudden spikes, leading to unexpected market movements.
These are extremely rare distributions that I have not observed in any of the tickers I have traded. However, theoretically, platykurtic distributions would come in smooth waves up and down. We can visualize this if we look at SPY’s January 2022 highs till its October lows. This was a platykurtic, negative distribution (indicating a stable downtrend):
Because platykurtic distributions are cyclical, you long on the bullish peaks when the probability of higher prices is >= 90% and short on the bearish peaks when the probability of downside is >= 90%:
However, this is not at all prevalent or observed in stocks ever, so you would be lucky to find a platykurtic distribution!
Key take aways from Platykurtic distributions:
Playkurtic distributions, theoretically, are cyclical like the normal distribution, which make them more stable.
They would be similar to normally distributed tickers in their under-performance, but superior in their ability to not generally experience equal rises and declines.
Skewed Distribution
A skewed distribution is asymmetric, with a longer tail on one side. Positive skewness means the tail is on the right (indicating more extreme positive values), while negative skewness implies a left tail (indicating more extreme negative values).
Skewed distributions can signal a bias in market sentiment. For example, positive skewness may indicate a bullish bias, while negative skewness may suggest a bearish bias. While many people look to EMAs or trendlines to identify long-standing bull or bear markets, its actually not necessary, you can ascertain this simply from the distribution. If we take a look at SPY:
This is SPY’s distribution since the IPO. We can see that it has a positive skewness (right tail), with extreme outliers. This signals to us, the investors, that SPY has been in a bull run since its IPO. Despite multiple corrections and bear markets, SPY retains the distribution characteristic of a bullish stock. In fact, SPY frequently experiences extremely positive outliars (outliars to the upside) more often than extremely negative outliars (crashes to the downside). This is observed with its positive skewedness.
Planning entries on a positively or negatively skewed ticker is a bit more difficult. Crashes substantial enough to bring the probability of going higher to 50% or more tend to be rare (see image below):
So when you are dealing with a positively skewed stock, its best to apply alternative, complementary strategies to determine entries, such as using regression channels, longer running EMAs or time series modelling. You can still use CDFs, but you will need to focus on a narrower timeframe. For example, if we plot SPY from its January high to the current day, we can see the data is normally distributed and thus can refer to our parameters for entry on a normal distribution:
Key Takeaways from the Skewed Distribution:
The Skewed distribution are going to net you your returns (assuming, of course, the ticker is POSITIVELY skewed). These are the tickers that tend to experience exponential growth and returns.
Skewed distributions tend to outperform other distribution types, but not without risk.
Skewed distributions have an inherent tendency to see dramatic outliars either up or down.
Unlike a leptokurtic distribution which is more prone to crashes, a positively skewed distribution is more likely to experience extreme outliars to the upside (meaning bull runs) than to the downside. However, a negatively skewed distribution is more likely to experience more frequent and dramatic drops to the downside than to the upside. So pay attention to the skewness! If it is negative, the risk of a downturn is greatly augmented.
Skewed distributions respond reasonably well to log-linear and linear regression methods.
Famous example is AMEX:SPY of course!
Conclusion
While I didn’t cover all possible distributions, I did cover the main ones to pay attention to. However, I hope you now have a better understanding and appreciation for the importance of paying attention to the distributions of stocks. The importance of this is often underestimated but it is, in fact, a crucial aspect of successful investing and trading. Various distribution types, such as normal, leptokurtic, platykurtic, and skewed, provide valuable insights into market behavior and risk assessment. Investors and traders who take the time to understand these distributions can make more informed decisions, manage risk effectively, and enhance their overall success.
Thanks so much for reading and hopefully you learned something!
Safe trades and, as always, feel free to share your questions and comments below :-).
By the way, the indicator is linked below if you would like!

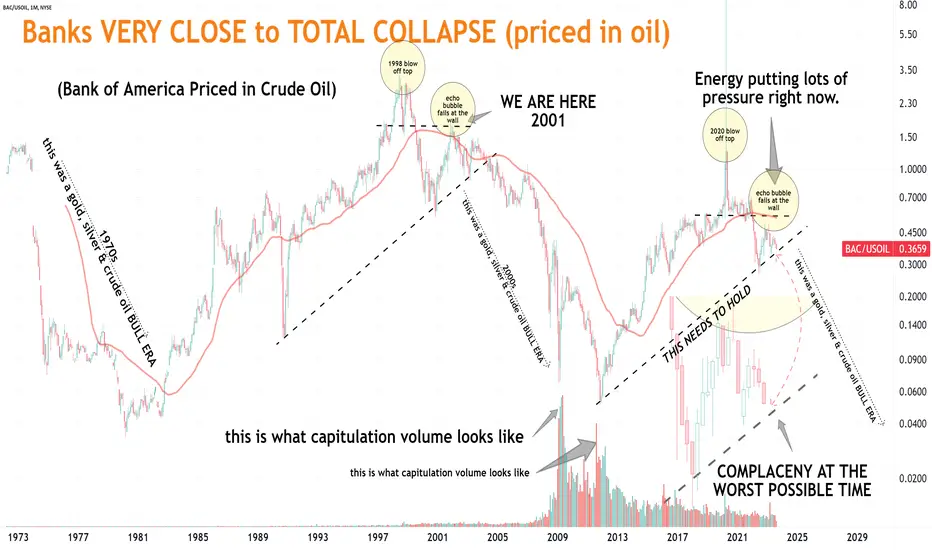
Bank of America vs oil (impacts on silver)MAXIMIUM COMPLACENCY. WHO ELSE IS WATCHING THIS?
Bank of America CONTINUING downfall versus energy!
Silver gained over 1700% and 550% previous times this happened.
Technical notes:
1) 1970s this was a gold, silver & crude oil BULL ERA
2) 2000s this was a gold, silver & crude oil BULL ERA
3) COMPLACENY AT THE WORST POSSIBLE TIME
4) Silver's Performance Tracks Capital Flow Rotation into Oil
5) Energy putting lots of pressure right now.
#gold #silver #crudeoil #energy #banks #inflation

BAC is a good buy due to termoil in the markets. At the price of <$30 per share, this is a good opportunity to buy some Bank of America stock.
There are major issues with the banking system, mortgage market and bond market.
Due to the system we live in, this will lead to destruction of small banks, and the capital will flow into the large established banks. GS is too expensive so BAC offers some more potential.
I also prefer BAC because they are a little bit more open to Bitcoin.

BANK OF AMERICA Stock Chart Fibonacci Analysis 091223 Trading Idea
1) Find a FIBO slingshot
2) Check FIBO 61.80% level
3) Entry Point > 29.2/61.80%
Chart time frame : B
A) 15 min(1W-3M)
B) 1 hr(3M-6M)
C) 4 hr(6M-1year)
D) 1 day(1-3years)
Stock progress : B
A) Keep rising over 61.80% resistance
B) 61.80% resistance
C) Hit the bottom
D) Hit the top
Stocks rise as they rise from support and fall from resistance. Our goal is to find a low support point and enter. It can be referred to as buying at the pullback point. The pullback point can be found with a Fibonacci extension of 61.80%. This is a step to find entry level. 1) Find a triangle (Fibonacci Speed Fan Line) that connects the high (resistance) and low (support) points of the stock in progress, where it is continuously expressed as a Slingshot, 2) and create a Fibonacci extension level for the first rising wave from the start point of slingshot pattern.
When the current price goes over 61.80% level , that can be a good entry point, especially if the SMA 100 and 200 curves are gathered together at 61.80%, it is a very good entry point.
As a great help, tradingview provide these Fibonacci speed fan lines and extension levels with ease. So if you use the Fibonacci fan line, the extension level, and the SMA 100/200 curve well, you can find an entry point for the stock market. At least you have to enter at this low point to avoid trading failure, and if you are skilled at entering this low point, with fibonacci6180 technique, your reading skill to chart will be greatly improved.
If you want to do day trading, please set the time frame to 5 minutes or 15 minutes, and you will see many of the low point of rising stocks.
If want to prefer long term range trading, you can set the time frame to 1 hr or 1 day.

Bank of America Priced in Silver v220 YEARS LATER...
Bank of America (priced in silver) still down over 85%.
It now needs a 600% move to get back those highs.
Always use gold or silver to remove the fiat illusion.
Technical notes:
1) below cloud +1 & 3 year moving averages
2) right above early breakdown line
3) complacency volume
4) below wall (support turned resistance)
Until this changes, beware.
#banks #gold #silver #bankofamerica


Looking for deeper correction before going longI like BAC, But it seems quite clear to me that we are going deeper.
So where is the next logical support?
well, it would be the completion of a harmonic shark, a historical support, and the touch on the bottom of a falling wedge.
3 different types of market participants, and maybe even more signs will show up at that time, will likely place market bids here.
Patience will bring opportunity.

BAC - horizontal and diagonal support, updated forecastLONG BUY ~$28.50, SL: $27.55, T1: $32.40, T2: $36.00
1. Horizontal and diagonal support
2. Good R/R
3. Updated analyst forecast +22.14%
Disadvantage - Dioganal resistence

Bank of Amercia QuarterlyARE WE AT MAXIMUM COMPLACENCY?
Bank of America's momentum grinding to a halt.
This makes it vulnerable for a prestigious fall.
#Banks #Recession #BankingCrisis #Inflation

Bank of America bullish signalBAC has bullish setup, potential target is $40 level. There was strong consolidation between $30-37 levels, now bulls are strong enough to move price +40%.

BAC 03.08.2023 LONGAsset and Time frame -BAC DAILY
Entry Price -31.49
Exit(Stop Loss) -30.17
Exit(Take Profit) -35.53
Price bounced off the significant 38$ level after a restest, which is also the 0.382 Fibonacci level from the lows to the new high, just before that price succeeded in breaking the daily 100 MA with decent volume post earnings.
Good luck

my levels to manage BACBased on 16 Wall Street analysts offering 12 month price targets for Bank of America in the last 3 months. The average price target is $34.73 with a high forecast of $49.00 and a low forecast of $28.00. The average price target represents a 21.86% change from the last price of $28.50.

Burton Malkiel should Reconsider Market Randomness..!last night I published 3 analyses on 20 tickers and shared the links with my followers. (private posts)
20 out of 20 tickers behave as predicted today..!
The odds of being correct is 1 in 1,048,576..!
Banks:
BAC,WFC,JPM,C,MS,and GS
They are all down but they are near their support levels.
they could experience a rally before their earnings!
Keep your eyes on them for a possible 10% rally.
Airlines:
AAL, DAL,UAL,LUV,ALK, and SAVE
They all made bearish engulfing (except SAVE), in the weekly chart near the upper border of a bearish channel!
Lower prices in the coming weeks are the strongest possibility!
EV makers:
TSLA, LCID, RIVN, FSR, NIO, XPEV,Li, and WKHS
All of them rejected their resistance and could experience lower prices, but the exception is LCID which is already at its support!
LCID could be the only one to experience higher prices..!
Have it on your watchlist!
Today's charts:
Banks: 6 out of 6 positive..!
Airlines: 6 out of 6 negative!
EV makers: 8 out of 8 negative:
Dear Mr. Malkiel,
You need to Update the book you have written in 1973, 5 years before computers became available to public..!
Best,
Dr. Moshkelgosha M.D
DISCLAIMER
I’m not a certified financial planner/advisor, a certified financial analyst, an economist, a CPA, an accountant, or a lawyer. I’m not a finance professional through formal education. The contents on this site are for informational purposes only and do not constitute financial, accounting, or legal advice. I can’t promise that the information shared on my posts is appropriate for you or anyone else. By using this site, you agree to hold me harmless from any ramifications, financial or otherwise, that occur to you as a result of acting on information found on this site.

Bank of America is Shaping Up to Be Just Like PacWestWhen comparing the price action between BAC and PACW, it can be seen that both stocks exhibit the same price action, which is a Rising and Broadening Structure leading into the PCZ of a Bearish Alt-Bat, which all eventually came to a halt upon getting Bearish PPO Confirmation. This led to a breaking of the 21-Month SMA before ultimately flushing down to all-time lows after months of treating the 21-Month SMA levels as resistance.
The same price action can be seen on Bank of America; it is just 1 step behind PACW at this point in time, which is the flipping of the 21-SMA into resistance. The next step would be for it to crash below the 2009 lows.

Bank of America priced in SilverPriced in silver...
#BankOfAmerica's recovery momentum since 2008 has been stifled and now rolling over.
Always price in #gold or #silver.
Remove the #fiat illusion.

(BAC) 3H - Bull Bat Type1 EntryI went long @ 28.45 yesterday. This pattern should be treated as a reaction; the Natural harmonic Reaction to the .236 retracement is the most likely outcome and is in fact a high probability trade. This patterns structure suggests that a move to 2.54-2.91 is certainly possible. I contend that that will not occur until the pattern at very least yields a NHR. Despite this possibility, I have my eyes on a larger move that perhaps will be a part of an emerging Harmonic Range. I am hopeful yet wary. The key will be the action at .236 retracement level. If price rejects there either a deep retrace to retest the lower median line or a divergent move to the 1.13 extension is likely to occur.

BACI'm not getting a lot of confidence that this blue uptrend line dating back over a decade is going to hold.

BAC Short Trigger incoming! Analysis of Bank of America Stock: Support, Risk, and Stop-loss
Bank of America's stock is currently finding a support level at $28.71, backed by accumulated trading volume. This level presents a potential buying opportunity, as historical patterns suggest an upward price reaction when this support level is tested.
In terms of daily price movements, Bank of America's stock displays average volatility, accompanied by robust trading volume. This places the risk level at a moderate range. In the most recent trading day, the stock exhibited a price range of $0.370 between its highest and lowest points, equivalent to a 1.28% fluctuation. Looking at the past week, the stock has maintained a daily average volatility of 1.68%.
The Relative Strength Index (RSI14) indicates that Bank of America's stock is currently oversold, with a reading of 23. While an oversold condition on the RSI might lead some stocks to experience substantial and extended declines before a reversal, it's important to note that this also introduces a higher degree of general risk.
It's advisable to consider these factors while evaluating your investment decisions for Bank of America's stock, taking into account the support level, risk level, and the potential implications of the oversold RSI condition.🩸

Bank of America priced in oil v2Bank of America (priced in oil) is getting VERY CLOSE to MELT DOWN mode...
BUCKLE UP!
#crudeoil #uranium #gold #silver #bankingcrisis
Energy putting lots of
pressure right now.
COMPLACENY AT THE
WORST POSSIBLE TIME
(no volume)

Bank Of America Priced in OilWhile it may not feel like it now, #Gold and #Silver BULL ERAS lie just ahead...
We are witnessing MAXIMUM COMPLACENY...
at the ABSOLUTE WORST TIME !!!
#CrudeOil on brink of historical BREAKOUT.
#Banks on brink of historical BREAKDOWN.
#fintwit #bankofamerica #inflation
BAC - Another Leg Down?If this recent move proves to be an A-B-C correction, then some cheap puts are in order here. I bought some Jan 25 Puts. I also hold a BAC covered call position for Jan 35. So I am also acting to ensure protection against potential downside that can drop price into the low 20s.
