$NET - TRADE IDEAHere is a trade idea on net. I think we are in wave 2 still and need to go make 1 more new low near the 61.8 - but could be wrong. A move over the last pivot high ~145 and I will be targeting wave 3 PT of 165. This is going to be either 1 of two things:
1) over top breakout - momentum trade looking at short term likely 150c (14 days most likely)
2) BTD trade near 61.8 and seeing a reversal out of that area - this BTD would be with time and likely target lower strike 140. That way on the 145 test can be first trim zone
Trade ideas

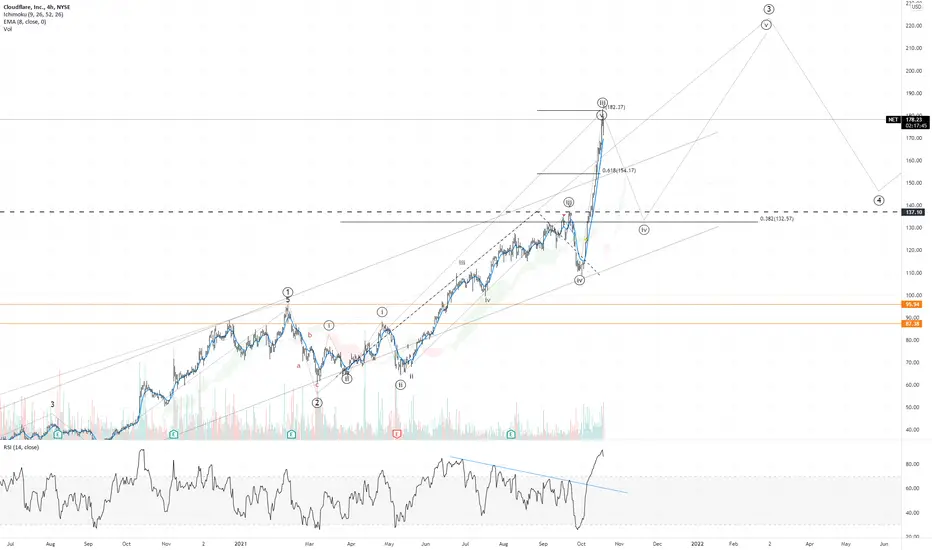
Cloudflare teaching moment. Meteoric rise = catastrophic dump.Hi everyone,
Today I would like to share a piece of knowledge on parabolic growth and poor market structures.
Let us take a look at NYSE:NET Cloudflare stock.
This was an attractive buy back in 2020. As always, nobody saw that until everyone started screaming about this stock on Twitter.
I saw an opportunity in investing into Cloudflare later in 2021 for a long-term.
I did not know what's coming.
At the beginning of October, after a decent sell-off something strange began happening.
Stock rose TWELVE days in a row. And not just stayed barely positive, it gained insane 68% in price during this short period.
Right there I knew this was not sustainable and price won't last up there for long.
Yes, I sold at 175 .
Yes, I missed a run up to 220 .
But, really, did I?
Noone can predict the top. But you can predict the inevitable downfall.
The Lesson.
Look at the chart.
You see the price in the first box going parabolicly up. The price took off to the moon and was hovering up in the air. Thus, poor structure has been created.
There is no single support level from 137 to 182 .
The Market hates poor weak structures and it tends to repair them sooner or later.
That is exactly what happened with Cloudflare stock.
Price has been flushed from 204 down to 123 as fast as it flew up there back in October. You can see that in the second box.
The structure has been repaired. A lot of data points were created in the process, which will help with the analysis in the future.
This might be a rebirth of Cloudflare stock constituting healthy future movement.
Trade wisely and good luck!
-----------------------------------------------------------------------------------------------------------------
Disclaimer!!!
This is not financial advise

Falling Wedge- BullishNET starting to catch my eye here after holding this falling wedge for quite some time now. Seemingly has found some support as it closed on the daily timeframe sitting right on its 200-Day EMA. Bullish and will be looking for a breakout from this wedge (Broader Markets Permitting) - Just some support and resistance levels along with some RSI-based supply and demand zones to keep an eye on the meantime-
Hourly Timeframe Attached Below
- Sitting on its 200-day EMA
- RSI is Nearing Oversold Territory (Not Pictured)
- Bollinger Bands Squeezing on the Hourly Timeframe (See Attached Chart Below)
- Bullish Hidden Divergence on the RSI on the Hourly Timeframe (See Attached Chart Below)
- MACD Cross on the 4-Hour Timeframe (Not Pictured)
- Buyer Volume Starting to Pick up Relative to Seller Volume
PT1- $132.34
PT2- $134.40
PT3- $136.36
PT4- $138.92
--Hourly Timeframe--

NET1. We see the retention of ema200 and the level of 132.7 (not measured). If we have a supposedly stretched fifth in the third wave, then wave A has now formed
2. Formally, we are still in the channel.
3. RSI, MFI form the bottom and even small divergences of Class B and A, respectively.
4. There are also hidden divergences. The RSI is relative to the previous bottom. MFI is a hidden diver relative to the last bottom, as well as relative to the last touch of ema200.
5. We hold 0.786 of the last jerk.
6. We can go lower and test the 113.5 zone, to fibo 0.5 relative to the entire annual movement + ema60
7. The weekly is not so positive, only a weak hidden diver on the rsi.
Takeaways in the yellow fibo zone.
Marking by fibo, the fibos themselves with fillings are not in the logarithm.
If there is no big growth in all, you can still try to win back a 2-5% rebound.


in $NET on uptrend line$NET has great tech. Long NET on uptrend line. $NET has great tech. Long NET on uptrend line. $NET has great tech. Long NET on uptrend line. $NET has great tech. Long NET on uptrend line.

$NET - At major trend line support & demand zone, calls > 146 $NET - At major trend line support & demand zone, calls > 146
- Daily inside bar formed

Net 3 black crows🐻 This stock has had one of the biggest rallies in the second half of 2021. Ran up 100% in 2months. Now showing a huge reversal candlestick pattern that I think will bring this stock back to 85$ support.

$NET - multi opportunity short I love me a layered H&S on the weekly. Buying long puts - hold and hedge just in case.


NET - bounce candidate?While this is definitely on my 'high price/sales ratio' short candidate list, some of the action the past few days is suggestive of a short term bottom/bounce.
* MACD starting to turn up (hourly almost crossing the 0 trigger line)
* RSI coming out of oversold
* (not shown) coming out of bottom end of bollinger bands)
* a few long wick hammer-esque candles
* possible descending wedge (not well supported by volume story tbh, and could even be a downtrend *channel*),
I'm looking for a trade up to 170 in the next few sessions -- an optimistic view might be up to 180.

NET, Daily, Deep Crab NYSE:NET
$NET CloudFlare,
Daily, Deep Crab
-------------------------------------------------------
Buying between 130.54 - 145.49
Sell @ Target I : 165.58 , Target 2 187.23
DISCLAIMER:
I am not a financial /investment advisor. All information i am sharing here is for entertainment purposes only and should not be considered personal investment advice. While the information provided is accurate, it may include errors or inaccuracies. Please, do your diligence when it comes to investing or trading in the market. You are responsible on your choice. Thank you

Buy CorrectionShort term (rest of the year) Cloudflare will be in a correction (profit booking) like the rest of the market, which has been driven up crazy since the march dip 2020.
Cloudflare will find support at 0.786 Fibonacci around 130-140$ which will be a good entry point for the start of next year 2021.

NET - Market leader Setting up for leg higher.
VCP during consolidation.
Needs to show some RS next selling day, weak 11/10 with markets red.


nice area to take longbreaks up and tests for support add on/right after test
use lower time frames to see test
first box is price target once above and tests for support nxt price target is 1/2 ATR to full ATR
short if breaks major support (bottom box) with test up for resistance (can be seen on lower time frame)

How is this going to endI have been wrong about this stock a few times in the last few weeks considering its done and it shouldn't be going up anymore. Well, i was wrong.
I think this stock still has 20% upside and will reach up to 260+ before it will see a significant correction.
With today's earning beat this will rally tomorrow and i don't have an entry point yet. if someone is long already, this is just my view on where the profits can be booked.


$NET Put idea...Market looking weak, grabbed a net $180 put at $2.00 earlier, now $2.43 could make it a spread with selling the $170 or $165

Crazy stockWE shorted this first at 132, covered at 115. Went long at 113 and i covered my position fairly early and tried shorting it again, this stock didn't stop at nothing. I think its overstretched and i have taken another short attempt today.
NET idea #1Working on its 11th consecutive higher daily close on decreasing volume.
Will look for shorts under 165.

NET to 195 then pullback Should have a little more room to 195 resistance then I think we pullback to 175 support.
Overbought on weekly RSI,MacD, MFI, Bollingerbands.
This run this stock has had reminds me of Oracle's summer run.. it happens when there are limited shares of a company and institutions are buying it up

$NET if the market pulls back...One more try here, Net $170 puts 10/29 for $2.20, tight stop if we push into close...
