$RKT Elliott Wave Setup — Wave (3) of 5 LoadingNYSE:RKT
Elliott Wave Setup — Wave (3) of 5 Loading
Daily | $21.65
Count:
✅ (1) Complete — Nov
✅ (2) Complete — ABC to $17
🔄 (3) In Progress → $29-30
📍 (4) Projected → $23-24
🎯 (5) Terminal → $39.60
Levels:
❌ $17.00 — Invalidation
⚠️ $21.41 — Channel support
📍 $21.65 — Current (0.5 fib)
🔼 $24.88 — Wave (A) high
🔼 $27.48 — 1.0 fib
🔼 $30.34 — Wave (3) target
🎯 $35.00 — 1.618 ext
🎯🎯 $39.60 — Wave (5) / 2.0 ext
Confluence:
Channel support holding
0.5 fib retracement zone
Wave (B) of (3) completing
ER Feb 19 = catalyst for Wave 3 impulse
R:R:
Entry: $21.50
Stop: $20.00
Target: $39.60
R:R = 12:1
Sitting at channel support + 0.5 fib + Wave B completion zone. This is the entry.
🎯🚀
What traders are saying

$RKT to $25?Hello Traders!
NYSE:RKT Setting up for a nice breakout
Has support right underneath at about $20.60
I have my price target at equal highs at 24.50
Really steep trendline here and made a perfect pullback to the support at 20.60
This will definitely be on my watchlist the next few days!

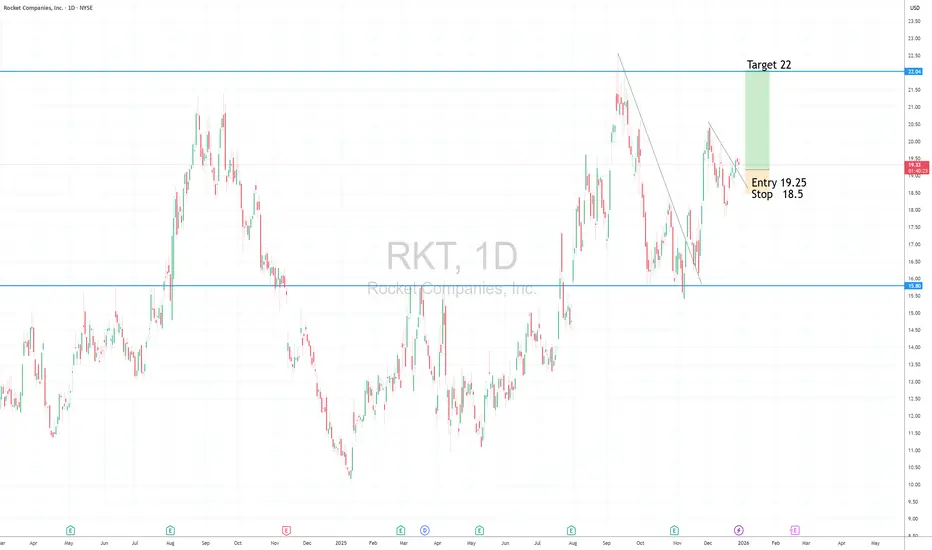
RKT Longtrendline break + retest
Long entry 19.25
Stop 18.5
Target 22, 30(Weekly chart target)
Risk management is much more important than a good entry point.
I am not a PRO trader.
In my trading plan, the Max Risk of each short term trade should be less than 1% of an account.
RKT: What are you seeing?
RKT
.
Instead of overcomplicating technical analysis, the market is really just a few candlestick patterns like these.
.
US STOCKS- WALL STREET DREAM- LET'S THE MARKET SPEAK!
RKT Monthly Chart AnalysisCurrent Setup:
Price: $23.24 (+20.04% current month)
Testing critical resistance zone: $20.14-$21.47 (prior accumulation range acting as supply)
Clean breakout above multi-year consolidation base (~$10-$11 floor)
Technical Structure:
Bullish Case:
Fib retracement from 2021 highs shows price reclaiming the 1.0 level ($20.23) - significant
Measured move target at $34.49-$34.73 is geometrically sound (projected from the base width)
Monthly close above $21.47 confirms breakout; currently trading through it
Volume context needed but price action suggests accumulation phase complete
Key Levels:
Support: $20.14 (must hold on retests), $11.03 (invalidation)
Resistance: $25.80 (1.382 fib), $29.24 (1.618), then measured move target zone $34.49-$34.73
Extended fibs: $40.85 (2.414), $43.83 (2.618) if momentum sustains
Risk Considerations:
Monthly candle isn't closed yet - wick rejection possible
Prior SELL signals (2021) marked major distribution; need confirmation this isn't a lower-high setup
Mortgage/housing sector sensitivity to rate environment

8:23 AM RKT 15m Analysis8:23 AM
RKT 15m Analysis
Structure: Descending wedge/falling wedge after impulsive move up into supply zone (24.34). Classic continuation pattern forming within the prior bullish displacement.
Key Levels:
Supply: 24.34 (prior high, marked resistance)
Demand: 23.64 (green zone, unfilled FVG from the impulse)
Current: 23.82, sitting on dynamic support (orange trendline convergence)
Confluence:
RSI showing bullish divergence (higher lows vs. price lower lows) at 58-61 range
Volume declining on the pullback (healthy for wedge)
Price compressing into apex near the 50% retracement of the impulse
Trade Setup:
Aggressive Entry: Current price (23.82) with stop below wedge support ~23.55 (below demand zone)
Risk: ~$0.27/share
Target 1: 24.10 (prior swing high within wedge)
Target 2: 24.34 (supply retest)
R:R ~1:1 / 1:2
Conservative Entry: Wait for wedge breakout confirmation above 24.00-24.05 descending trendline
Stop: 23.70
Target: 24.34+
R:R ~1:1 minimum
Edge Cases/Concerns:
Wedge could break down—if 23.64 demand fails, next support ~23.40 (green MA)
Pre-market chart; watch for gap/liquidity issues at open
No clear SMC displacement yet on the breakout side
Bias: Bullish, conditional on wedge holding. The drawn arrow target (24.34) is reasonable for a measured move.

RKT Daily Chart AnalysisCurrent Setup:
Price at $23.44, +3.40% on the session
Just broke above the "Premium" zone (~$23.44 horizontal) and tagged "Weak High" resistance
Pre-market showing $23.50
SMC Structure:
Multiple CHoCH (Change of Character) and BOS (Break of Structure) confirmations through 2025
Strong Low established around $10.50 (Nov 2025 sweep)
Price reclaimed equilibrium (~$17-18) and now testing premium
EQH (Equal Highs) clustered around $21-22 area have been swept
Key Levels:
Immediate resistance: $23.44 (current), then $25-26 (premium extension)
Projected targets: $37.55 (cyan horizontal), potentially $40+ per the drawn channel
Support: $20.60 (orange ascending trendline), $17-18 (equilibrium), $14-15 (discount OB)
Structural Bias:
Bullish. The ascending channel from late 2024 lows is intact. Break above weak high suggests liquidity grab setup succeeded, implying continuation toward the $30+ target zone.
Caveats:
"Weak High" label suggests this level could reject—watch for daily close confirmation
Volume profile (bottom bars) shows distribution concentration in lower ranges; thin air above $24
The $37.55 target is ambitious (~60% upside)—would need sustained momentum and likely macro/sector tailwinds (mortgage rates, housing data)
Trade Consideration:
Long bias valid above $23.44 daily close. Invalidation on daily close below $20.60 trendline. R:R favorable if targeting $30 with stop below $21.

RKT | Ascending Triangle Apex + $789K Options Flow = Breakout INYSE:RKT
Macro Structure (4H)
RKT has been compressing in an ascending triangle since mid-2025. We're now at the apex — a resolution is imminent.
Structure:
Higher lows: $8 → $14 → $16 → $22
Resistance: $25-26 (tested and rejected 3x)
Current: $23.45 (coiling at upper bound)
Rising trendline support: $22.00
SMC Confirmation:
CHoCH confirmed at $10 in early 2025 — macro trend flipped bullish
Multiple BOS (Break of Structure) on the way up
Currently in Premium zone, consolidating below weak high
Equilibrium at $19-20, Discount zone $14-16
Options Flow Confluence
Scanned institutional flow and found:
MetricValuePremium$789,286Strike$25 (exactly at resistance)ExpiryFeb 20ExecutionAbove Ask (maximum urgency)Score0.93 (exceptional quality)Size7,282 contracts SWEEP
Institutions are betting on the breakout. They don't sweep $789K above ask for a rejection play.
Catalyst Stack
Trump Mortgage Policy — $200B mortgage bond purchase announced, directly benefits RKT
Mr. Cooper Acquisition — Makes RKT largest mortgage originator AND servicer in US
Redfin Integration — One-stop real estate platform synergies
Earnings Feb 25 — Positioned for pre-earnings run
Rate Cut Expectations — Fed cuts = mortgage volume surge
Price Targets (Breakout Scenario)
If RKT closes above $26 on volume:
TargetPriceMethodT1$28-30Initial breakout momentumT2$3550% measured moveT3$44Full measured move (triangle height)
Measured Move Calculation:
Triangle height = $26 - $8 = $18
Breakout point + height = $26 + $18 = $44
Trade Plan
Entry: Current ($23.45) or on confirmed break above $26
Stop: Below $22 (trendline break)
T1: $28-30 (+20-28%)
T2: $35 (+50%)
T3: $44 (+88%)
Options Play: Feb 20 $25C — directly aligned with flow and breakout level
Invalidation
Close below $22 = trendline broken, exit
Close below $20 = structure failed, full stop
Probability Assessment
OutcomeProbabilityBreakout to $28-3065%Breakout to $35+40%Rejection at $2625%Breakdown below $2210%
Conclusion
Ascending triangle at apex + $789K institutional flow at $25 strike + multiple catalysts aligned = high probability breakout setup.
Compression leads to expansion. The question isn't IF it moves — it's WHEN.
📐 Chart says breakout
💰 Flow says breakout
📰 Catalysts say breakout
When all three align, you pay attention.
NFA | DYOR
Tags: RKT, RocketCompanies, Mortgage, AscendingTriangle, Breakout, OptionsFlow, SmartMoney, TechnicalAnalysis, SMC, SwingTrade

RKT Rocket Companies Options Ahead of EarningsIf you haven`t bought RKT before the previous earnings:
Now analyzing the options chain and the chart patterns of RKT Rocket Companies prior to the earnings report this week,
I would consider purchasing the 13usd strike price Calls with
an expiration date of 2026-1-16,
for a premium of approximately $1.37.
If these options prove to be profitable prior to the earnings release, I would sell at least half of them.

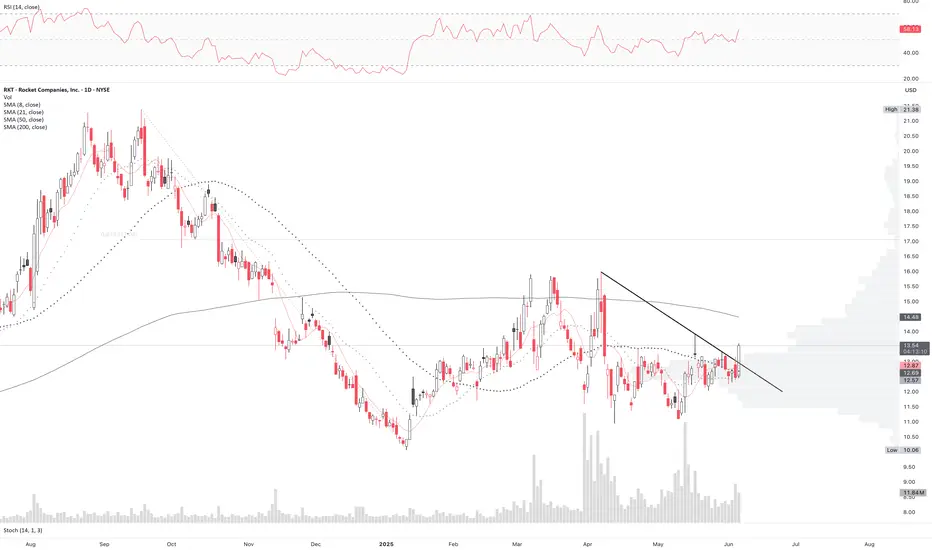
RKT - Rocket Companies - $22.70 PTLooking at $22.70 Retest / Price Target for RKT based on the continued bullish movement and breaking through previous levels or resistance at the $19.78 Price Level. We need to confirm support above that level first before moving forward, which justifies the potential for consolidation on the lower support trend before proceeding.
Rocket Companies shares are trading higher following softer-than-expected US jobs data. This has caused a drop in yields and could raise hopes of a rate cut, as well as Mr. Cooper stockholders approving the merger with the company.

RKT – Cup & Handle Breakout Setup + Bullish Earnings Beat (TargeSummary
Rocket Companies (RKT) has formed a multi-year Cup & Handle pattern, now testing the key breakout zone at $19.8–20.2. Last week’s earnings beat (+41% EPS surprise, +6.6% revenue surprise) adds bullish sentiment. A confirmed breakout with volume could trigger a strong continuation move toward higher Fibonacci targets.
Technical Confluence
Cup & Handle : Clean rounded bottom from 2022–2024 with a shallow handle retracement – classic bullish continuation setup.
Harmonic Structure (ABCDX – Bat Variant):
AB ≈ 0.55 of XA
BC ≈ 0.836 of AB
CD ≈ 1.677 of BC
D ≈ 0.861 of XA – potential resistance zone, but breakout above invalidates the short harmonic bias.
Momentum Indicators:
RSI trending higher, not yet overbought on daily.
MACD positive with expanding histogram.
Stochastic elevated, which can remain high during strong breakouts.
Volume: Recent spikes around earnings support the possibility of sustained interest.
Trade Plan
Breakout Trigger
Daily close > $20.20
Volume ≥ 1.5× 20-day average volume
Entry Levels
Conservative: $20.20–20.60 after confirmed breakout + retest
Aggressive: $19.20–19.60 on handle bounce (higher risk)
Stop Loss
Conservative: < $17.40 (below handle low / major support)
Aggressive: < $18.10 (break back into handle)
Profit Targets
T1: $21.8–22.5 (prior swing high / X point)
T2: $25.5–26.8 (Fib 1.272 extension)
T3: $30–33 (Fib 1.618 extension & full cup projection)
Invalidation
Weekly close < $17.5 would negate the bullish structure in the medium term.
Alternative Scenario (Bull Trap)
If $20.2–20.5 rejects with a reversal candle + low volume, expect a pullback toward $18.2–17.5. A break below $17.5 could extend to $15.8 support.
Fundamental Context
Earnings Beat: EPS surprise +41% ($0.04 vs. $0.028 est.), Revenue +6.6% above estimates.
Macro Sensitivity: Highly responsive to mortgage market and interest rate outlook. Rate stabilization or declines could act as a tailwind.
Next Catalysts: U.S. inflation data, Fed rate policy updates, mortgage origination volumes.
Risk Management
Only take breakout entries with volume confirmation.
Scale out partial profits at each target.
Move stop-loss to breakeven after T1 is reached.
Position sizing: risk ≤ 1–2% of account equity.
TL;DR
RKT is at a critical Cup & Handle breakout zone post-earnings beat. A confirmed breakout > $20.20 with strong volume targets 22.5 → 26.8 → 30–33, stops at 17.4–18.1. Watch for rejection signals at $20.5 for a possible short-term pullback.
#RKT #CupAndHandle #BreakoutSetup #HarmonicPattern #TechnicalAnalysis #SwingTrade #EarningsBeat

RKT Consolidates Above $10 Ahead of $18 BreakoutNYSE:RKT has been consistently making higher highs since late 2022.
A rally toward the end of 2023 drove the price up from $7 to around $18. Although the expanded supply block at that level has capped further gains, the price continues to consolidate above $10, still finding support from the mitigation block in that area.
However, because the consolidation is ongoing, the current price trend remains unclear—both the 30- and 50-period EMAs are flat.
In the medium term, once this consolidation phase completes, the price is expected to resume its move back toward $18 and beyond.

Tripe bull div with confrontation from the stochastic on RKT Rocket mortgage has a triple bullish divergence on the one hour chart, lol time frames as well, One indicator I’ve used to confirm this is my own and they would not let me publish it
$20 target for RKT??NYSE:RKT looking good here with a clear breakout.
not only did we cross the creek but we also have a very nice spring back test visible on the daily.
this thing is looking at higher prices if momo keeps up!
RKT TRENDS AND PRICE TARGETS Wedge is between a strong support trend and a weaker but still strong rejection trend. Expecting the support to win out, it looks like we could climb up to around 20.
Price targets and trends are market.
good luck with RKT!
Follow for more charts like this.

RKT Ready To Rocket?NYSE:RKT Looks prime to cross the creek and head for higher prices.
Would of been much better to get in around the $11 mark.
At this point I'm either waiting for a pull back or a cross of the supply line
Either way, this is name to add to your watchlist for sure.
Happy Trading

Rocket Companies (RKT) – Fintech-Driven Mortgage GrowthCompany Overview:
Rocket Companies NYSE:RKT is a fintech leader in mortgage and real estate solutions, leveraging AI-driven efficiency to enhance profitability and market share.
Key Catalysts:
Surging Profitability & Efficiency 💰
Adjusted EBITDA margin rose to 18% in Q4 2024, up from 2% a year prior, reflecting strong financial performance.
Rocket Mortgage Growth 📊
Net rate lock volume surged 47% YoY to $23.6 billion, far outpacing industry trends.
Expanding Servicing Portfolio 📈
The $593 billion servicing portfolio (+17%) provides stable revenue and cross-selling opportunities, acting as a hedge against rate volatility.
Resilient Market Share Expansion 🏆
Despite industry headwinds, Rocket continues to grow market share, proving its competitive edge in mortgage lending.
Investment Outlook:
Bullish Case: We are bullish on RKT above $11.80-$12.00, driven by profitability gains, market expansion, and portfolio strength.
Upside Potential: Our price target is $20.00-$21.00, reflecting sustained growth and operational efficiency.
🔥 Rocket Companies – Powering the Future of Mortgage & Fintech. #RKT #MortgageTech #FintechGrowth

RKT Rocket Companies Options Ahead of EarningsAnalyzing the options chain and the chart patterns of RKT Rocket Companies prior to the earnings report this week,
I would consider purchasing the 13usd strike price Calls with
an expiration date of 2025-4-17,
for a premium of approximately $1.25.
If these options prove to be profitable prior to the earnings release, I would sell at least half of them.

Speculative Price Prediction of Rocket Companies, Inc. (RKT)Price Prediction:
Short-term (1-3 months): The price is likely to test the $10.00 support zone. If breached, expect a rapid decline to $7.38.
Mid-term (6-12 months): A potential recovery to $13.69 depends on improved earnings and bullish technical patterns, with $15.47 as the upper bound.
The technical and fundamental outlook for RKT remains bearish in the short term, with a speculative potential for mid-term recovery contingent on structural improvements and positive earnings surprises. Aggressive traders may capitalize on short opportunities near $10.20, while conservative traders should await a confirmed breakout above $12.50 for long positions. Adherence to strict risk management is paramount due to heightened volatility.

2025 Long-Term Buy RKTWatching a long-term buy opportunity on NYSE:RKT in 2025
The Jeanius Indicator give me the following buy signals:
Took out liquidity at 3 untested low dating back to February
Filling a Fair Value Gap created in December '23

Trade Idea RKT Rocket MortgageRecently mortgage application starts came in higher than expected and with the anticipation of rate decreases going forward it appears people are trying to front run a busy home buying season next spring. By my count we are due at least 1 more high before a pullback and as we know wave 3's can extend.
Price Target is $25
NYSE:RKT

Rocket Companies Inc. | Chart & Forecast SummaryKey Indicators On Trade Set Up In General
1. Push Set Up
2. Range Set up
3. Break & Retest Set Up
Notes On Session
# Rocket Companies Inc.
- Hypothesis Entry Bias | VWAP
- Retracement 1 | Double Formation At 21.30
- Double Bottom & Falling Wedge | 0 & 0.382 | Retracement 2
- Forecast Template | Range Structure
Active Sessions On Relevant Range & Elemented Probabilities;
London(Upwards) - NYC(Downwards)
Conclusion | Trade Plan Execution & Risk Management On Demand;
Overall Consensus | Neutral
