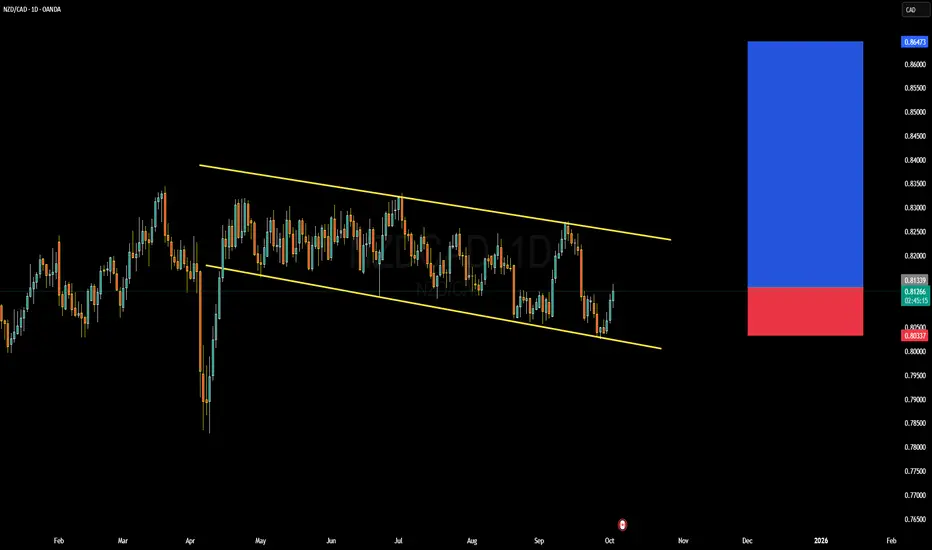
NZDCAD: Short-Term Bullish Move After BreakoutNZDCAD: Short-Term Bullish Move After Breakout
Yesterday, NZDCAD broke out of a strong zone and, after retesting support near 0.8065, the price bounced and resumed a bullish move.
This could turn into either a larger rally or just a corrective move, since the NZD still shows overall weakness.
H
Related currencies

NZDCAD → A false breakthrough will trigger a decline FX:NZDCAD is forming a countertrend correction with the aim of retesting key resistance and the liquidity zone amid a global downtrend.
A reaction to the support zone is forming. The price is recovering, but within the global downtrend. The countertrend movement may end in the resistance zone

NZDCAD Forming Falling WedgeNZD/CAD is currently holding near a structural demand zone, after a sustained downtrend in recent months. Price has shown multiple rejections of lower levels, forming a potential accumulation base—this hints at a possible swing reversal if bulls step in with conviction. On the upside, the key pivot
NZDCAD weekly range CLS candle manipulation LongNZDCAD candle shows clear manipulation candle on weekly range formed almost an engulf candle ´ enter on pullback , let us see how it plays out

NZD-CAD Free Signal! Buy!
Hello,Traders!
NZDCAD taps into demand and holds structure, with Smart Money accumulation pointing to higher pricing. Imbalance fills hint at continuation toward premium levels.
-------------------
Stop Loss: 0.8105
Take Profit: 0.8158
Entry: 0.8136
Time Frame: 3H
-------------------
Buy!
Commen

NZDCAD LONGAfter it failed to buy last week. We again attempt to buy. we have a fair value gap which I expect to be filled at 0.80800 before we go u again.

NZDCAD Bearish Breakout!
HI,Traders !
#NZDCAD made a bearish
Breakout of the key horizontal
Level of 0.80642 and the
Breakout is confirmed so
We are bearish biased and
We will be expecting a
Further bearish move down !
Comment and subscribe to help us grow !

CAD/NZDBeginning of oil price increase, strengthening of the CAD, and future cash rate cut by the NZD

NZD/CAD: This Hard As Stone Support Area Will Be Our Next TargetHere is my 4H NZD/CAD chart, this will be my third time to enter from this area of support. If u take a closer look u will see how strong and stubborn this support area and it pushes the price very high each time it comes near it, so I will enter a buy trade once the price is near it and it gives me

Bullish bounce off?NZD/CAD has bounced off the support level, which is a pullback support that aligns with the 38.2% Fibonacci retracement and could bounce from this level to our take profit.
Entry: 0.8107
Why we like it:
There is a pullback support that aligns with the 38.2% Fibonacci retracement.
Stop loss: 0.8034

See all ideas
Summarizing what the indicators are suggesting.
Oscillators
Neutral
SellBuy
Strong sellStrong buy
Strong sellSellNeutralBuyStrong buy
Oscillators
Neutral
SellBuy
Strong sellStrong buy
Strong sellSellNeutralBuyStrong buy
Summary
Neutral
SellBuy
Strong sellStrong buy
Strong sellSellNeutralBuyStrong buy
Summary
Neutral
SellBuy
Strong sellStrong buy
Strong sellSellNeutralBuyStrong buy
Summary
Neutral
SellBuy
Strong sellStrong buy
Strong sellSellNeutralBuyStrong buy
Moving Averages
Neutral
SellBuy
Strong sellStrong buy
Strong sellSellNeutralBuyStrong buy
Moving Averages
Neutral
SellBuy
Strong sellStrong buy
Strong sellSellNeutralBuyStrong buy
Displays a symbol's price movements over previous years to identify recurring trends.
Frequently Asked Questions
The current rate of NZDCAD is 0.80238 CAD — it has decreased by −0.15% in the past 24 hours. See more of NZDCAD rate dynamics on the detailed chart.
The value of the NZDCAD pair is quoted as 1 NZD per x CAD. For example, if the pair is trading at 1.50, it means it takes 1.5 CAD to buy 1 NZD.
The term volatility describes the risk related to the changes in an asset's value. NZDCAD has the volatility rating of 1.01%. Track all currencies' changes with our live Forex Heatmap and prepare for markets volatility.
The NZDCAD showed a 1.13% rise over the past week, the month change is a 0.74% rise, and over the last year it has decreased by −3.82%. Track live rate changes on the NZDCAD chart.
Learn how you can make money on rate changes in numerous trading ideas created by our community.
Learn how you can make money on rate changes in numerous trading ideas created by our community.
NZDCAD is a minor currency pair, i.e. a popular pair that is not associated with USD. Such pairs are also called cross currency pairs.
Currencies are usually traded through forex brokers — choose the one that suits your needs and go ahead. You can trade NZDCAD right from TradingView charts — just log in to you broker account. Check out the list of our integrated brokers and find the best one for your needs and strategy.
When deciding to buy or sell currency one should keep in mind many factors including current geopolitical situation, interest rates, and other. But before plunging into a deep research, you can start with NZDCAD technical analysis. The technical rating for the pair is strong sell today, but don't forget that markets can be very unstable, so don't stop here. According to our 1 week rating the NZDCAD shows the strong sell signal, and 1 month rating is strong sell. See more of NZDCAD technicals for a more comprehensive analysis.