NZDCADIt is time to buy the NZDCAD pair now. Rejected from a strong support area and now started to going up.
tp 0.8118
NZDCAD trade ideas

Bullish reversal in play?NZD/CAD has bounced off the pivot which is a pullback support and could rise to the 1st resistance.
Pivot: 0.80646
1st Support: 0.79985
1st Resistance: 0.81973
Disclaimer:
The above opinions given constitute general market commentary, and do not constitute the opinion or advice of IC Markets or any form of personal or investment advice.
Any opinions, news, research, analyses, prices, other information, or links to third-party sites contained on this website are provided on an "as-is" basis, are intended only to be informative, is not an advice nor a recommendation, nor research, or a record of our trading prices, or an offer of, or solicitation for a transaction in any financial instrument and thus should not be treated as such. The information provided does not involve any specific investment objectives, financial situation and needs of any specific person who may receive it. Please be aware, that past performance is not a reliable indicator of future performance and/or results. Past Performance or Forward-looking scenarios based upon the reasonable beliefs of the third-party provider are not a guarantee of future performance. Actual results may differ materially from those anticipated in forward-looking or past performance statements. IC Markets makes no representation or warranty and assumes no liability as to the accuracy or completeness of the information provided, nor any loss arising from any investment based on a recommendation, forecast or any information supplied by any third-party.

NZDCAD: Weak Bearish SignalThis pair is interesting, but must be approached with caution.
Daily Timeframe:
Price crosses below HTL, but the overall daily price action is quite chaotic so should proceed with caution
H1 Timeframe:
Price fails to make a new higher high on the intraday timeframe, which is a good sign that this uptrend is weakening
There's also greater confluence with the overall downtrend as price crosses below ATL
Another indication of downtrend is price below EMA20 and EMA20 is pushing below EMA60


NZDCAD - Possible ReversalNZDCAD is showing signs of slowing bearish momentum and is approaching tests of a resistance zone.
It is unlikely to show signs of an aggressive reversal, with possible pullbacks to test/reject support.
A longer term trade.


NZDCAD Long Trade OANDA:NZDCAD Long Trade
Entry: 0.80640 - 0.80800
TP: 0.81580
This is good trade.
Don't overload your risk like Greedy gambler!!!
Be Disciplined Trader, risk what you can afford.
Use proper risk management.
Disclaimer: Trading is risky, only idea, not advice.


NZD/CAD BULLS WILL DOMINATE THE MARKET|LONG
Hello, Friends!
NZD/CAD pair is in the uptrend because previous week’s candle is green, while the price is obviously falling on the 4H timeframe. And after the retest of the support line below I believe we will see a move up towards the target above at 0.816 because the pair is oversold due to its proximity to the lower BB band and a bullish correction is likely.
Disclosure: I am part of Trade Nation's Influencer program and receive a monthly fee for using their TradingView charts in my analysis.
✅LIKE AND COMMENT MY IDEAS✅

VWAP Deviation Trap - Bulls Spring at Key Support🎯 NZDCAD: VWAP Deviation Trap - Bulls Spring at Key Support
The Market Participant Battle:
This setup reveals a powerful institutional accumulation pattern where bears repeatedly get trapped at the daily VWAP's 1st standard deviation. Each time price touches this level (visible at points 1, 2, and now 4), the reaction becomes increasingly violent to the upside. Sellers who pushed NZDCAD below the 0.8070 support level (point 2) got caught in a liquidity trap as institutional buyers absorbed all selling pressure. The current setup at point 4 shows price once again piercing below the VWAP 1st deviation, setting up for the most powerful reversal yet as trapped shorts are forced to cover.
Trade Parameters:
- Entry: 0.80816 (reclaim above VWAP 1st deviation)
- Stop Loss: 0.80302 (-0.37% risk)
- Take Profit: 0.82354 (+1.90% reward)
- Risk/Reward Ratio: 5.09:1
- Position Size: 82,781 units
Confluences:
Confluence 1: VWAP Standard Deviation Accumulation Pattern
The daily VWAP 1st standard deviation has become a massive accumulation zone for institutional buyers. Each touch (marked at points 1, 2, and 4) shows increasingly powerful bounces - a classic sign of smart money accumulating a position. The pattern shows: dip below the line → trap sellers → aggressive reversal higher. This third test at point 4 should produce the strongest reaction yet, as it represents the final shakeout before the major move higher.
Confluence 2: Hidden Bullish Divergence
While price is creating a higher low structure on the 4H timeframe, both RSI and MFI are showing lower lows - this is a textbook hidden bullish divergence. Combined with the VWAP deviation support, this divergence confirms the continuation pattern. The RSI extreme oversold conditions at this key level historically lead to explosive reversals.
Confluence 3: OBV Trend Structure
The On Balance Volume (OBV) has maintained its uptrend throughout the recent price pullback and has just pierced the lower Bollinger Band. This volume/price divergence at the VWAP deviation level indicates institutional accumulation is accelerating. The OBV bounce from the lower band while at VWAP support creates a triple confluence zone.
Confluence 4: Footprint Validation
The hourly footprint chart shows NO delta divergence on recent highs, confirming genuine institutional demand. Total delta shows 1.05K positive with 293 contracts at the ask versus only 67 at the bid. This absorption pattern at the VWAP deviation confirms smart money is defending this level aggressively.
Web Research Findings:
- Technical Analysis: NZDCAD showing oversold conditions with support at 0.8069-0.8082 holding firm
- Recent News/Earnings: New Zealand maintains 3% rate while Canada cut to 2.5% (Sept 17) - 50bp differential favoring NZD
- Analyst Sentiment: Recent notes highlight bullish structure breaks and inverted H&S patterns forming
- Data Releases: Canada's Trade Balance improved but rate differential dominates price action
- Interest Rate Impact: RBNZ holding firm while BOC actively cutting creates powerful carry trade dynamics
Layman's Summary:
Think of the VWAP 1st deviation as a "wholesale price" where big institutions love to buy. Every time price reaches this level (3 times now), buyers step in more aggressively. It's like a spring being compressed - each push down creates more energy for the bounce up. Combined with New Zealand offering 0.5% more interest than Canada (3% vs 2.5%), professional traders are piling into this setup. Our entry catches the move as price reclaims this critical level, with exceptional 5:1 reward to risk.
Machine Derived Information:
- VWAP Pattern: Three tests of 1st deviation with increasing bounce strength - Significance: Institutional accumulation zone confirmed - AGREES ✔
- Footprint Data: 1.05K positive delta absorption at lows - Significance: Smart money defending support - AGREES ✔
- Hidden Divergences: RSI/MFI diverging from price at VWAP support - Significance: Continuation pattern confirmed - AGREES ✔
- Trade Setup: Entry at 0.80816 with 5.09:1 R/R - Significance: Optimal risk/reward at key technical level - AGREES ✔
Actionable Machine Summary:
The convergence of VWAP 1st deviation support, hidden bullish divergences, and footprint absorption creates a rare high-probability setup. Each VWAP deviation test has produced increasingly powerful reversals - this third test at point 4 should generate the strongest move yet. Entry at 0.80816 as price reclaims the VWAP deviation offers perfect timing with a tight stop at 0.80302 and target at 0.82354, delivering an exceptional 5.09:1 reward/risk ratio.
Conclusion:
Trade Prediction: SUCCESS
Confidence: Very High
This trade combines a powerful VWAP accumulation pattern with multiple technical confirmations. The three-touch pattern at the VWAP 1st deviation, with each bounce stronger than the last, suggests massive institutional accumulation. Combined with the 50bp rate differential, hidden divergences, and footprint confirmation, this presents an A+ setup. The 5.09:1 risk/reward ratio at such a high-probability level makes this a must-take trade for any serious trader.

NZDCAD: Short Trade Explained
NZDCAD
- Classic bearish formation
- Our team expects fall
SUGGESTED TRADE:
Swing Trade
Sell NZDCAD
Entry Level - 0.8230
Sl - 0.8235
Tp - 0.8221
Our Risk - 1%
Start protection of your profits from lower levels
Disclosure: I am part of Trade Nation's Influencer program and receive a monthly fee for using their TradingView charts in my analysis.
❤️ Please, support our work with like & comment! ❤️

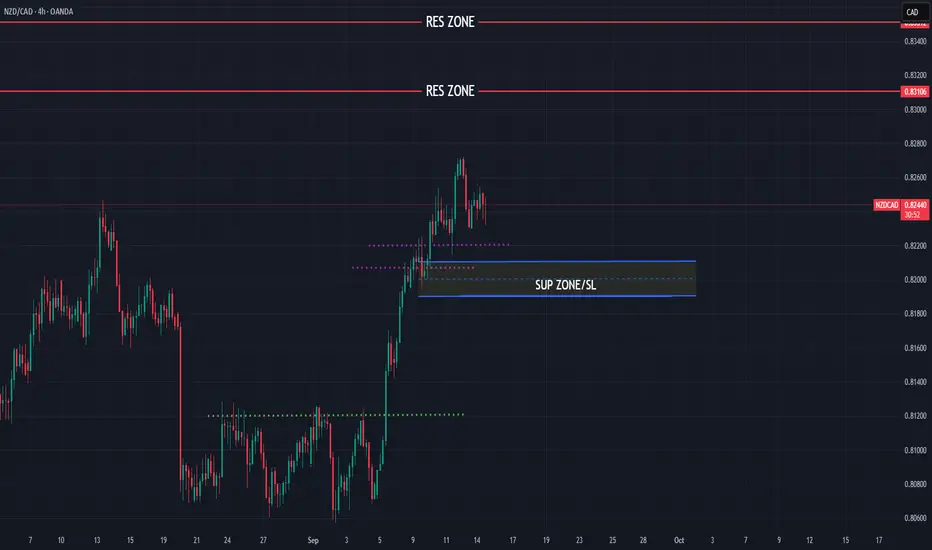
NZDCAD still bullish view
OANDA:NZDCAD we are have strong bullish push, currently price in consolidation zone, still here for next periods we can expect bullish.
SUP zone: 0.82100
RES zone: 0.83100, 0.83500
NZDCAD 4H PERSP.This technical analysis is again about sell and bear market! But with 4H timeframe.
As we see in this chart, we got oriented market on if the price will reach LL which is current most near and strong support level for this pair.
* PAWS ARE NEAR!!! GRR... xD
Have a profitable trading!

NZDCAD H1NZDCAD has been bullish and currently pulling back to the famous 0.5-0.618 fib.
Confluences:
- Price forming HHs & HLs
- Price pulling back to 0.5 fib
- Price in ascending channel
- Price in sync with RSI

Applying the Nx BIAS indicator to NZDCAD After my latest thread about the 🛡️ Nx BIAS 🛡️ indicator for determining market bias, I decided to take a scalp trade as a backtesting exercise on the NZDCAD pair.
Entry details:
Defined the DOL and Invalidation levels using the Nx Bias indicator on the 1H timeframe.
Identified the area of interest and executed the entry on the 1m timeframe for the same pair.
Next steps and forward testing:
I will be testing this indicator more extensively. The main goal is to rely solely on it for bias determination under live market conditions to evaluate its real-time performance, moving beyond backtesting results.
Disclaimer: Do Your Own Research (DYOR).
Best regards,
Note: The indicator is not yet available and will be released soon under the name Nx Candle Bias.
NZD/CAD – Short Setup on False BreakoutThe pair is moving inside a descending channel. Price is now trying to move above the upper boundary.
The plan is that the market may form a false breakout above the previous highs and the channel line, and then return back into the blue range.
📌 Plan: establish a short position in the 0.826–0.8265 zone once a BC is confirmed.
Stop-loss: very wide, beyond 0.829
Take-profit: quoter-line of the channel around 0.8195
Risk/Reward: about 1:2
💡 Rationale: the descending channel structure remains intact. A breakout followed by a quick return would provide a clean short entry with limited risk.

NZDCAD - Expecting Bullish Continuation In The Short TermH1 - Strong bullish momentum.
No opposite signs.
Until the two Fibonacci support zones hold I expect the price to move higher further.
If you enjoy this idea, don’t forget to LIKE 👍, FOLLOW ✅, SHARE 🙌, and COMMENT ✍! Drop your thoughts and charts below to keep the discussion going. Your support helps keep this content free and reach more people! 🚀
--------------------------------------------------------------------------------------------------------------------


NZDCAD Short
ENTRY Market: 0.82052
SL 0.82358
TP 0.81746
The asset is currently overvalued versus the dollar index. I expect a short-term retracement.

NZDCAD: Trading Signal From Our Team
NZDCAD
- Classic bearish pattern
- Our team expects retracement
SUGGESTED TRADE:
Swing Trade
Sell NZDCAD
Entry - 0.8230
Stop - 0.8238
Take - 0.8216
Our Risk - 1%
Start protection of your profits from lower levels
Disclosure: I am part of Trade Nation's Influencer program and receive a monthly fee for using their TradingView charts in my analysis.
❤️ Please, support our work with like & comment! ❤️

NZDCAD Will Go UP!
HI,Traders !
#NZDCAD is trading in a
Local uptrend and the pair
Made a local correction
But will soon retest a
Horizontal support of 0.81257
From where we will be expecting
A further move up as we
Are locally bullish biased !
Comment and subscribe to help us grow !

Chronex | NZDCAD • LONG • Conviction • HighHello Guys!
🎯 90 % mechanical | Just your entry model
No trend-line art, no gut calls. Just a repeatable institutional process delivered every day at London Open
Context:
🧠 What Chronex does (bird’s-eye view)
- Scans all 28 major FX pairs every session.
- Ranks each currency’s relative strength / weakness from multi-TF data.
- Pairs strongest vs. weakest to create a tight outlook list.
- Adds built-in risk filters → posts one clean table: *Direction · Conviction · Entry zone · SL*.
📍 Today’s Playbook:
Risks
1. Do we have economic high impact news release?
2. Any higher-timeframe counter-trend zones?
3. Has better zone above/below?
Verdict:
💬 Drop questions, challenge the outlook, or share your own setups below!

NZD/CAD BEST PLACE TO SELL FROM|SHORT
Hello, Friends!
NZD-CAD uptrend evident from the last 1W green candle makes short trades more risky, but the current set-up targeting 0.812 area still presents a good opportunity for us to sell the pair because the resistance line is nearby and the BB upper band is close which indicates the overbought state of the NZD/CAD pair.
Disclosure: I am part of Trade Nation's Influencer program and receive a monthly fee for using their TradingView charts in my analysis.
✅LIKE AND COMMENT MY IDEAS✅
