NZDCAD BUY Could this be a possible BUY for NZDCAD?
The market is currently testing a Fib zone, and we could see buyers showing strength and sellers loosing momentum.
Let's see how this plays out.
NZDCAD trade ideas

DeGRAM | NZDCAD strcuture based tradeNZDCAD is approaching the major structure support level completing the bullish harmonic pattern.
Price action broke the ascending channel.
The market shows a divergence, which means we might see a retest of the resistance level.
We expect structure based trade.
-------------------
Share your opinion in the comments and support the idea with like. Thanks for your support!

NZDUSD H4 | Falling to support level?Based on the H4 chart analysis, we can see that the price has just reacted off our sell entry at 0.8080, which is an overlap resistance that aligns with a 23.6% Fibo retracement.
Our take profit will be at 0.8036, The stop loss will be placed at 0.8136, which is an overlap resistance level.
High Risk Investment Warning
Trading Forex/CFDs on margin carries a high level of risk and may not be suitable for all investors. Leverage can work against you.
Forex Capital Markets Limited (www.fxcm.com):
CFDs are complex instruments and come with a high risk of losing money rapidly due to leverage. 70% of retail investor accounts lose money when trading CFDs with this provider. You should consider whether you understand how CFDs work and whether you can afford to take the high risk of losing your money..
Stratos Europe Ltd, previously FXCM EU Ltd (www.fxcm.com):
CFDs are complex instruments and come with a high risk of losing money rapidly due to leverage. 74% of retail investor accounts lose money when trading CFDs with this provider. You should consider whether you understand how CFDs work and whether you can afford to take the high risk of losing your money.
FXCM Australia Pty. Limited (www.fxcm.com):
Trading FX/CFDs carries significant risks. FXCM AU (AFSL 309763), please read the Financial Services Guide, Product Disclosure Statement, Target Market Determination and Terms of Business at www.fxcm.com
Stratos Global LLC (www.fxcm.com):
Losses can exceed deposits.
Please be advised that the information presented on TradingView is provided to FXCM (‘Company’, ‘we’) by a third-party provider (‘TFA Global Pte Ltd’). Please be reminded that you are solely responsible for the trading decisions on your account. There is a very high degree of risk involved in trading. Any information and/or content is intended entirely for research, educational and informational purposes only and does not constitute investment or consultation advice or investment strategy. The information is not tailored to the investment needs of any specific person and therefore does not involve a consideration of any of the investment objectives, financial situation or needs of any viewer that may receive it. Kindly also note that past performance is not a reliable indicator of future results. Actual results may differ materially from those anticipated in forward-looking or past performance statements. We assume no liability as to the accuracy or completeness of any of the information and/or content provided herein and the Company cannot be held responsible for any omission, mistake nor for any loss or damage including without limitation to any loss of profit which may arise from reliance on any information supplied by TFA Global Pte Ltd.
The speaker(s) is neither an employee, agent nor representative of FXCM and is therefore acting independently. The opinions given are their own, constitute general market commentary, and do not constitute the opinion or advice of FXCM or any form of personal or investment advice. FXCM neither endorses nor guarantees offerings of third party speakers, nor is FXCM responsible for the content, veracity or opinions of third-party speakers, presenters or participants.

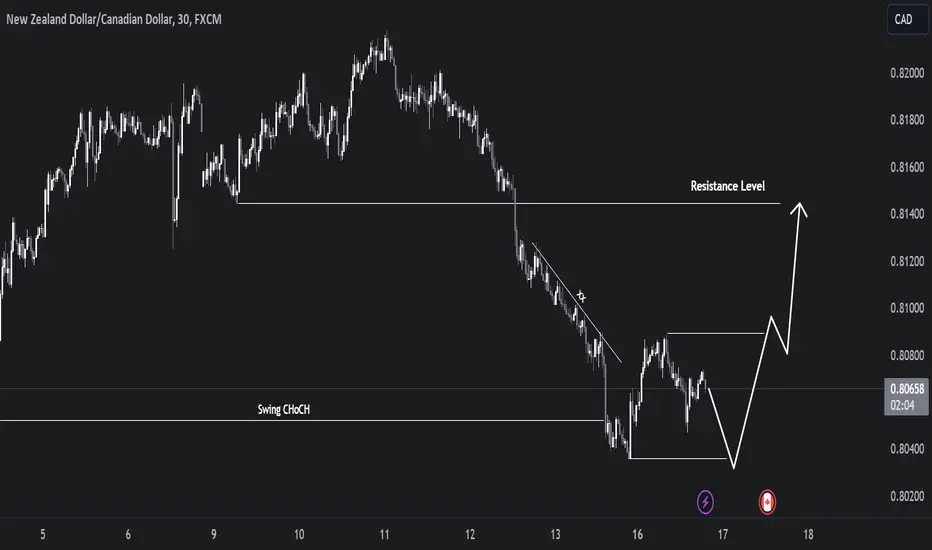
NZD/CAD OutlookWe remain a bit neutral on NZD/CAD with potential upside movement in the coming days. As you can see we recently created a bearish swing CHoCH on the 30m timeframe. There is trend line liquidity resting above current price and we are waiting for an accumulation model as displayed by the arrows to occur and price to make its pullback. This would be counter trend on the current timeframe so be sure to get that confirmation and be smart with targets and extensions.
NZDCAD, A good short position can be catch......#NZDCAD
UPDATE
Hey traders,Welcome to Anna trade charts.
Hope you are enjoying your trading journey and also our trading analysis. Today Anna's team is going to share an updated analysis on #NZDCAD according to Anna's instructions.
As, NZDCAD was in an uptrend from so long and now it change the character in the HTF, which is possible indication of trend reversal. As we can see that we had multiple zones where it can take possible turn to the down side, but bottom two zones are low probability zone and we can take risky entry, but from the top OB, we can see a good short entry after confirmation in the LTF.
This can be good selling position in the LTF. We can get up to 350+ pips.
Stay with us for updated worthy analysis....✍️

NZDCAD - Getting ready to make downward move?NZDCAD - A harmonic reversal pattern is being formed with the defined potential reversal zone (PRZ), It will most likely test the PRZ and make a downward move. A bearish RSI divergence is also supporting this idea. Sell stop entry can be taken at the breakout of previous Higher Low with TP set at a 1:1.3 Risk Reward, which is coinciding with a strong demand zone.

BluetonaFX - NZDCAD SHORT to Monthly Low IdeaHi Traders!
There is a possible retest of the strong support level of 0.80531, and there are potential opportunities for short entries towards this level.
Price Action 📊
The market is currently in a descending price channel and recently broke and closed below the 20 EMA, which suggests that there is currently bearish momentum in the market.
We are looking for the bearish momentum to continue with a look to target the support level of 0.80531, which is also the monthly low.
Fundamental Analysis 📰
Recent data out of New Zealand has not been as strong as analysts would have liked, which may lead to possible NZD weakness for the time being. Additionally, the NZD seems to be weaker following the release of Chinese inflation figures, which has an effect on antipodean currencies.
Support 📉
0.80531: MONTHLY LOW
Resistance 📈
0.81203: PREVIOUS DAY'S HIGH
Risk ⚠️
No more than 2% of your capital.
Reward 💰
At least 4% of your capital.
Please make sure to click on the like/boost button 🚀 as your support greatly helps.
Trade safely and responsibly.
BluetonaFX

NZDCAD - Bearish ReversalThe pair has started making a bullish divergence in the bearish trend. Plus, the market sentiments are towards the long trade. We will buy it on the reversal maturity of the new bull rally. Let's hope the trade goes as planned on the chart.

NZDCAD Long Term SELLING Trading IdeaHello Traders
In This Chart NZDCAD DAILY Forex Forecast By FOREX PLANET
today NZDCAD analysis 👆
🟢This Chart includes_ (NZDCAD market update)
🟢What is The Next Opportunity on NZDCAD Market
🟢how to Enter to the Valid Entry With Assurance Profit
This CHART is For Trader's that Want to Improve Their Technical Analysis Skills and Their Trading By Understanding How To Analyze The Market Using Multiple Timeframes and Understanding The Bigger Picture on the Charts

NZDCAD Potential DownsidesHey Traders, in the coming week we are monitoring NZDCAD for a selling opportunity around 0.80600 zone, NZDCAD was trading in an uptrend and successfully managed to break it out. Currently we are waiting for a correction in order to see a potential retrace of the trend towards more lows.
Trade safe, Joe.

NZD/CAD Buy Idea 13/10/23Trade Details
NZD/CAD Buy Limit
Entry: 0.8087
Take Profit 1: 0.8132
Take Profit 2: 0.8187
Take Profit 3: 0.8249
Stop Loss: 0.8066
Key Notes
Order flow: Bullish
Trend: Bullish
Structure: Broken
Entry at order block
Disclaimer:
This is just a sample template and should not be used as financial advice. Always do your own research before making any trading decisions.

Short term fall but a long term to the upsideNo more talking, the chart sows a potential down fall on a pull back (complex correction) of the Elliot Wave Count, for a wave Z completion and there after a long way to the upside for development of either W3 or WC. Let`s keep our eyes open for tis promising opportunity. All the very best. Remember to employ a good risk management.

NZDCAD - Long from bullish order block ✅Hello traders!
‼️ This is my perspective on NZDCAD.
Technical analysis: Here we are in a bullish market structure from 4H timeframe perspective, so I am looking for long. I want price to make a retracement to fill the imbalance lower and then to reject from bullish order block.
Like, comment and subscribe to be in touch with my content

NZDCAD I Long Opportunity from Support
Welcome back! Let me know your thoughts in the comments!
** NZDCAD Analysis - Listen to video!
We recommend that you keep this pair on your watchlist and enter when the entry criteria of your strategy is met.
Please support this idea with a LIKE and COMMENT if you find it useful and Click "Follow" on our profile if you'd like these trade ideas delivered straight to your email in the future.
Thanks for your continued support!

NZDCAD - As Oil Prices Decrease So Does The CAD!Analysis:
Bullish Confluences
Recent breakout of longer term downwards trend
In an upwards trend
Retesting an area of significance
50% fib retracement level touched
Bullish pennant pattern formed & broken out of
The NZD is the 4th strongest major currency whereas the CAD is the 3rd weakest major currency
5K long position increase for the NZD
2K short position decrease for the NZD
12K short position increase for the CAD
Bearish Confluences
5K long position increase for the CAD
Recent CAD news has been bullish
Stay Safe - The JPI Team
Please feel free to leave any comments you have and like this idea if you agree with us. Any feedback or comments will be read and responded to. We appreciate any comments at all so thank you!
Disclaimer:
This does not constitute as financial advise. We are not responsible for any monetary loss that you endure. Trading is hard to be profitable with and we take losses just like everyone else does too. Our ideas won't always be correct which is why we urge you to always do your own analysis first before entering into the market but please feel free to use our analysis to assist you with yours.

NZDCAD H4 | Bounce off 23.6% Fibo support?NZD/CAD is falling towards an overlap support and could potentially bounce off this level to climb higher.
Buy entry is at 0.81641 which is an overlap support that aligns with the 23.6% Fibonacci retracement level.
Stop loss is at 0.81180 which is a level that sits under an overlap support and the 38.2% Fibonacci retracement level.
Take profit is at 0.82181 which is a recent swing-high resistance.
High Risk Investment Warning
Trading Forex/CFDs on margin carries a high level of risk and may not be suitable for all investors. Leverage can work against you.
Forex Capital Markets Limited (www.fxcm.com):
CFDs are complex instruments and come with a high risk of losing money rapidly due to leverage. 70% of retail investor accounts lose money when trading CFDs with this provider. You should consider whether you understand how CFDs work and whether you can afford to take the high risk of losing your money.
Stratos Europe Ltd, previously FXCM EU Ltd (www.fxcm.com):
CFDs are complex instruments and come with a high risk of losing money rapidly due to leverage. 74% of retail investor accounts lose money when trading CFDs with this provider. You should consider whether you understand how CFDs work and whether you can afford to take the high risk of losing your money.
FXCM Australia Pty. Limited (www.fxcm.com):
Trading FX/CFDs carries significant risks. FXCM AU (AFSL 309763), please read the Financial Services Guide, Product Disclosure Statement, Target Market Determination and Terms of Business at www.fxcm.com
Stratos Global LLC (www.fxcm.com):
Losses can exceed deposits.
Please be advised that the information presented on TradingView is provided to FXCM (‘Company’, ‘we’) by a third-party provider (‘TFA Global Pte Ltd’). Please be reminded that you are solely responsible for the trading decisions on your account. There is a very high degree of risk involved in trading. Any information and/or content is intended entirely for research, educational and informational purposes only and does not constitute investment or consultation advice or investment strategy. The information is not tailored to the investment needs of any specific person and therefore does not involve a consideration of any of the investment objectives, financial situation or needs of any viewer that may receive it. Kindly also note that past performance is not a reliable indicator of future results. Actual results may differ materially from those anticipated in forward-looking or past performance statements. We assume no liability as to the accuracy or completeness of any of the information and/or content provided herein and the Company cannot be held responsible for any omission, mistake nor for any loss or damage including without limitation to any loss of profit which may arise from reliance on any information supplied by TFA Global Pte Ltd.
The speaker(s) is neither an employee, agent nor representative of FXCM and is therefore acting independently. The opinions given are their own, constitute general market commentary, and do not constitute the opinion or advice of FXCM or any form of personal or investment advice. FXCM neither endorses nor guarantees offerings of third party speakers, nor is FXCM responsible for the content, veracity or opinions of third-party speakers, presenters or participants.

A Symphonic-PatternSymphonic Pattern :
Probable pattern with strong and repeatable probability in the markets.
This type of pattern is obtained based on mathematical and statistical calculations on past pivots and waves

nzdcad
📣 In the light of the 1-hour chart structure, a break below the ascending trendline around 0.8173 may offer selling opportunities with a target at 0.8120.
⛔ Stop Loss: 0.8205

NZDCAD - PATTERN LINE RESISTANCE AREANZDCAD - Bearish engulfing bar in the resistance area of pattern line at the day time frame. trading edge has been accomblished

NZDCAD Trade IdeaHello Traders, Base on technical and wave analysis we see this scenario for #NZDCAD for next move. let me know in the comment section below if you have any questions, the entry will be taken only if all rules of the strategies will be satisfied. I suggest you keep this pair on your watchlist and see if the rules of your strategy are satisfied.

what im expecting this week on nzdcadsmall possibility of getting another opportunity to enter long on nzdcad , but still a possibility

NZDCAD October 11th, 2023The NZDCAD pair on the daily chart displays a prominent trendline acting as both support and resistance. Currently, the price is in close proximity to the resistance area, and traders may consider placing a sell stop order near blue diagonal square area. This technical approach is supported by observations of the stochastic indicator, which has exhibited a crossover above the overbought zone. Historical instances suggest that such crossovers indicate a potential shift towards a bearish trend.
It is advisable to wait and see, delaying the entry until the price reaches the resistance level. The bearish movement is targeted towards 0.807, a zone that has previously served as a rebound area.

