OBOL $0.15 as soon as possibleHello,
I think Obol pump as soon as possible and very fast price go to the $0.15 and more.
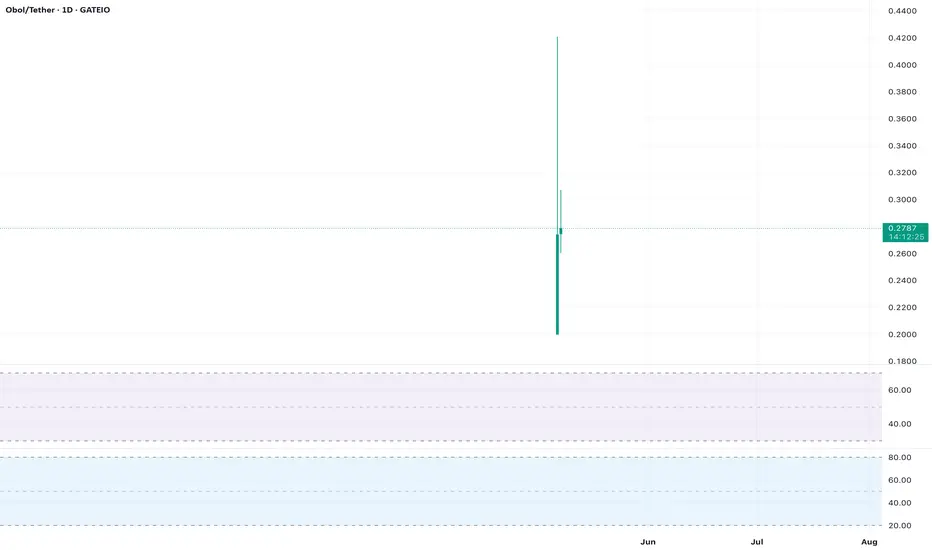
The total tokens in circulation are less than 100 million, but volumes above 200 million on a particular exchange are unusual and indicate a price manipulation that is caused by lowering the price and collecti

OBOL/USDT inverse H&S OBOL has been trading in a range between $0.10 – $0.16 over the past 44 days, forming a clear Inverse Head and Shoulders pattern — a classic bullish reversal signal.
The price action is now showing strong signs of upward momentum, suggesting a potential breakout from this consolidation zone.
Patte

OBOL/USDT Bullish continuationOBOL is creating higher highs and higher lows with clean structure. We have just created the last higher low at 0.1420 and I am expecting to see a new high created above structure.
My target is 0.1665
SL is 0.1345

OBOL/USDT – Bullish Breakout with Retest in PlayOBOL/USDT
Analysis Summary:
The chart shows a potential breakout from a horizontal consolidation range after a period of accumulation. A range breakout is highlighted, with a projected target based on the height of the range.
Key points:
Price is currently retesting the breakout zone, a common

Post-Airdrop FOMO Fade Drives Selling PressureAnalysis: X posts suggest $OBOL’s recent price action is driven by a post-airdrop FOMO fade, with strong selling after the May 7, 2025, Token Generation Event (TGE). The price is below the 50-day EMA, and the Chaikin Money Flow (CMF) indicates capital outflows. A short targeting $0.215 is viable if

Fibonacci Retracement Points to Deeper CorrectionAnalysis: Applying Fibonacci retracement from the all-time high ($0.380077) to the all-time low ($0.284628), $OBOL is below the 0.236 Fib level ($0.305). The next support lies at the 0.382 Fib level ($0.25), aligning with major support noted in X posts. The lack of bullish volume and a bearish MACD
Volume Profile Shows Thin Support Below $0.29Analysis: The volume profile indicates low buying interest between $0.29 and $0.25, creating a “value gap” where the price could slide quickly. The price is below the Volume Weighted Average Price (VWAP), and the 20-day EMA is sloping downward, confirming bearish momentum. A break below $0.285 targe

Bearish Trendline Resistance Caps UpsideAnalysis: $OBOL is trading below a descending trendline formed since its all-time high of $0.380077 on May 7, 2025. Attempts to break above $0.30 have been rejected with low buying volume, signaling weak bullish conviction. The Stochastic Oscillator is in the overbought zone on the 1-hour chart, sug

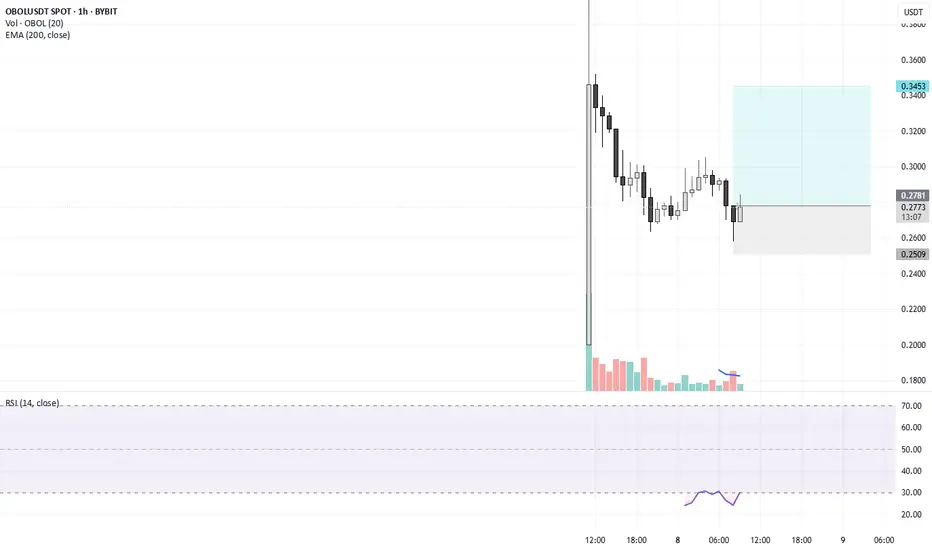
OBOL USDTCP 0.2776
BUY: 0.026 TO 0.29
SELL 0.345 OR MORE
SL: 0.25
high volume
new project can b pump any time.
Oversold CRSI Signals Short-Term Bearish ContinuationAnalysis: Recent X posts note that the Composite RSI (CRSI) for $OBOL is in extremely oversold territory, typically a bearish signal post-FOMO airdrop. The price is below the 200-day SMA, and the MACD histogram is deepening, indicating sustained selling pressure. A drop to $0.235 is plausible if the

See all ideas